. 2021 Jan 1;35(1-2):59-64.
doi: 10.1101/gad.340919.120. Epub 2020 Dec 10.

mTOR inhibition acts as an unexpected checkpoint in p53-mediated tumor suppression

Affiliations

mTOR inhibition acts as an unexpected checkpoint in p53-mediated tumor suppression

Ning Kon et al. Genes Dev. .

Erratum in

Abstract

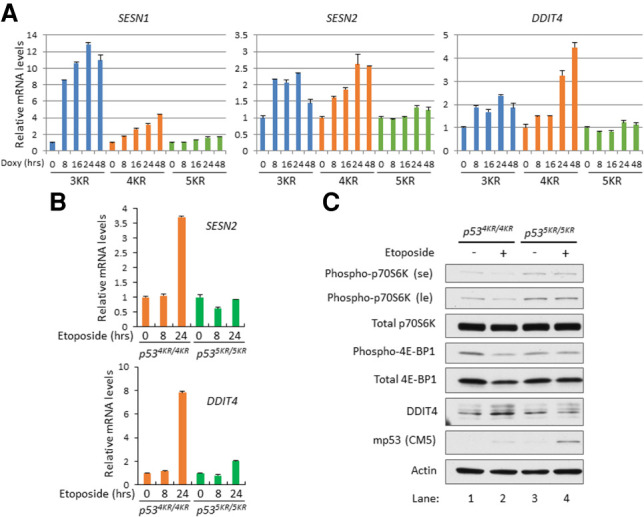
Here, we showed that the acetylation-defective p53-4KR mice, lacking the ability of cell cycle arrest, senescence, apoptosis, and ferroptosis, were tumor prone but failed to develop early-onset tumors. By identifying a novel p53 acetylation site at lysine K136, we found that simultaneous mutations at all five acetylation sites (p53-5KR) diminished its remaining tumor suppression function. Moreover, the embryonic lethality caused by the deficiency of mdm2 was fully rescued in the background of p535KR/5KR , but not p534KR/4KR background. p53-4KR retained the ability to suppress mTOR function but this activity was abolished in p53-5KR cells. Notably, the early-onset tumor formation observed in p535KR/5KR and p53-null mice was suppressed upon the treatment of the mTOR inhibitor. These results suggest that p53-mediated mTOR regulation plays an important role in both embryonic development and tumor suppression, independent of cell cycle arrest, senescence, apoptosis, and ferroptosis.

Keywords: DDIT4/REDD1; Mdm2; SESN2; acetylation; mTOR; p53; transcriptional regulation; tumor suppression.


Figures

Figure 1.
Figure 1.
p53-4KR mice are tumor prone but with a long tumor latency. (A) Kaplan–Meier survival analysis of p53-4KR mice with wild-type, p53-3KR, and p53-null mice included as controls. Statistical values (P) are indicated. (B) Representative pictures of wild-type thymus (panels 1–4), thymoma from p53-4KR mouse (panels 5–8), wild-type spleen (panels 9–12), and splenomegaly from p53-4KR mouse (panels 13–16). (Panels 1,5,9,13) Gross appearances. (Panels 2,6,10,14) Hematoxylin and eosin (H&E) staining 40×. (Panels 3,7,11,15) H&E staining 200×. (Panels 4,8,12,16 ) Immunostaining of p53. (C) Metastases in liver and kidney of a p53-4KR mouse with thymoma. (Panels 1–3) Wild-type liver, (Panels 4–7) liver from the p53-4KR mouse. (Panels 8–10) Wild-type kidney. (Panels 11–14) Kidney from the p53-4KR mouse. (Panels 1,4,8,11) H&E staining. (Panels 2,5,9,12) Immunostaining of p53. (Panels 3,6,10,13) Immunostaining of ki67. (Panels 7,14) Immunostaining of CD3. (D) Pictures of representative embryos. (Panel 1) p533KR/3KR, E14.5. (Panel 2) p534KR/4KR, E14.5. (Panel 3) p534KR/4KR, E16.5. (Panel 4) p533KR/3KR/mdm2−/−, E14.5. (Panel 5) p534KR/4KR/mdm2−/−, E14.5. (Panel 6) p534KR/4KR/mdm2−/−, E16.5. An asterisk indicates edema.
Figure 2.
Figure 2.
Identification of a novel acetylation site in p53 DNA binding domain and its role in tumor suppression. (A) A new p53 acetylation site K139 was identified by mass spectrometry, which is conserved in human, mouse, and rat p53. (B) Human p53 K139, which is K136 in mouse p53, locates in DNA-binding domain among the previously identified acetylation sites. (C) Acetylation of p53 K139 by cotransfection with acetyltransferase Tip60 or CBP. After immunoprecipitation, K139 acetylation was detected by Western blot using the anti-p53 acetylated K139 antibody. The total protein levels for p53 was detected by DO-1 antibody. (D) Acetylation on K139 of endogenous p53 in U2OS cells treated with doxorubicin. After immunoprecipitation, K139 acetylation was detected by Western blot using the anti-p53 acetylated K139 antibody. (E) Representative tumors in p53-5KR mice. (Panel 1) Thymoma. (Panel 2) B-lymphoma. (F) Kaplan–Meier tumor-free survival curves of p53 mutant mice. Statistical values (P) are indicated.
Figure 3.
Figure 3.
p53-dependent regulation of SESN1, SESN2, and DDIT4, and the effects in suppression of mTOR signaling. (A) The relative mRNA levels of sesn1, sesn2, and DDIT4, determined by RT-PCR assays, in H1299 cells treated with doxycycline for 0, 8, 16, 24, and 48 h to express p53 mutants. (B) The relative mRNA levels of sesn2 and DDIT4 in p534KR/4KR and p535KR/5KR MEFs treated with etoposide for 0, 8, and 24 h. (C) Effects on mTOR signaling after activation of p53 by treating p53-4KR and p53-5KR MEFs with etoposide. The whole-cell extracts were analyzed by Western blotting with antibodies as indicated. The levels of actin were used for the protein loading control. (se) Short exposure, (le) long exposure.
Figure 4.
Figure 4.
Tumor suppression through inhibiting mTOR signaling. (A) A representative picture of p535KR/5KR/mdm2−− and p535KR/5KR mice. (B) Representative pictures of thymoma from p535KR/5KR mice on control (panel 1) and rapamycin-containing (panel 2) diet. (C) Kaplan–Meier survival curves of p535KR/5KR mice on the control and rapamycin containing diet. (D) Kaplan–Meier survival curves of p53-null mice on the control and rapamycin containing diet. Statistical values (P) are indicated. (E) Western blot of the whole-cell extracts from wild-type thymus (lane 1) and from tumor samples of p53-4KR mice (lanes 2,3), p53-5KR mice on control diet (lanes 4,5), p53-5KR mice on the rapamycin diet (lanes 6,7), p53-null mice on the control diet (lanes 8,9), and p53-null mice on the rapamycin diet (lanes 10,11) using antibodies of anti-phospho-4E-BP1 and anti-total 4E-BP1. The levels of actin were used as the protein loading control.

References

    1. Brady CA, Jiang D, Mello SS, Johnson TM, Jarvis LA, Kozak MM, Kenzelmann Broz D, Basak S, Park EJ, McLaughlin ME, et al. 2011. Distinct p53 transcriptional programs dictate acute DNA-damage responses and tumor suppression. Cell 145: 571–583. 10.1016/j.cell.2011.03.035 - DOI - PMC - PubMed
    1. Brugarolas J, Lei K, Hurley RL, Manning BD, Reiling JH, Hafen E, Witters LA, Ellisen LW, Kaelin WG Jr. 2004. Regulation of mTOR function in response to hypoxia by REDD1 and the TSC1/TSC2 tumor suppressor complex. Genes Dev 18: 2893–2904. 10.1101/gad.1256804 - DOI - PMC - PubMed
    1. Budanov AV. 2011. Stress-responsive sestrins link p53 with redox regulation and mammalian target of rapamycin signaling. Antioxid Redox Signal 15: 1679–1690. 10.1089/ars.2010.3530 - DOI - PMC - PubMed
    1. Budanov AV, Karin M. 2008. P53 target genes sestrin1 and sestrin2 connect genotoxic stress and mTOR signaling. Cell 134: 451–460. 10.1016/j.cell.2008.06.028 - DOI - PMC - PubMed
    1. Chu B, Kon N, Chen D, Li T, Liu T, Jiang L, Song S, Tavana O, Gu W. 2019. ALOX12 is required for p53-mediated tumour suppression through a distinct ferroptosis pathway. Nat Cell Biol 21: 579–591. 10.1038/s41556-019-0305-6 - DOI - PMC - PubMed

Publication types

MeSH terms