. 2021 Jan 29;371(6528):eabc8059.
doi: 10.1126/science.abc8059. Epub 2020 Dec 10.

Inhibition of prostaglandin-degrading enzyme 15-PGDH rejuvenates aged muscle mass and strength

Affiliations

Inhibition of prostaglandin-degrading enzyme 15-PGDH rejuvenates aged muscle mass and strength

A R Palla et al. Science. .

Abstract

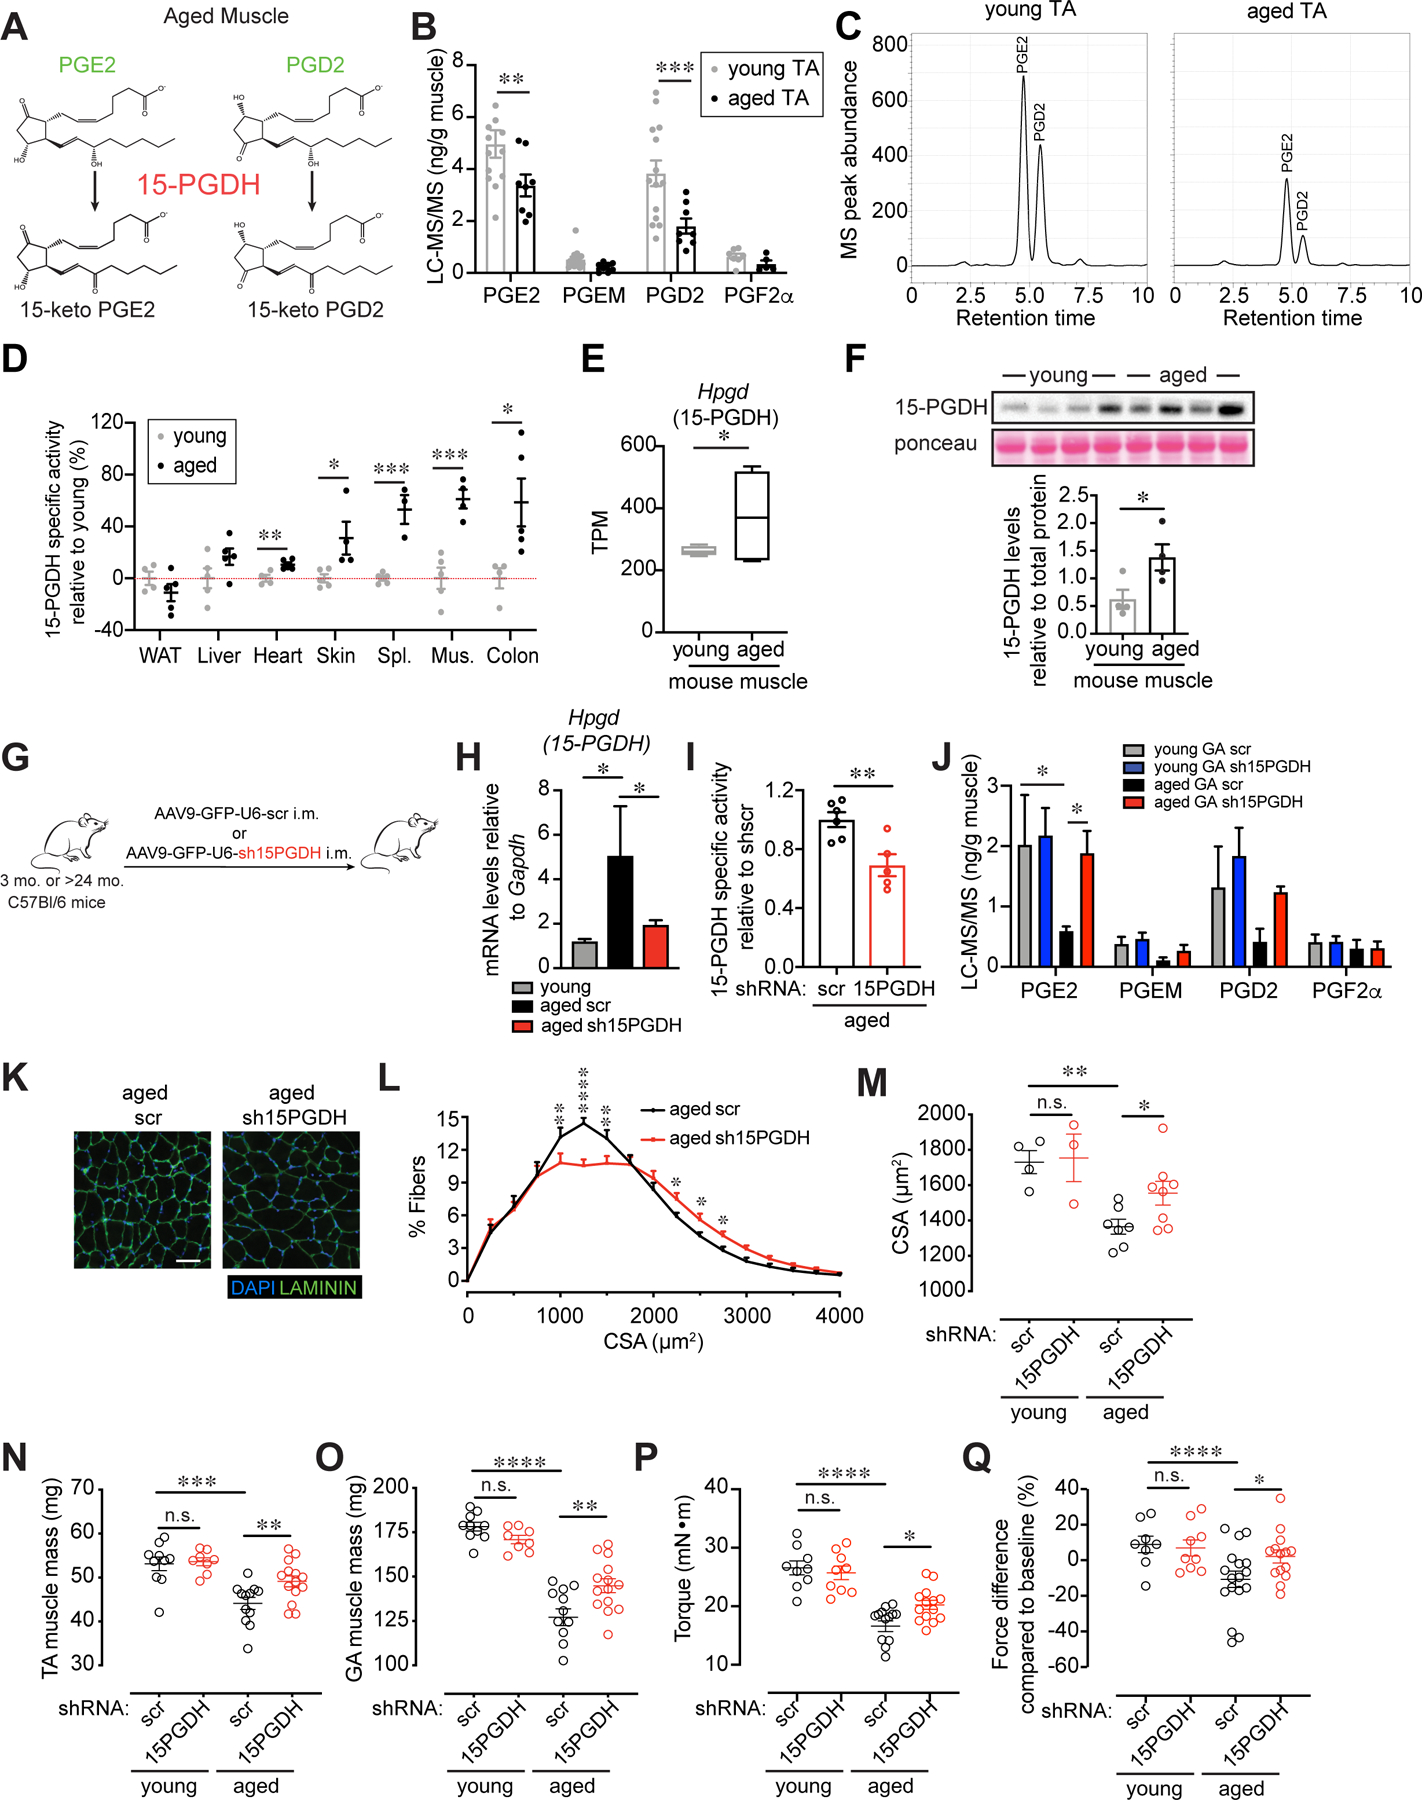
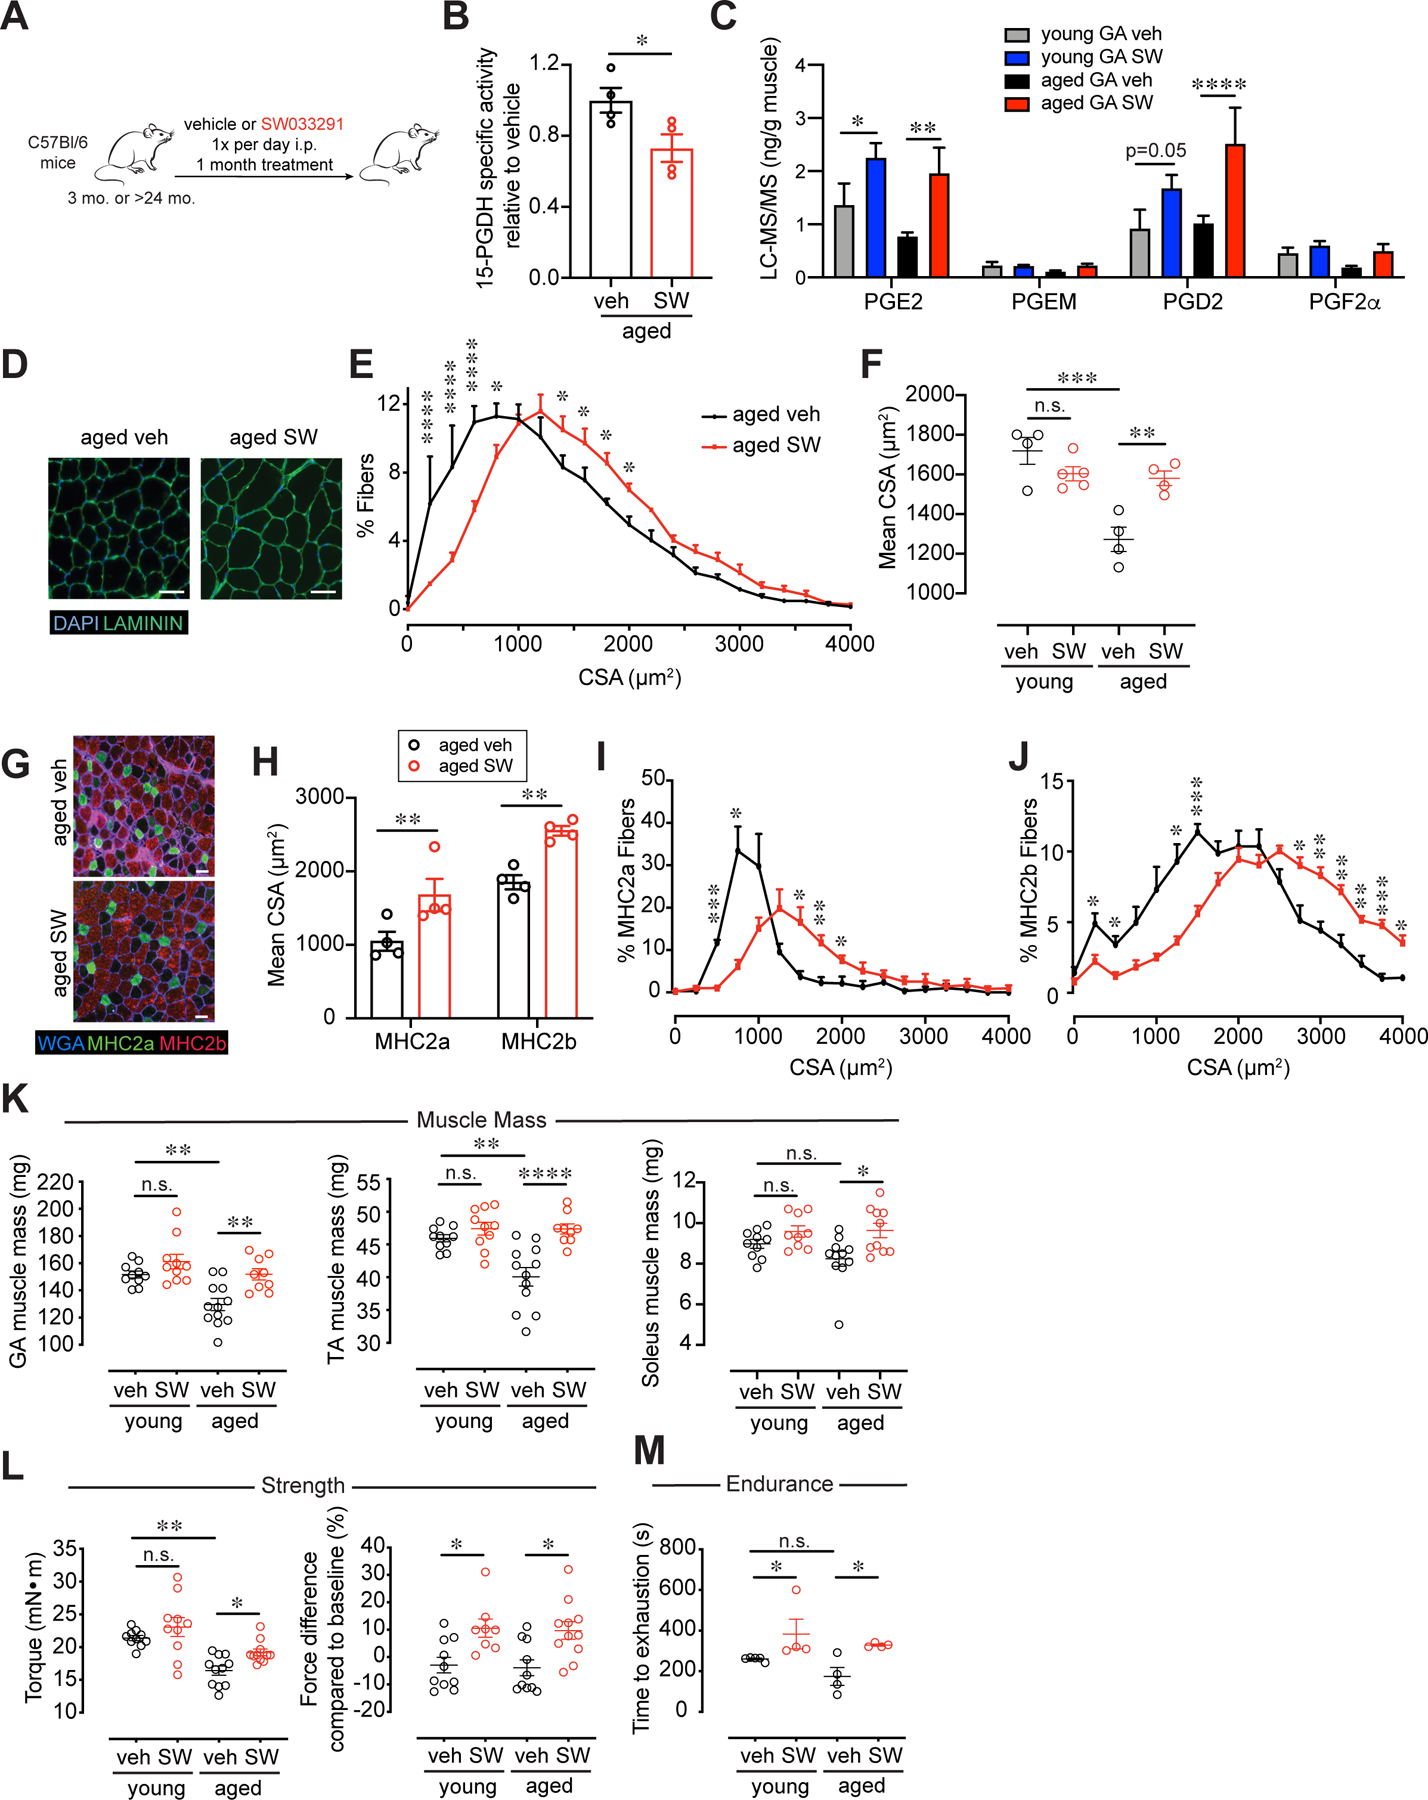
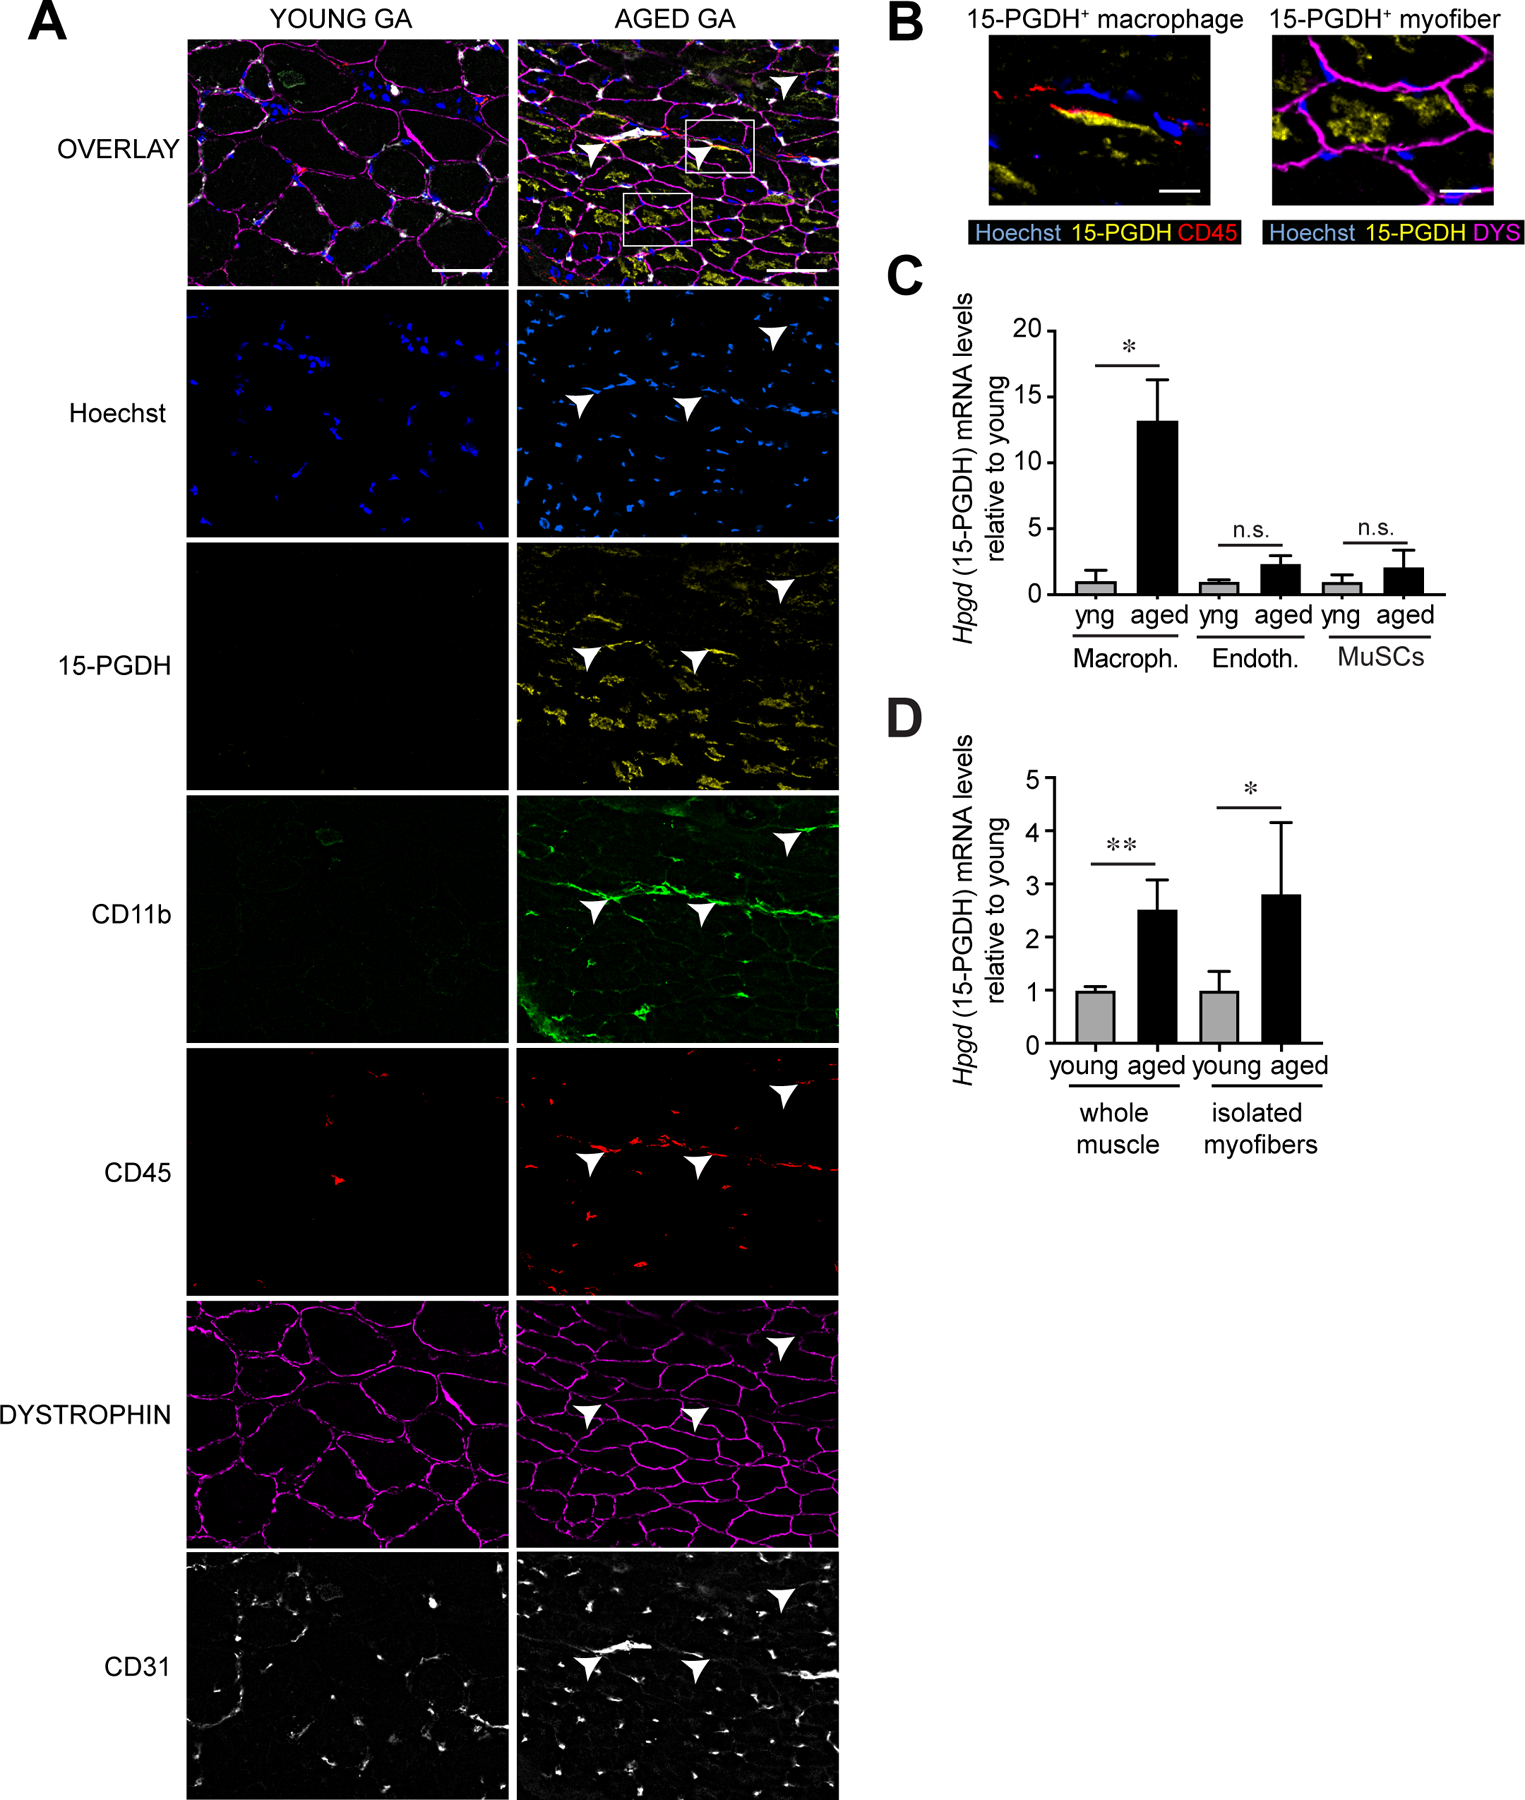
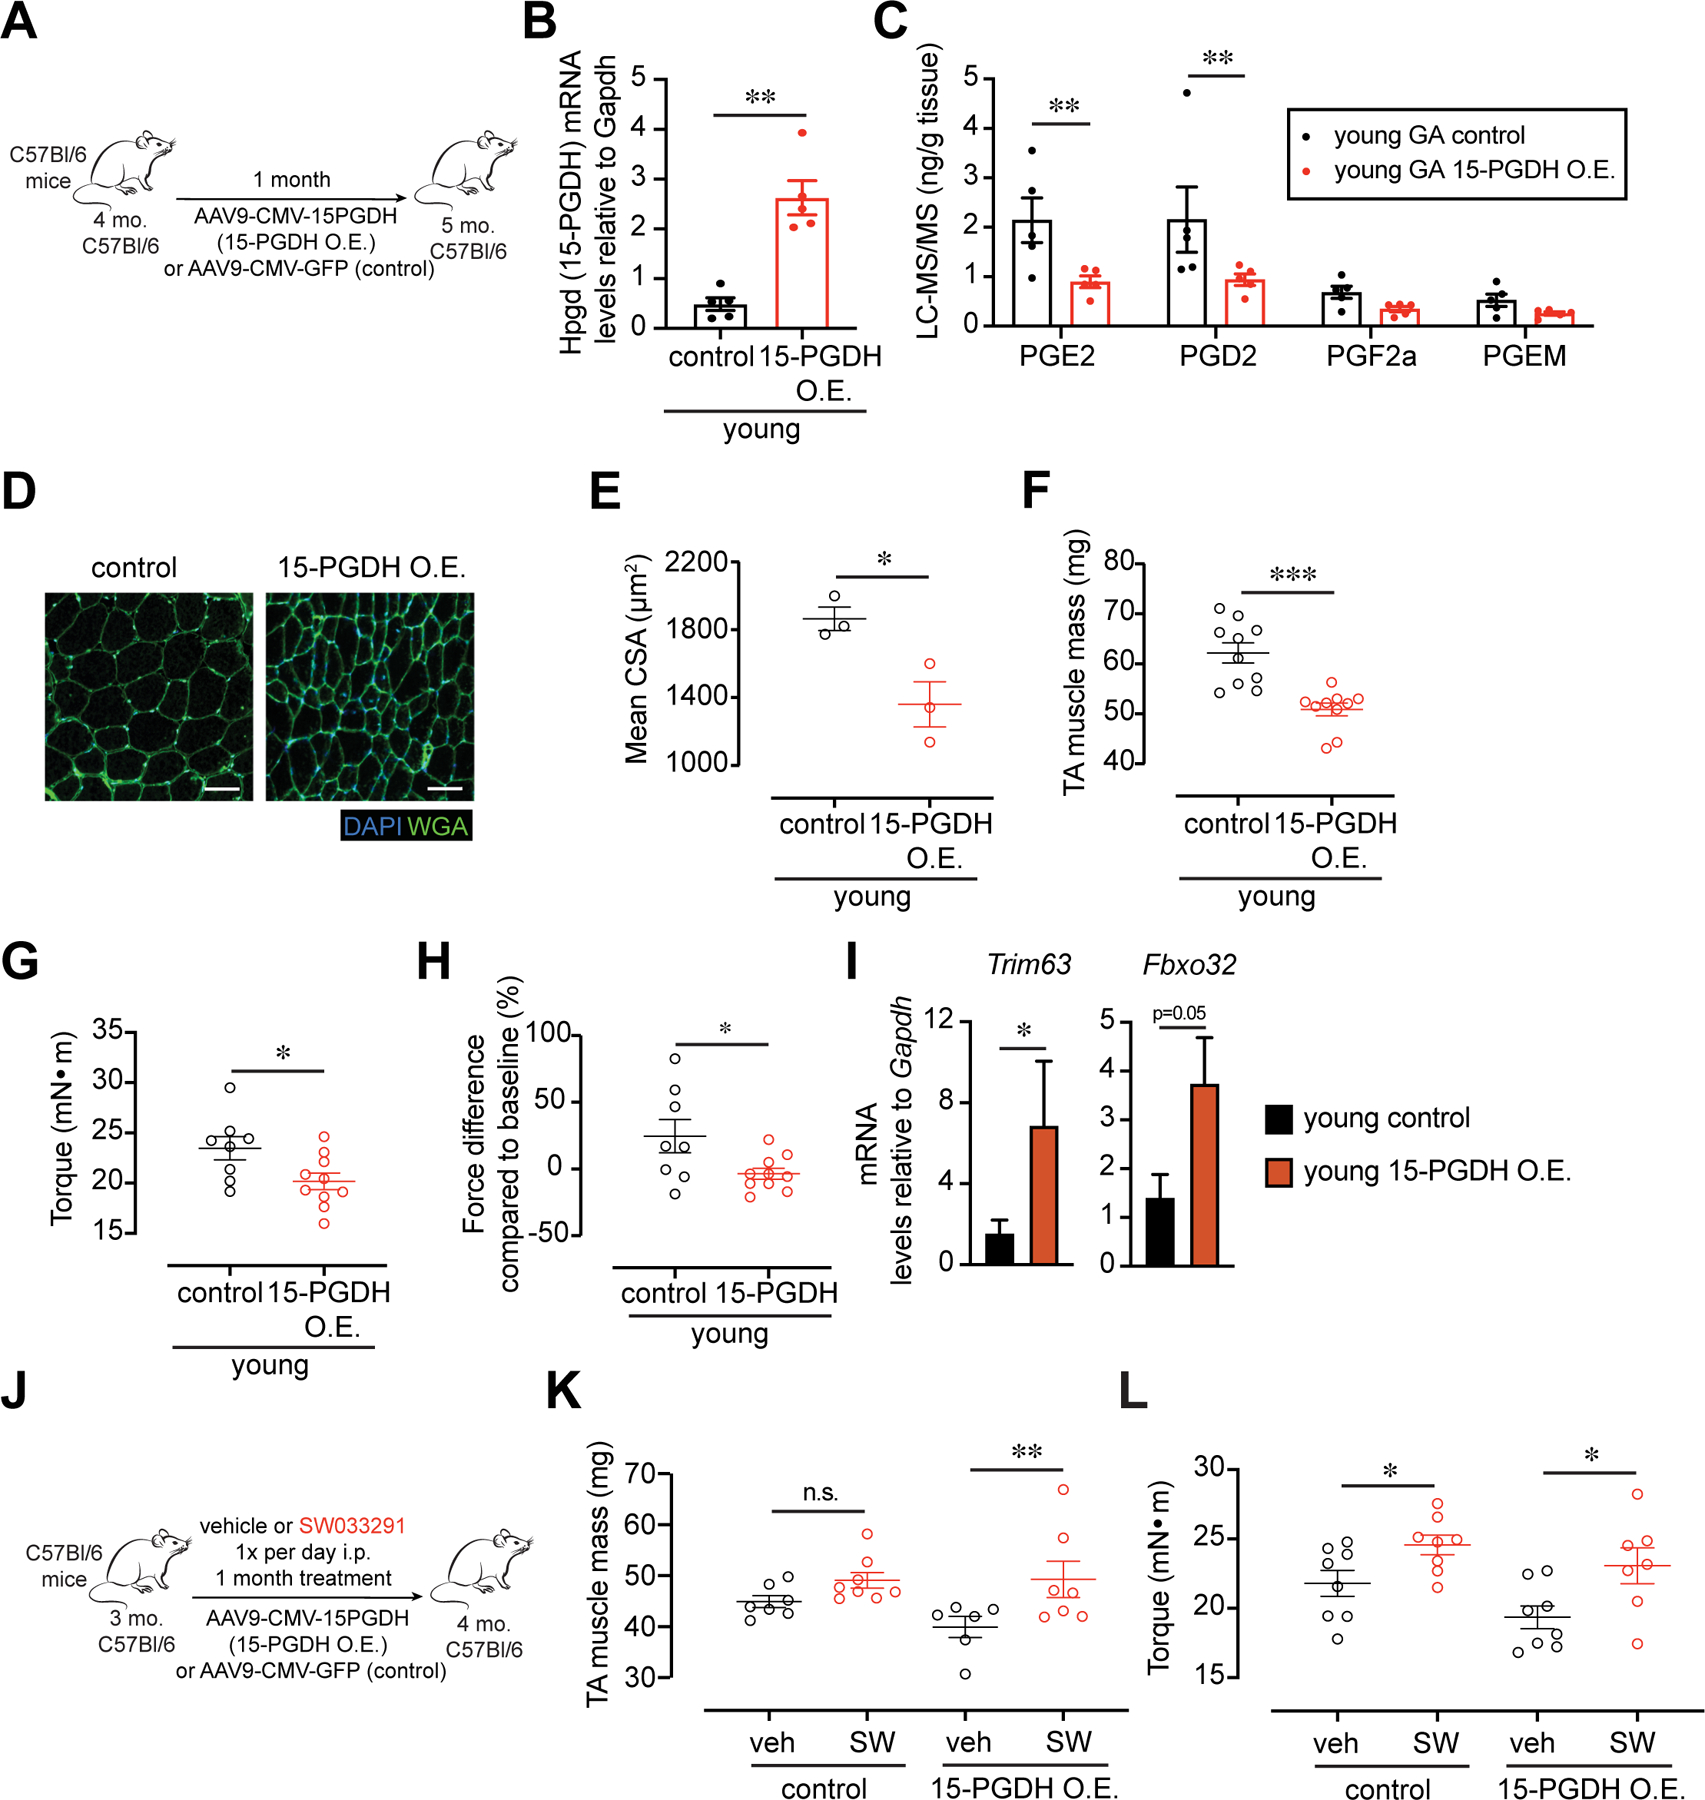
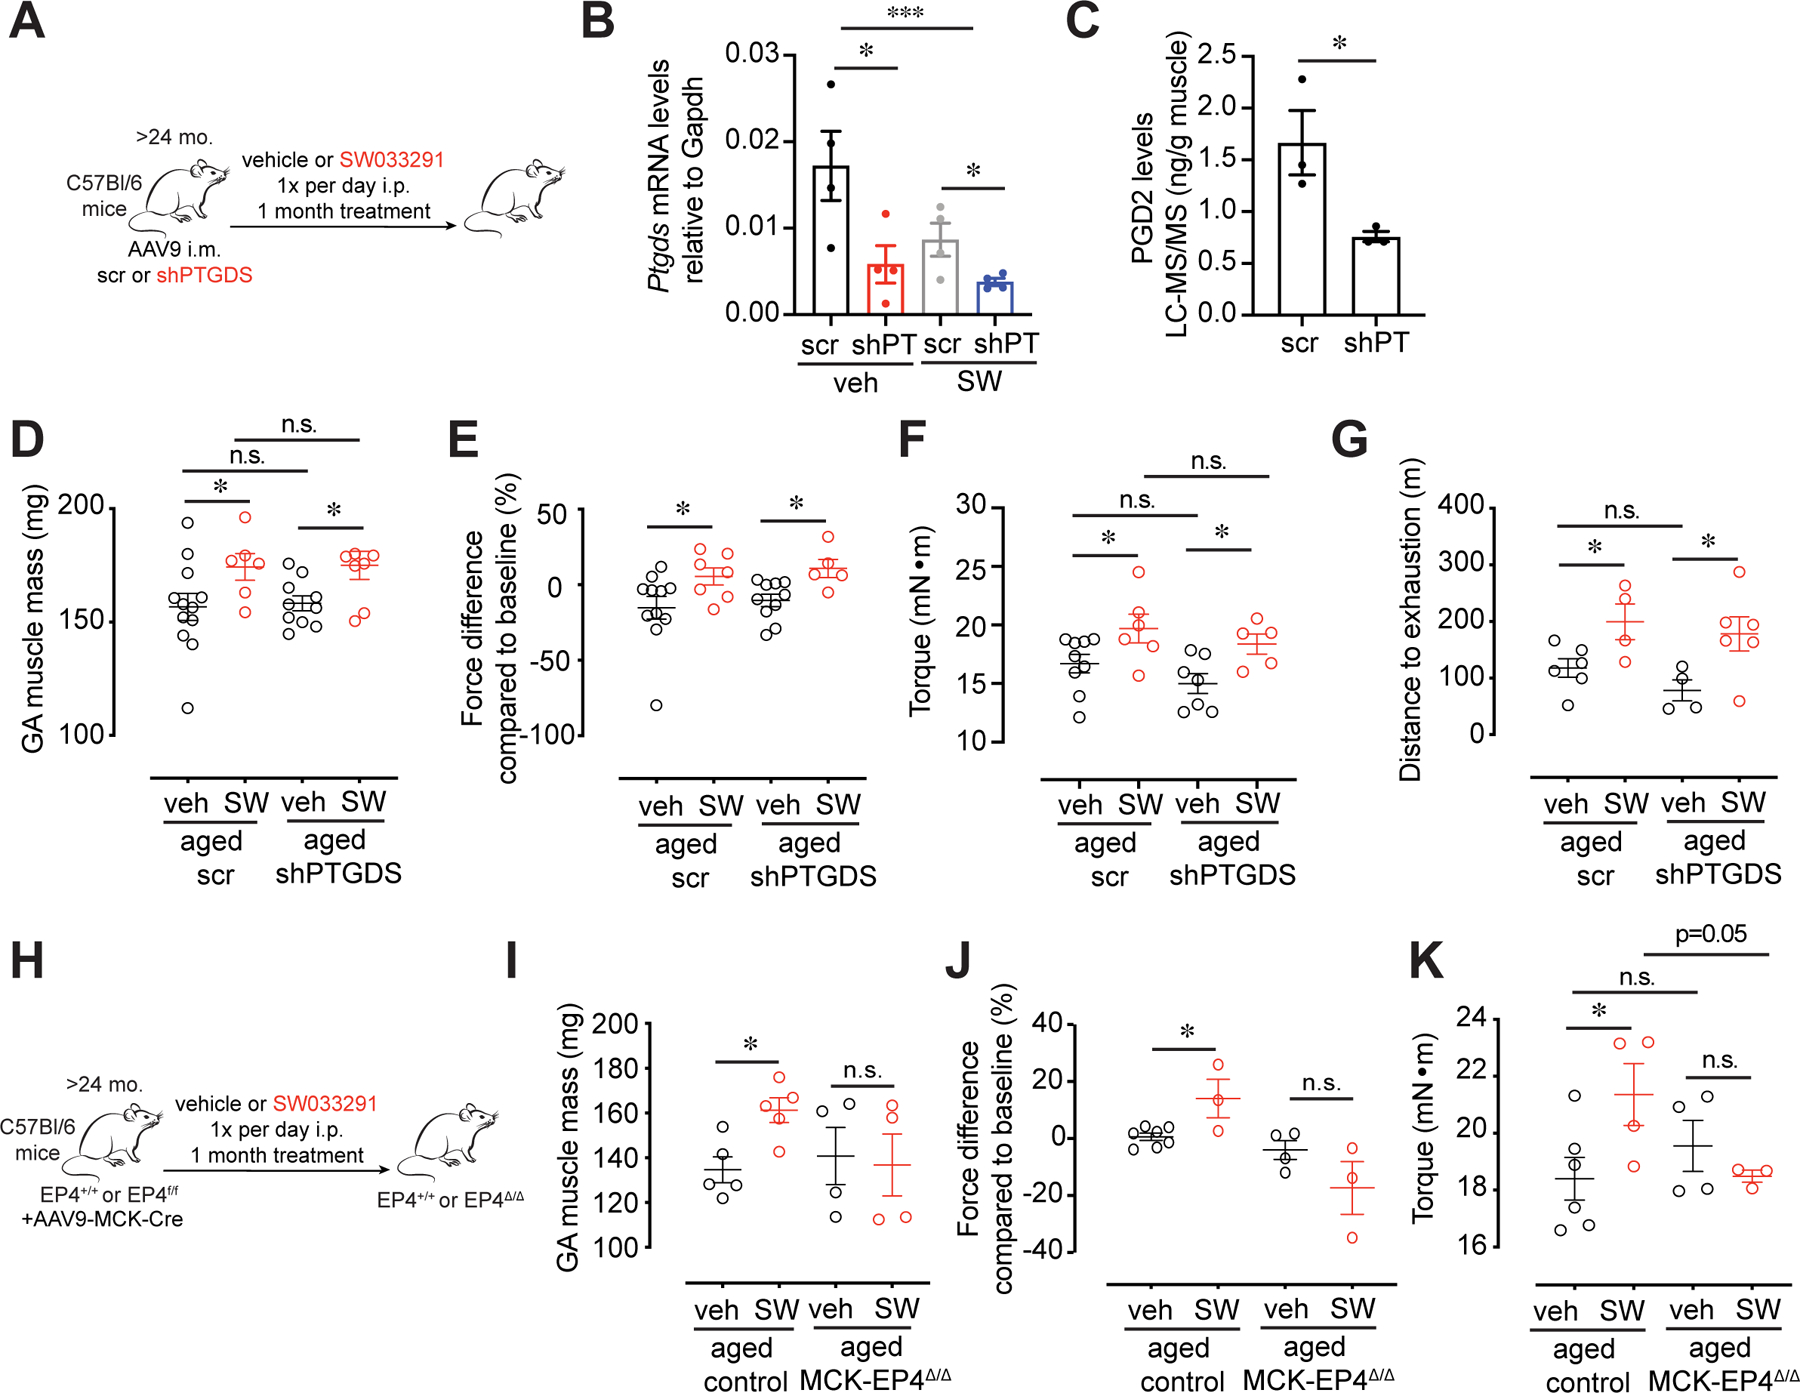
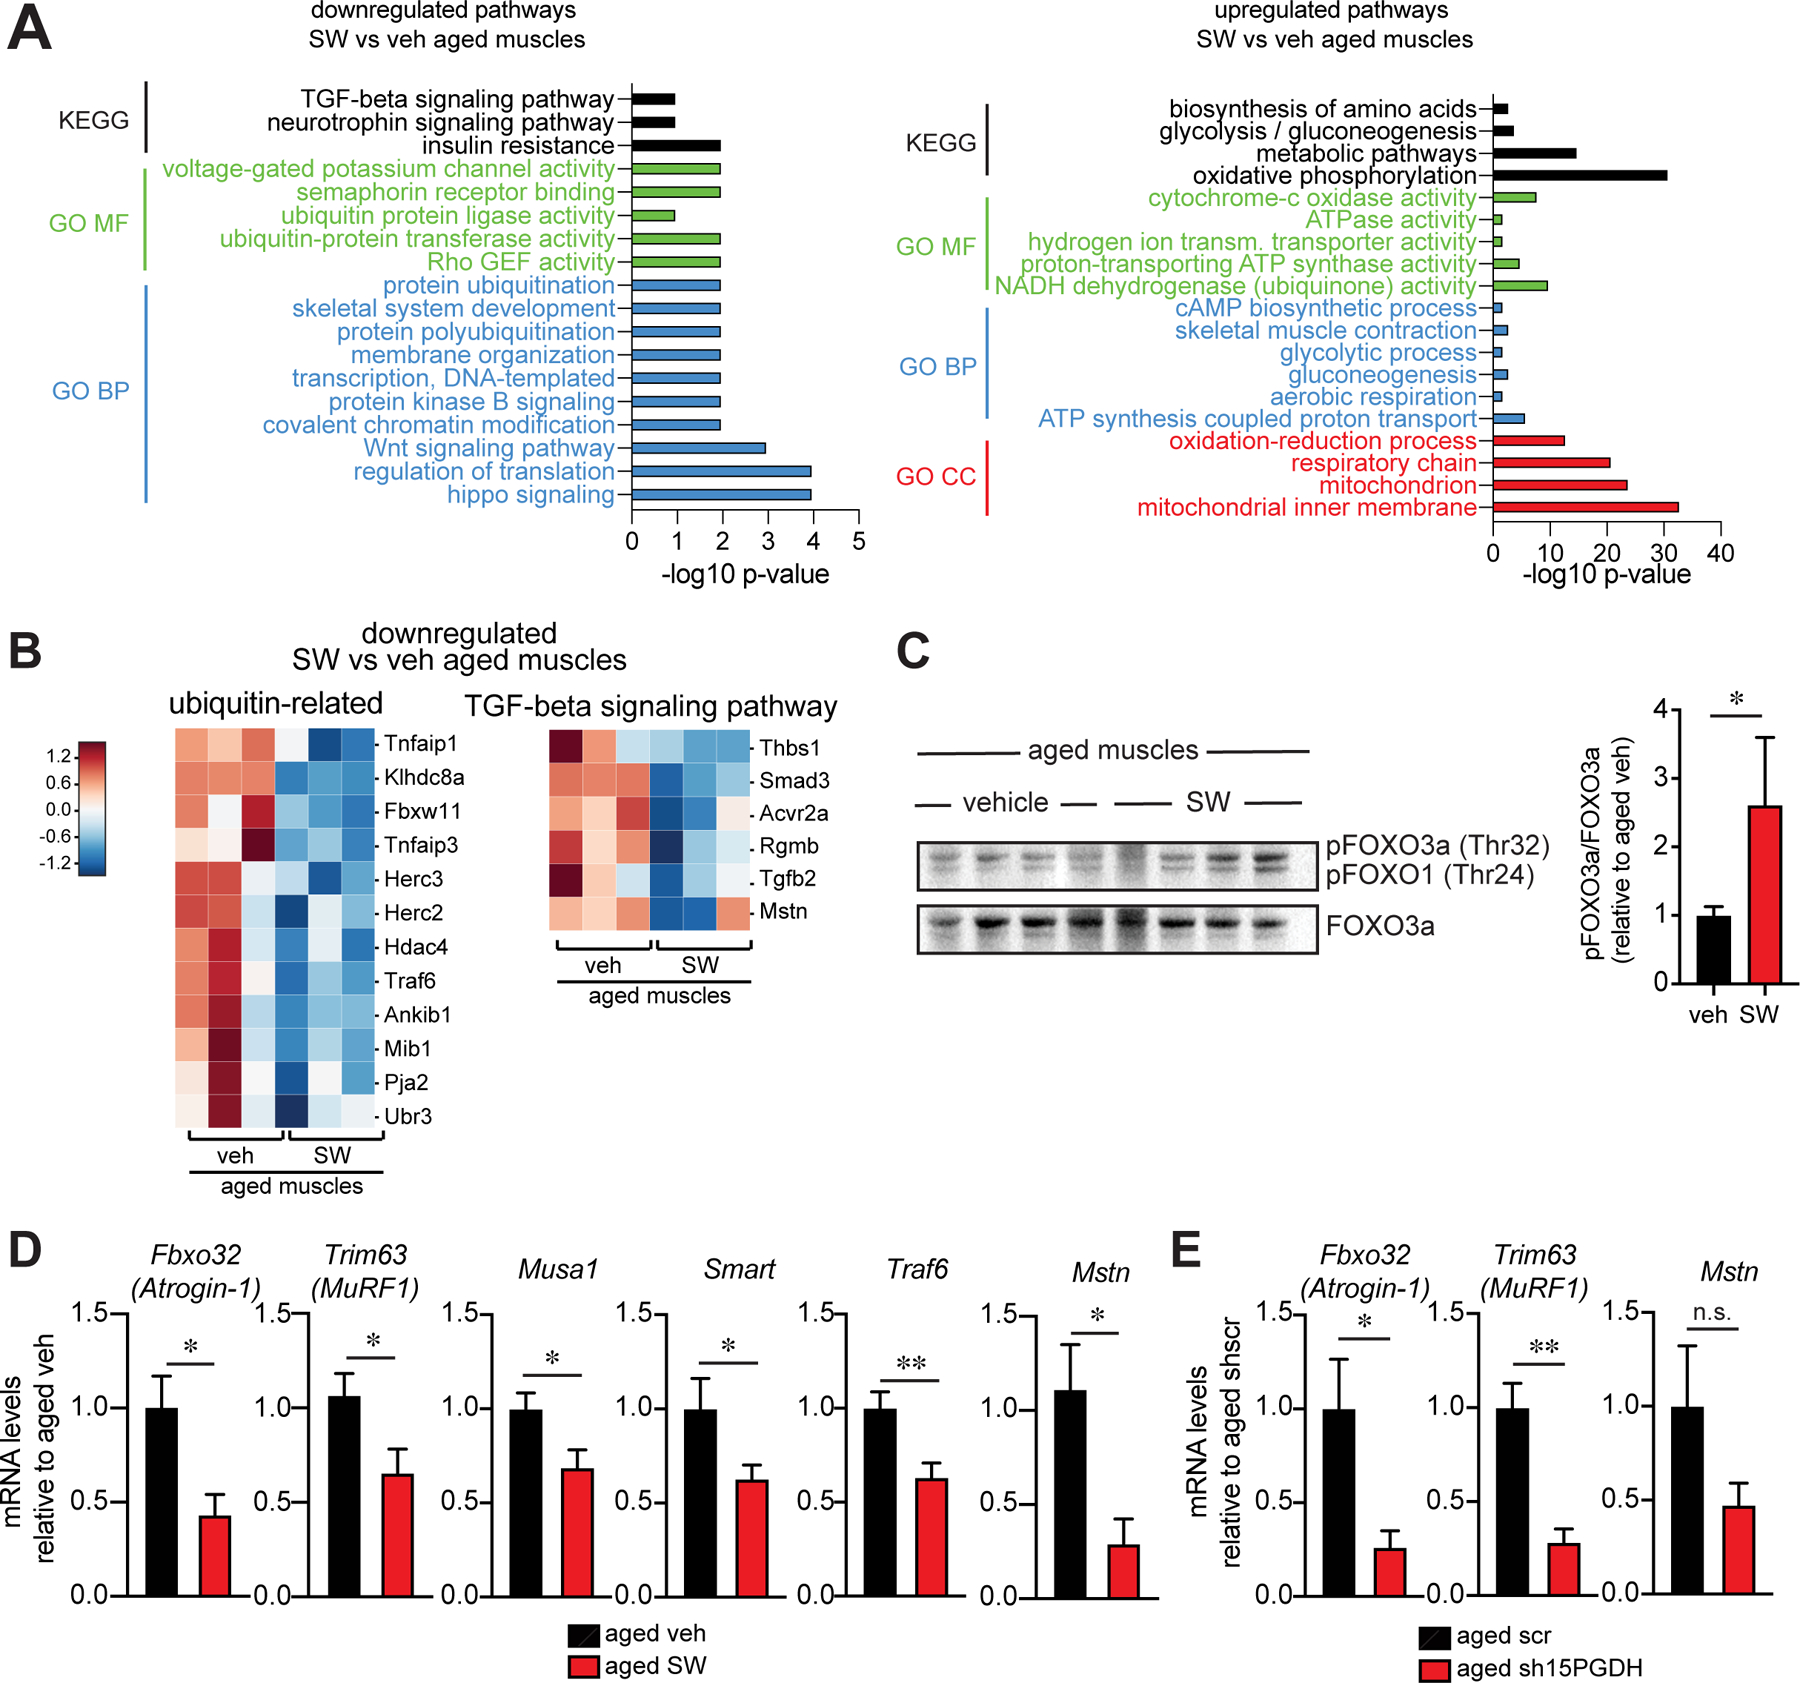
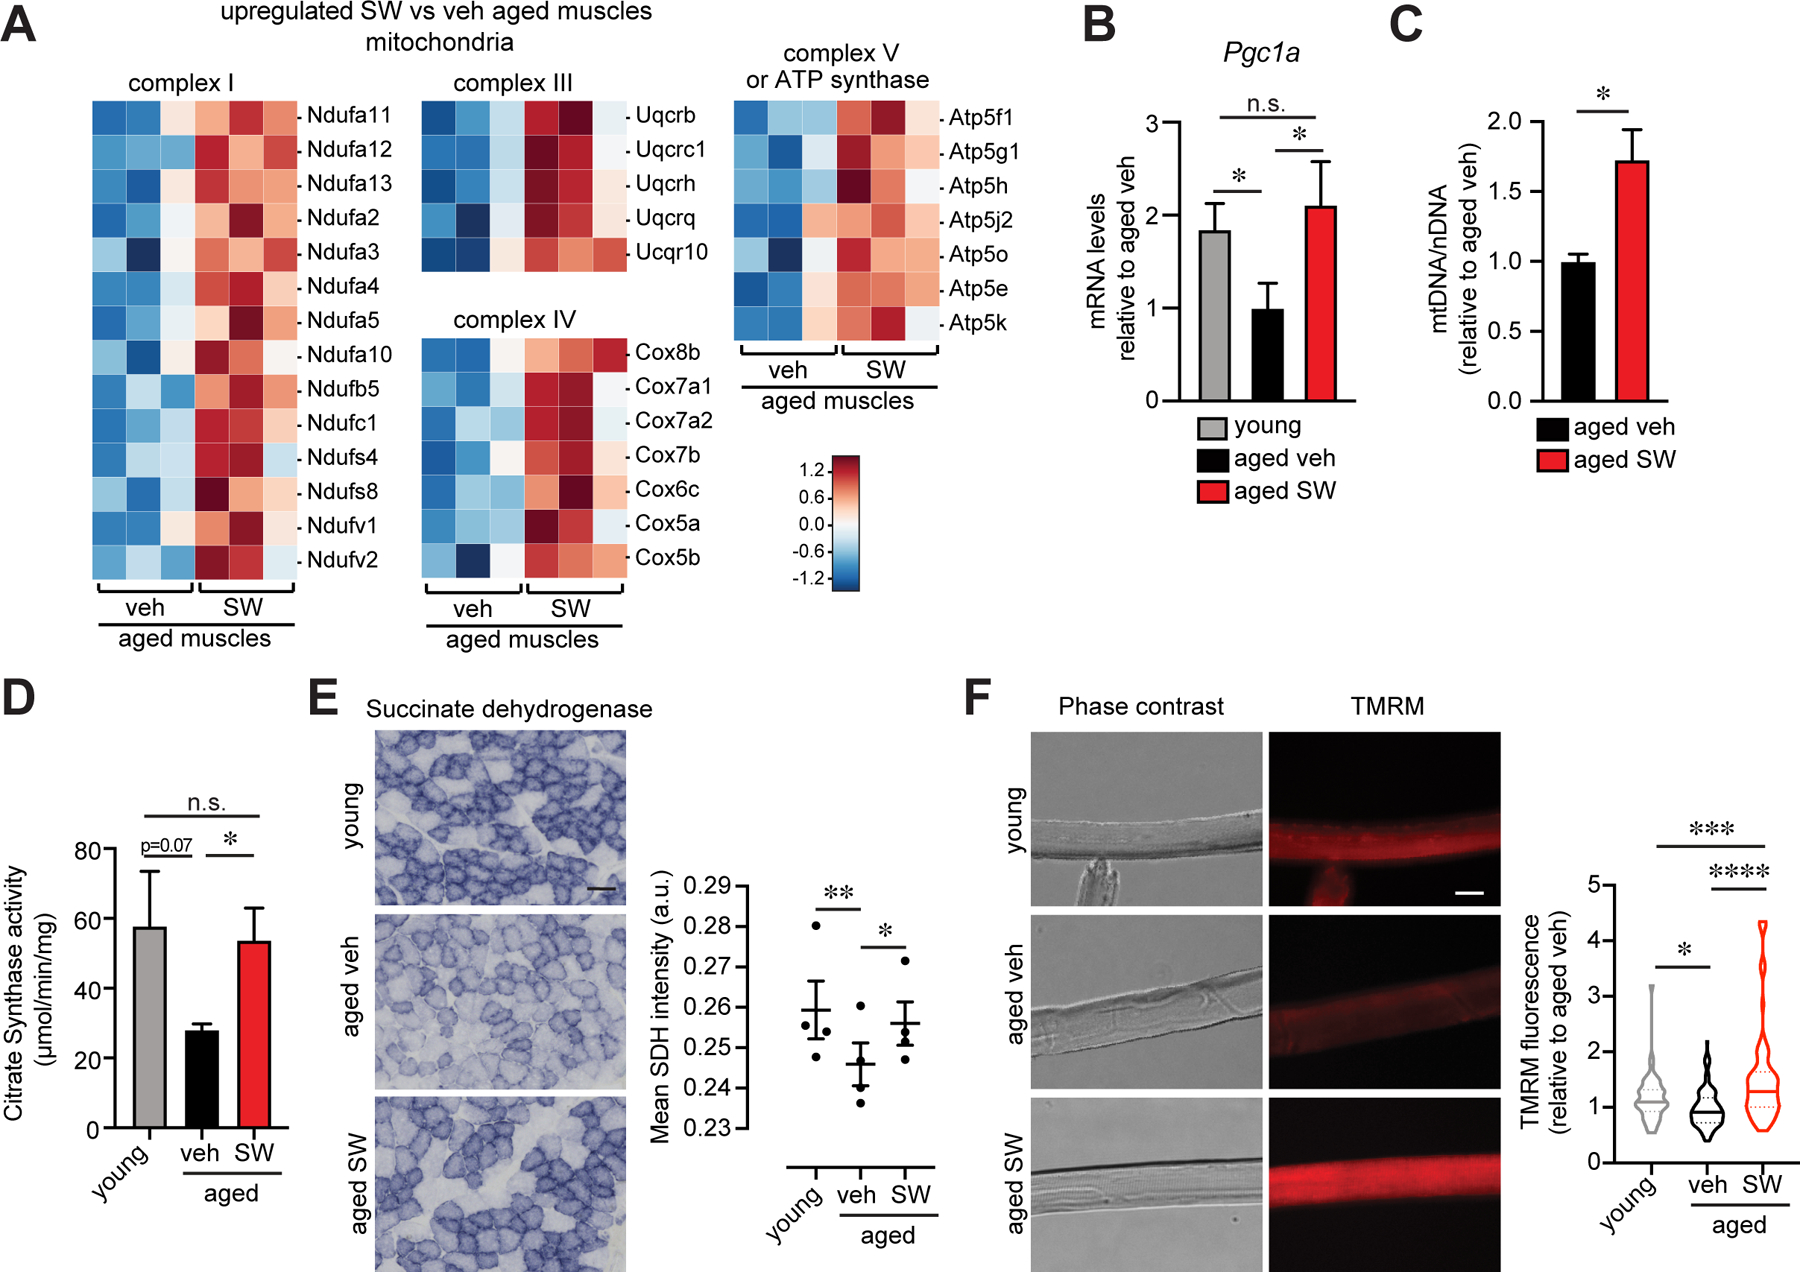
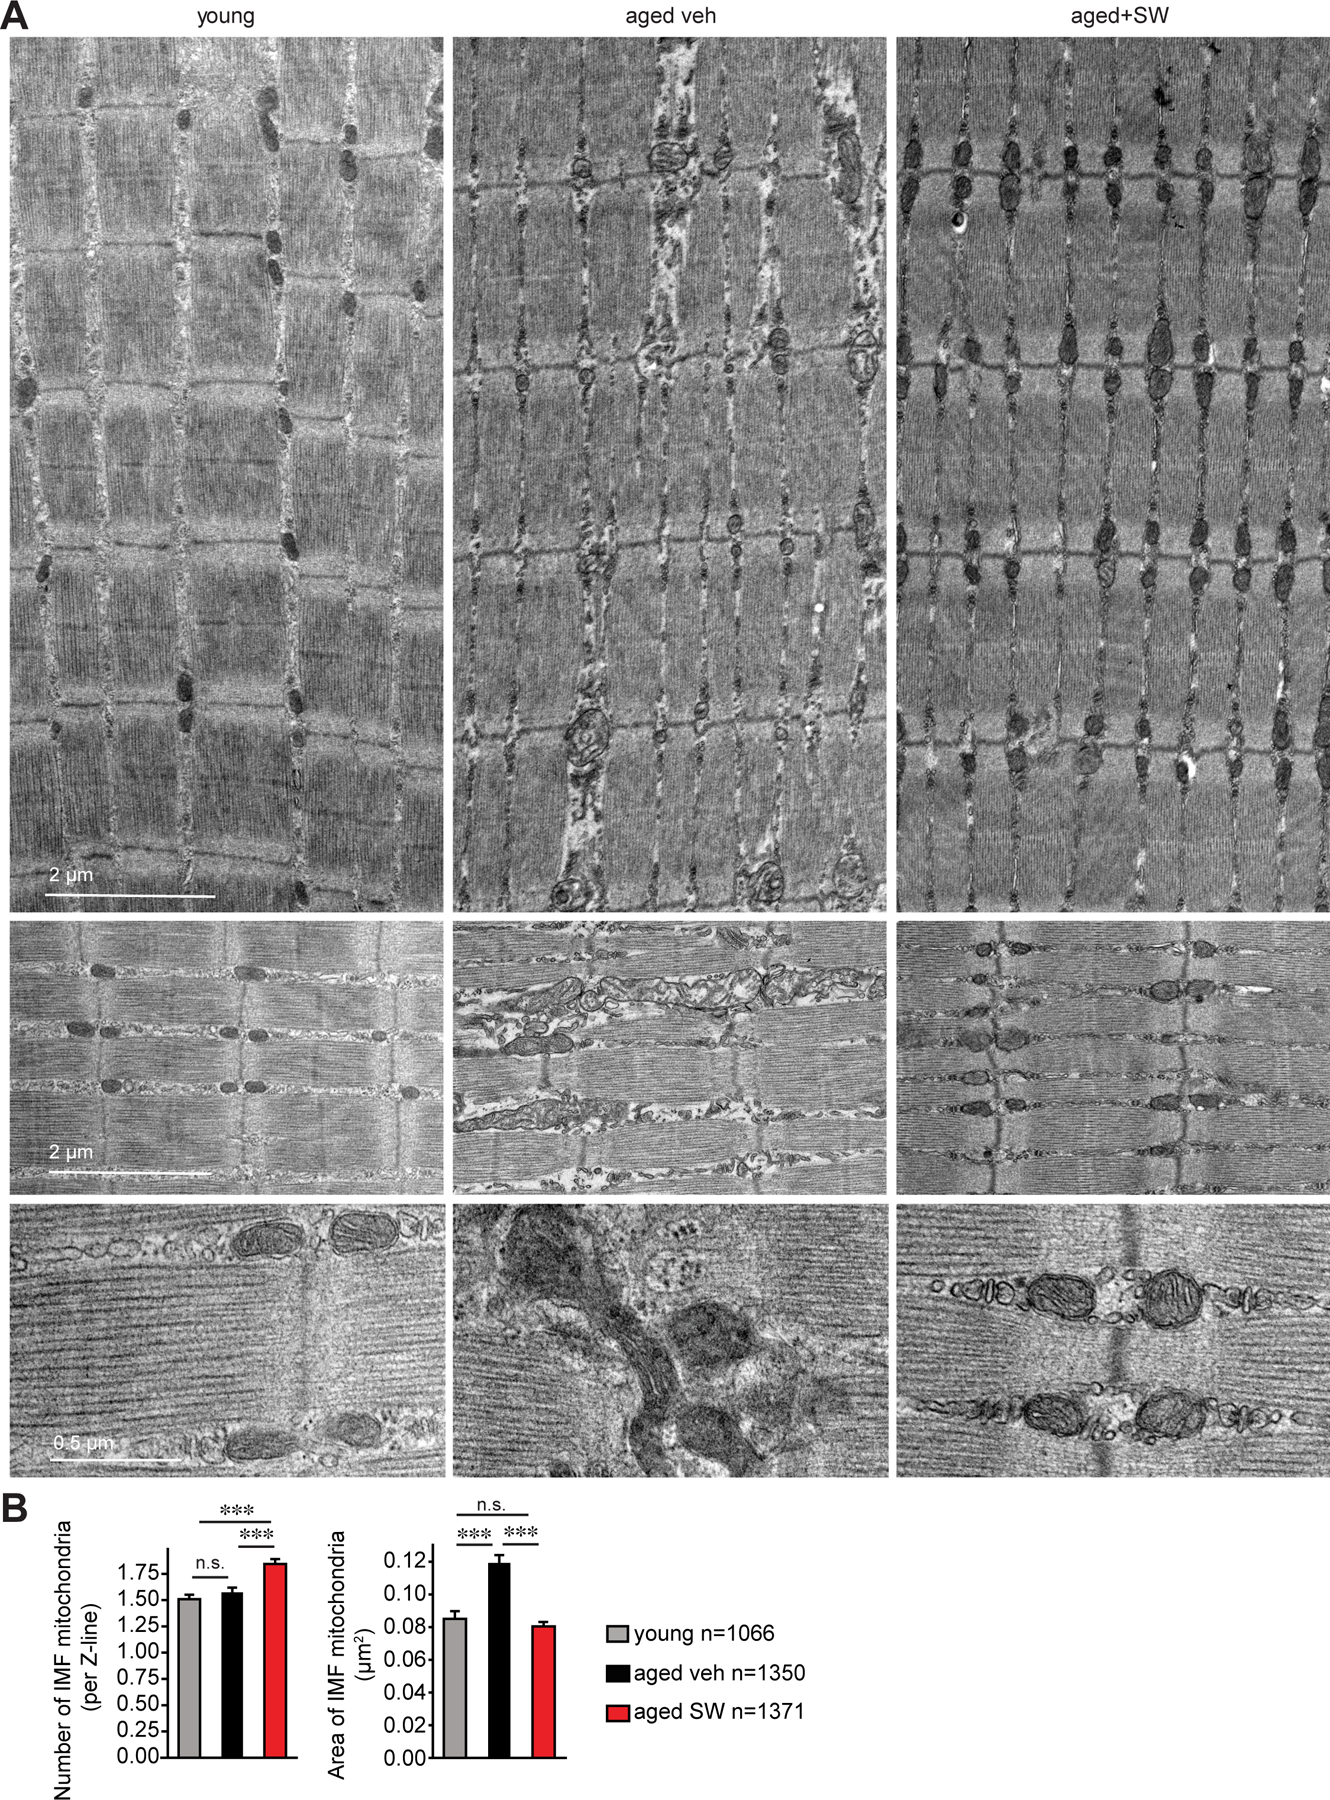
Treatments are lacking for sarcopenia, a debilitating age-related skeletal muscle wasting syndrome. We identifed increased amounts of 15-hydroxyprostaglandin dehydrogenase (15-PGDH), the prostaglandin E2 (PGE2)-degrading enzyme, as a hallmark of aged tissues, including skeletal muscle. The consequent reduction in PGE2 signaling contributed to muscle atrophy in aged mice and results from 15-PGDH-expressing myofibers and interstitial cells, such as macrophages, within muscle. Overexpression of 15-PGDH in young muscles induced atrophy. Inhibition of 15-PGDH, by targeted genetic depletion or a small-molecule inhibitor, increased aged muscle mass, strength, and exercise performance. These benefits arise from a physiological increase in PGE2 concentrations, which augmented mitochondrial function and autophagy and decreased transforming growth factor-β signaling and activity of ubiquitin-proteasome pathways. Thus, PGE2 signaling ameliorates muscle atrophy and rejuvenates muscle function, and 15-PGDH may be a suitable therapeutic target for countering sarcopenia.


Conflict of interest statement

Competing interests: A.R.P., M.R., A.T.V.H. and H.M.B. are named inventors on patent applications regarding 15-PGDH inhibition licensed to Myoforte Therapeutics. Y.X.W., C.A.H. and H.M.B. are named inventors on a patent application for processing of multiplex microscopy images. A.R.P., A.T.V.H. and H.M.B. receive consulting fees and have equity and stock options from Myoforte Therapeutics. H.M.B. is a cofounder of Myoforte Therapeutics. C.M.S. is a scientific advisor to Enable Medicine, LLC.

Figures

Figure 1.
Figure 1.. Elevated activity of PGE2 degrading enzyme, 15-PGDH, is associated with aging, and 15-PGDH knockdown in aged muscle tissues increases strength.
(A) PGE2 and PGD2 catabolism scheme. (B) Prostaglandin levels in Tibialis anterior (TA) muscles quantified by LC-MS/MS (n=14 young, n=8 aged). (C) Representative chromatogram of the PGE2 and PGD2 levels analyzed by LC-MS/MS in young (left) and aged (right) TA muscles. (D) 15-PGDH specific enzymatic activity assayed in tissues of young and aged mice. Activity is expressed as percent change relative to young. (n=4–5 young, n=3–5 aged). (E) 15-PGDH (Hpgd) RNAseq expression data from young (n=4) and aged (n=5) mouse muscles. TPM, transcripts per million. (F) 15-PGDH immunoblots from young and aged muscle lysates (n=4 each). (G-Q) Intramuscular (i.m.) injection of AAV9 carrying a construct of an shRNA against 15-PGDH (sh15PGDH) or scramble (scr) control into the TA and Gastrocnemius (GA) of young and aged mice. (G) Experimental scheme. (H) Expression levels of 15-PGDH in scr and sh15PGDH infected muscles and young control (n=5 young, n=4 aged scr, n=5 aged sh15PGDH). (I) 15-PGDH specific enzymatic activity assayed in muscle tissues of sh15PGDH infected aged muscles normalized to scr (n=6 aged scr, n=5 aged sh15PGDH). (J) Prostaglandin levels in GA muscles quantified by LC-MS/MS (n=5 young scr, n=4 young sh15PGDH, n=3 aged scr, n=4 aged sh15PGDH). (K) Representative GA cross-section of scr and sh15PGDH infected aged muscles. DAPI, blue; LAMININ, green. Bar=50 µm. (L) Myofiber cross-sectional areas (CSA) in scr and sh15PGDH infected aged GAs (n=7 aged scr, n=8 aged sh15PGDH). (M) Mean CSA (n=4 young scr, n=3 young sh15PGDH, n=7 aged scr, n=8 aged sh15PGDH). (N) Mass of dissected TA. (O) Mass of dissected GA. (P) Plantar flexion tetanic force (absolute values). (Q) Plantar flexion tetanic force (relative to baseline). (N-Q): n=8–10 young scr, n=8–9 young sh15PGDH, n=12–14 aged scr, n=14 aged sh15PGDH. *P<0.05, **P<0.01, ****P<0.0001. ANOVA test with Bonferroni correction (N-Q) or Fisher’s LSD (B,H,J,L,M) for multiple comparisons; unpaired t-tests (D-F,I). Means±s.e.m. Abbreviations: PGEM, 13,14-dihydro-15-keto-PGE2; Spl. Spleen; Mus. Muscle; mo. months; i.m. intramuscular. C57Bl/6 young (2–4 mo.) and aged (>24 mo.) mice were used.
FIG. 2.
FIG. 2.. Increase in muscle mass and strength is induced in aged muscles by small molecule inhibition of 15-PGDH.
(A) Experimental scheme. Young and aged mice were treated daily with 15-PGDH inhibitor, SW033291 (SW) or vehicle for 1 mo. (B) 15-PGDH specific enzymatic activity assayed in muscle tissues of SW treated aged muscles normalized to vehicle treated (n=4 mice per age group). (C) Prostaglandin levels in Gastrocnemius (GA) muscles quantified by LC-MS/MS (n=8 young veh, n=9 young SW, n=8 aged veh, n=6 aged SW). Muscles were analyzed 3 hours post vehicle or SW injection. (D) Representative Tibialis anterior (TA) cross-section of 1 mo. treated vehicle or SW treated aged muscles. DAPI, blue; LAMININ, green. Bar=50 µm. (E) Myofiber cross-sectional areas (CSA) in vehicle and SW treated aged TA (n=4 per group). (F) Mean CSA (n=5 young veh, n=4 young SW, n=4 aged veh, n=4 aged SW). (G) Representative TA cross-section of 1 mo. vehicle or SW treated aged muscles stained for oxidative (MHC2a) and glycolytic fibers (MHC2b). WGA, blue; MHC2a, green; MHC2b, red. Bar=50 µm. (H) Mean CSA. n=4 per group (I) Cross-sectional area of MHC2a. n=4 per group (J) Cross-sectional area of MHC2b. n=4 per group (K) Weight of dissected GA, TA and Soleus muscles. (L) Plantar flexion tetanic force (absolute values) and plantar flexion tetanic force (relative to baseline). (K-L): n=10 young veh, n=8–10 young SW, n=8–12 aged veh, n=7–11 aged SW. (M) Time to exhaustion (n=5 young veh, n=4 young SW, n=4 aged veh, n=4 aged SW). *P<0.05, **P<0.01, ****P<0.0001. Unpaired t-test (B,H); ANOVA test with Bonferroni correction (F,K,L) or Fisher’s LSD (C,E,I,J,M) for multiple comparisons. Means±s.e.m. Abbreviation: veh., vehicle, PGEM, 13,14-dihydro-15-keto-PGE2; mo. months; i.p. intraperitoneal. C57Bl/6 young (2–4 mo.) and aged (>24 mo.) mice were used.
FIG. 3.
FIG. 3.. Myofibers and interstitial macrophages comprise cellular sources of 15-PGDH in the aged muscle microenvironment.
(A) Multiplexed immunofluorescence co-detection of 15-PGDH (yellow) in major cell types in tissue sections of GA muscles from young and aged. CD45 (red) stains all immune cells; CD11b (green) stains myeloid cells including macrophages; DYSTROPHIN (magenta) stains the sarcolemma of myofibers; CD31 (PECAM; grays) stains capillary and vascular endothelial cells. n=4 per group; tissues were imaged in a 5×7 grid with 26 z-slices for each stain; best focused Z-slice shown. Arrows indicate 15-PGDH+ macrophages. Bar=50 µm. (B) Magnified regions from (A) of co-localized 15-PGDH staining in CD45+CD11b+ macrophages (left) and dystrophin+ myofibers (right) in aged GA muscles. Bar=10 µm. (C) Expression of 15-PGDH (Hpgd) in sorted macrophages (CD11b+/CD11c/F4/80+/CD31) (n=3 young, n=8 aged), endothelial (CD31+/CD11b/CD11c/F4/80) (n=3 young, n=5 aged) and muscle stem cells (MuSCs) (α7+/CD11b/CD45/CD31/Sca1) (n=5 young, n=5 aged) from young and aged hindlimb muscles. (D) Expression of 15-PGDH (Hpgd) in whole EDL muscle lysate and collagenase dissociated single isolated myofibers (n=6 young whole muscle, n=6 aged whole muscle, n=4 young isolated myofibers, n=3 aged isolated myofibers). *P<0.05, **P<0.01. Unpaired t-tests (C,D). Means±s.e.m. Abbreviation: yng, young. C57Bl/6 young (2–4 mo.) and aged (>24 mo.) mice were used.
FIG. 4.
FIG. 4.. Muscle atrophy and weakness are induced in young mice by overexpression of 15-PGDH.
(A-H) Intramuscular (i.m.) injection of AAV9 carrying a construct of CMV driving 15-PGDH expression or control into the Tibialis anterior (TA) or Gastrocnemius (GA) of young mice. (A) Experimental scheme. (B) Expression of 15-PGDH (Hpgd) in control and 15-PGDH O.E. infected young muscles (n=5 per group). (C) Prostaglandin levels in GA muscles quantified by LC-MS/MS (n=5 per group). (D) Representative TA cross-section 1-mo. post i.m. injection. DAPI, blue; WGA, green. Bar=50 µm. (E) Myofiber cross sectional area of muscles injected with 15-PGDH overexpression vector and control (n=3 per group). (F) Mass of dissected Tibialis anterior (TA) muscles. (n=10 per group) (G) Plantar flexion tetanic force (absolute values) (n=8 control, n=10 15-PGDH O.E.). (H) Plantar flexion tetanic force (relative values) (n=7 control, n=9 15-PGDH O.E.). (I) Expression level of MuRF1 (Trim63), Atrogin-1 (Fbxo32) measured by qPCR (n=5 per group). (J-L) I.m. injection of AAV9 carrying a construct of CMV driving 15-PGDH expression or control into the TA of young mice together with daily intraperitoneal (i.p.) treatment with 15-PGDH inhibitor, SW033291 (SW) or vehicle. (J) Experimental scheme. (K) Mass of dissected TA muscles. (L) Plantar flexion tetanic force (absolute values). (J-L): n=7–8 control veh, n=8 control SW, n=6–8 15-PGDH O.E. veh, n=7 15-PGDH O.E. SW. *P<0.05, **P<0.01, ***P<0.001 ****P<0.0001. Unpaired t-tests (B,C,E-I), ANOVA with Fisher’s LSD (K,L) for multiple comparisons. Means±s.e.m. Abbreviation: PGEM, 13,14-dihydro-15-keto-PGE2. C57Bl/6 young (2–4 mo.) mice were used.
FIG. 5.
FIG. 5.. Beneficial effects of 15-PGDH inhibition on muscle strength are specific to PGE2 and the EP4 receptor on myofibers.
(A-G) Intramuscular (i.m.) injection of AAV9 carrying a construct of an shRNA against Prostaglandin D2 Synthase, PTGDS (shPTGDS) or scramble (scr) control into the Gastrocnemius (GA) of aged mice. (A) Experimental scheme. (B) Expression of Ptgds measured by qPCR (n= 4 per group). (C) PGD2 level in GA muscle tissues quantified by LC-MS/MS (n=3 per group). (D) Mass of dissected GA. (E) Plantar flexion tetanic force (values normalized to baseline) (F) Plantar flexion tetanic force (absolute values). (D-F): n=9–12 scr veh, n=6–7 scr SW, n=7–10 shPTGDS veh, n=5–8 shPTGDS SW. (G) Distance to exhaustion on treadmill (n=6 scr veh, n=4 scr SW n=4 shPTGDS veh, n=6 shPTGDS SW). (H-K) I.m. injection of AAV9 carrying a construct of MCK promoter driving Cre expression into the GA of EP4f/f mice or littermate controls (EP4+/+, control). Mice were then treated daily with 15-PGDH inhibitor, SW033291 (SW) or vehicle and muscle function was measured at 1 mo. (H) Experimental scheme. (I) Mass of dissected GA. (J) Plantar flexion tetanic force (values normalized to baseline). (K) Plantar flexion tetanic force (absolute values). (I-K): n=5–7 control veh, n=3–5 control SW, n=4 EP4 KO veh, n=3–4 EP4 KO SW. *P<0.05, **P<0.01, ***P<0.001 ****P<0.0001. ANOVA with Fisher’s LSD (B,D-K) for multiple comparisons; Unpaired t-test (C). Means±s.e.m. Abbreviation: mo. months; i.p. intraperitoneal; i.m. intramuscular; shPT, shPTGDS. C57Bl/6 aged (>24 mo.) mice were used.
FIG. 6.
FIG. 6.. 15-PGDH inhibition alters multiple pathways to improve aged muscle function.
(A-B) RNA sequencing analysis of muscles from aged muscle mice that were treated daily with 15-PGDH inhibitor, SW033291 (SW) or vehicle for 1 mo. (n=3 each). (A) KEGG and GO Term analysis of downregulated (left) and upregulated (right) genes. (B) Heatmap of protein ubiquitin related genes (left) and TGF-beta signaling pathway (right) identified in (A). (C) Immunoblots of muscle lysates from aged vehicle and SW treated mice (left) and quantification (right) (n=3 aged veh, n=4 aged SW). (D) Expression level of MuRF1 (Trim63), Atrogin-1 (Fbxo32) and Myostatin (Mstn) (n=15 aged veh, n=8 aged SW) and Musa, Smart and Traf6 (n=7 aged veh, n=6 aged SW). (E) Expression level of MuRF1 (Trim63), Atrogin-1 (Fbxo32) and Myostatin (Mstn) measured by qPCR (n=5 aged scr, n=4 aged sh15PGDH). *P<0.05, **P<0.01. Unpaired t-test (C-E). Means±s.e.m. Abbreviation: KEGG: Kyoto Encyclopedia of Genes and Genomes; GO: Gene Ontology; BP: Biological Process; MF: Molecular Function; CC: Cellular Component. C57Bl/6 aged (>24 mo.) mice were used.
FIG. 7.
FIG. 7.. 15-PGDH inhibition boosts mitochondrial biogenesis and function in aged muscles.
(A) Heatmap of mitochondrial genes identified in (6A). (B) Expression level of Pgc1a by qPCR (n=4 young, n=4 aged veh, n=3 aged SW033291 (SW)). (C) Relative quantification of mitochondrial DNA to nuclear DNA (n=4 per group). (D) Citrate synthase activity of Gastrocnemius muscles (n=3 young, n=4 aged veh, n=4 aged SW). (E) Representative Tibilais anterior (TA) cross-section stained for succinate dehydrogenase (SDH) (left). Quantification of SDH mean average intensity per fiber (n=4 mice per condition). Bar=50 µm. (F) Representative images of mitochondrial membrane potential (TMRM staining) in isolated Extensor digitorum longus (EDL) myofibers from young and aged vehicle and SW treated mice (n=4 mice per condition; total number of myofibers: n=52 young, n=139 aged veh, n=89 aged SW). Bar=10 µm. *P<0.05, **P<0.01, ***P<0.001 ****P<0.0001. ANOVA with Fisher’s LSD for multiple comparisons (B,D-F); Unpaired t-test (C). Means±s.e.m. C57Bl/6 young (2–4 mo.) and aged (>24 mo.) mice were used.
FIG. 8.
FIG. 8.. 15-PGDH inhibition in aged mice increases mitochondrial number and improves mitochondrial morphology.
(A) Representative images of intermyofibrillar (IMF) mitochondria from transmission electron micrographs (TEM) of longitudinal sections of Extensor digitorum longus (EDL) muscles of young and aged vehicle and SW treated mice. (B) Quantifications of IMF mitochondria number and size from TEM images as in (A). (n=3 mice per condition; total mitochondria quantified: n=1,066 young, n=1,350 aged vehicle, n=1,371 aged SW). ***P<0.001. ANOVA test with Tukey’s test (B). Means±s.e.m. C57Bl/6 young (2–4 mo.) and aged (>24 mo.) mice were used.

Comment in

  • Targeting enzyme aging.
    Becker F, Rudolph KL. Becker F, et al. Science. 2021 Jan 29;371(6528):462-463. doi: 10.1126/science.abf9566. Science. 2021. PMID: 33510013 No abstract available.

References

    1. Cohen S, Nathan JA, Goldberg AL, Muscle wasting in disease: molecular mechanisms and promising therapies. Nat Rev Drug Discov 14, 58–74 (2015). - PubMed
    1. Rolland Y et al., Sarcopenia: its assessment, etiology, pathogenesis, consequences and future perspectives. J Nutr Health Aging 12, 433–450 (2008). - PMC - PubMed
    1. von Haehling S, Morley JE, Anker SD, An overview of sarcopenia: facts and numbers on prevalence and clinical impact. J Cachexia Sarcopenia Muscle 1, 129–133 (2010). - PMC - PubMed
    1. Larsson L et al., Sarcopenia: Aging-Related Loss of Muscle Mass and Function. Physiol Rev 99, 427–511 (2019). - PMC - PubMed
    1. Lee CE, McArdle A, Griffiths RD, The role of hormones, cytokines and heat shock proteins during age-related muscle loss. Clin Nutr 26, 524–534 (2007). - PubMed

Publication types

MeSH terms

Substances