. 2020 Dec 10;11(1):6335.
doi: 10.1038/s41467-020-20138-8.

Inhibition of RANK signaling in breast cancer induces an anti-tumor immune response orchestrated by CD8+ T cells

Affiliations

Inhibition of RANK signaling in breast cancer induces an anti-tumor immune response orchestrated by CD8+ T cells

Clara Gómez-Aleza et al. Nat Commun. .

Abstract

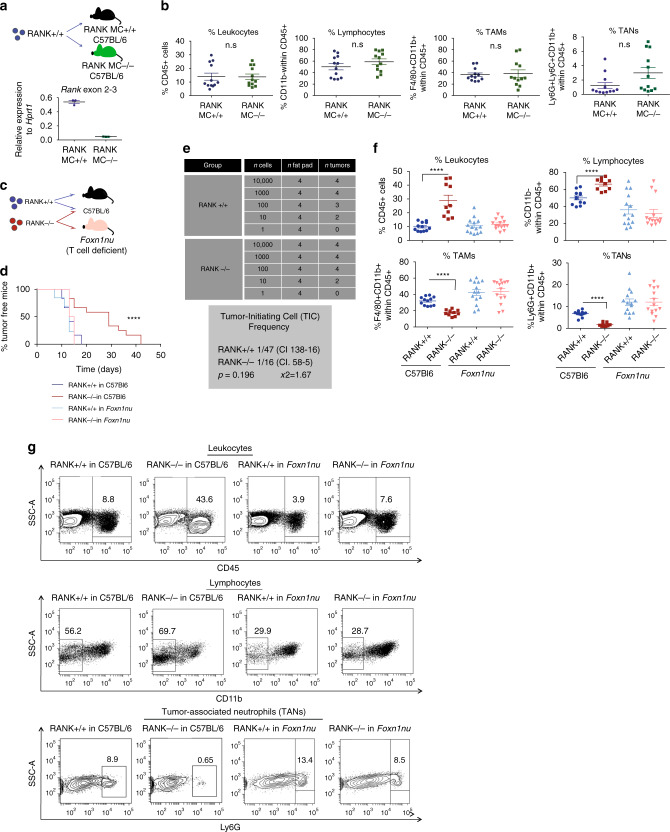
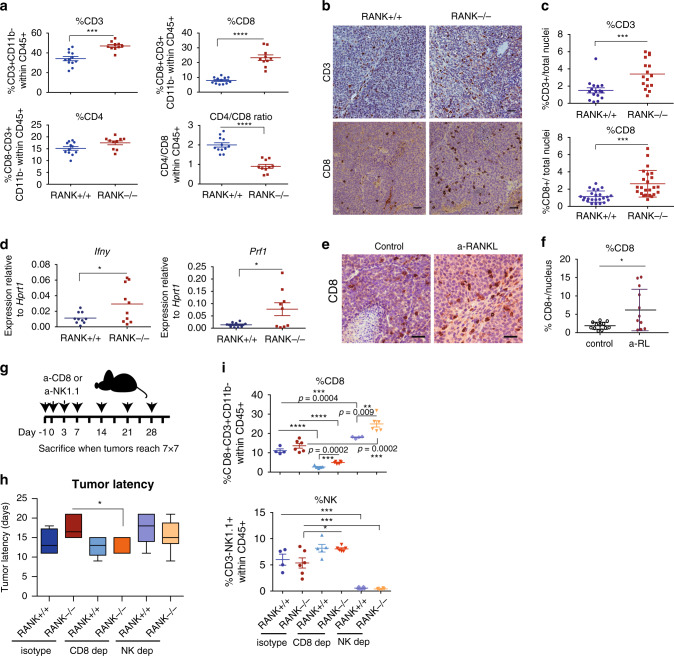
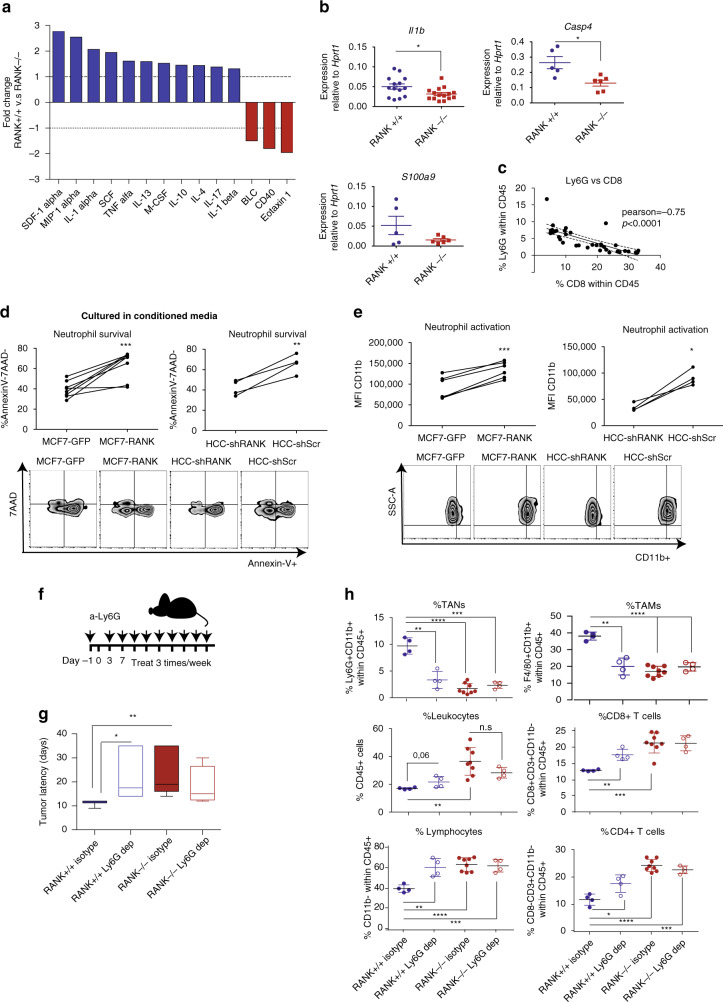
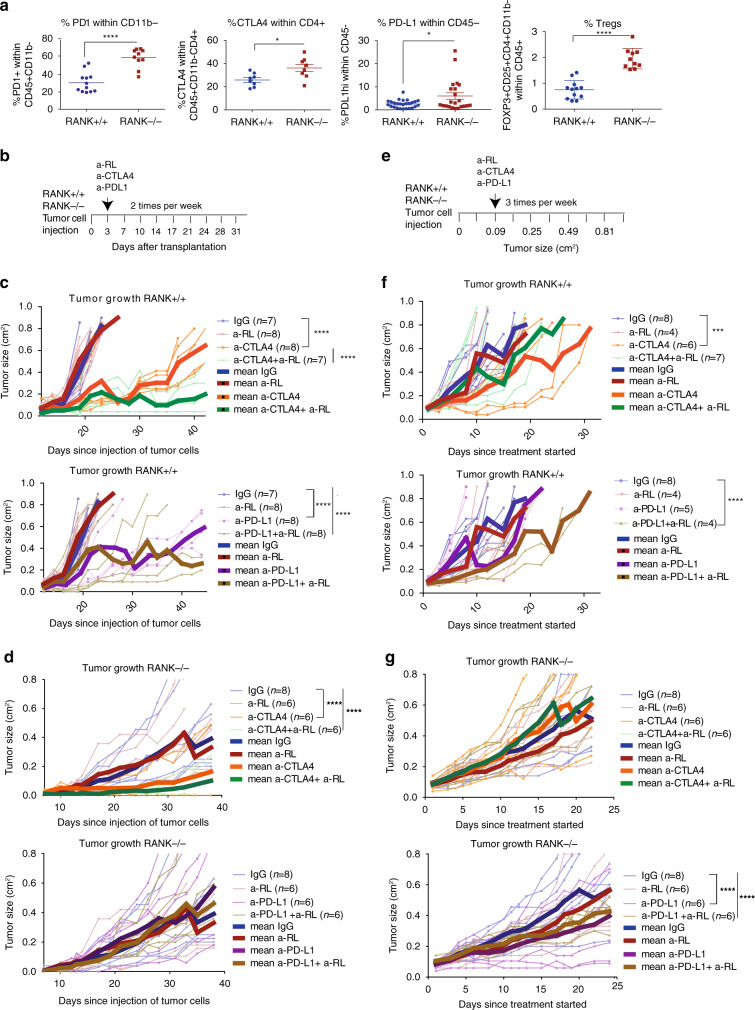
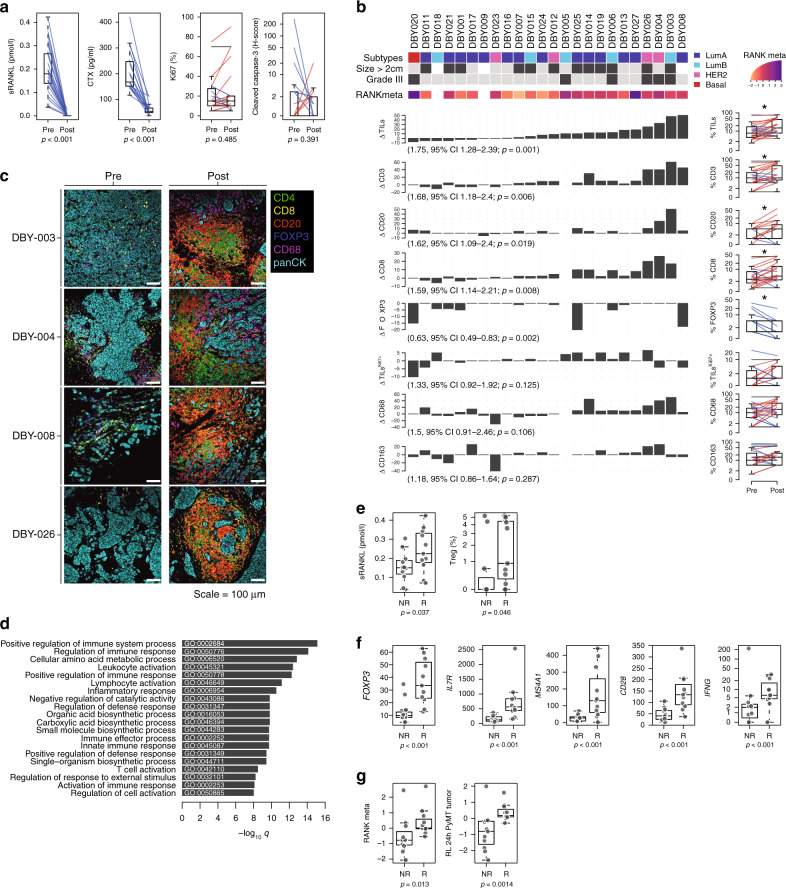
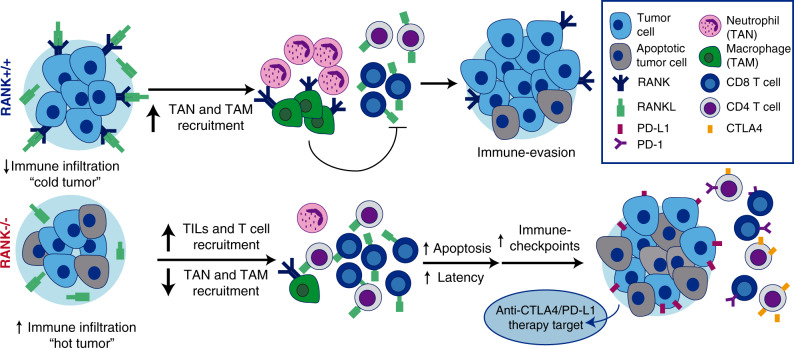
Most breast cancers exhibit low immune infiltration and are unresponsive to immunotherapy. We hypothesized that inhibition of the receptor activator of nuclear factor-κB (RANK) signaling pathway may enhance immune activation. Here we report that loss of RANK signaling in mouse tumor cells increases leukocytes, lymphocytes, and CD8+ T cells, and reduces macrophage and neutrophil infiltration. CD8+ T cells mediate the attenuated tumor phenotype observed upon RANK loss, whereas neutrophils, supported by RANK-expressing tumor cells, induce immunosuppression. RANKL inhibition increases the anti-tumor effect of immunotherapies in breast cancer through a tumor cell mediated effect. Comparably, pre-operative single-agent denosumab in premenopausal early-stage breast cancer patients from the Phase-II D-BEYOND clinical trial (NCT01864798) is well tolerated, inhibits RANK pathway and increases tumor infiltrating lymphocytes and CD8+ T cells. Higher RANK signaling activation in tumors and serum RANKL levels at baseline predict these immune-modulatory effects. No changes in tumor cell proliferation (primary endpoint) or other secondary endpoints are observed. Overall, our preclinical and clinical findings reveal that tumor cells exploit RANK pathway as a mechanism to evade immune surveillance and support the use of RANK pathway inhibitors to prime luminal breast cancer for immunotherapy.


Conflict of interest statement

R.S. reports non-financial support from Merck and Bristol Myers Squibb; research support from Merck, Puma Biotechnology, and Roche; and personal fees from BMS for an advisory board meeting and from Roche for an advisory board related to a trial-research project. H.A.A. is advisory board at Roche and current employee of Innate Pharma. E.G.S. and G.J.L. have served on advisory boards for Amgen and has received honoraria and research funding from Amgen. S.L. receives research funding from Novartis, Merck, BMS, Roche-Genentech, Puma Biotechnology, Pfizer, and uncompensated advisory board of Novartis, Merck, BMS, Roche-Genentech, Puma Biotechnology, Pfizer, and Seattle Genetics. The remaining authors declare no competing interests.

Figures

Fig. 1
Fig. 1. Loss of RANK in tumor cells, but not in myeloid cells, leads to increased TIL frequency, and T cells drive the delayed tumor formation and the reduced tumor-initiating ability of RANK-null tumor cells.
a Top panel: injection scheme showing the implantation of PyMT RANK+/+ (RANK+/+) tumors in LysM-Cre RANKfl/fl mice (RANK MC−/−) and WT (RANK MC+/+) (C57BL/6). Bottom panel: Rank mRNA expression levels relative to Hprt1 in peritoneal macrophages of RANK MC−/− and RANK MC+/+ mice (n = 3). Mean ± SEM is shown. b Graphs showing the percentages of tumor-infiltrating leukocytes (CD45+), lymphocytes (CD11b within CD45+), tumor-associated macrophages (TAMs) (F4/80+CD11b+ within CD45+) and tumor-associated neutrophils (TANs) (Ly6G+Ly6CCD11b+ within CD45+) in RANK+/+ tumor transplants in RANK MC−/− and RANK MC+/+ mice (n = 12 tumors). Mean, SEM shown. t-test and p-values were calculated. c Injection scheme showing the implantation of PyMT RANK+/+ and PyMT RANK−/− tumors in C57BL/6 WT animals and Foxn1nu mice. d Kinetics of palpable tumor onset (left) after tumor transplantation of RANK+/+ and RANK−/− tumor cells in syngeneic C57BL/6 (n = 6) and Foxn1nu mice (n = 7). Log-rank test performed with two-tailed p-value (****p = 0.005). One representative experiment out of two is shown. e Tumor-initiating frequencies as calculated by ELDA. Cells isolated from RANK+/+ and RANK−/− tumors were injected in Foxn1nu mice in limiting dilutions. WEHI’s online ELDA-software (http://bioinf.wehi.edu.au/software/elda/) was used to calculate the χ2-values with 95% confidence interval. f Graphs showing the percentages tumor-infiltrating leukocytes (CD45+; ****p < 0.0001), lymphocytes (CD11b within CD45+; ****p < 0.0001), TAMs (F4/80+CD11b+ within CD45+; ****p < 0.0001), TANs (Ly6G+CD11b+ within CD45+; ****p < 0.0001) in RANK+/+ or RANK−/− tumor transplants in syngeneic C57BL/6 and Foxn1nu mice (n = 12 RANK+/+ tumors, n = 10 RANK−/− tumors in C57BL/6 hosts; n = 14 RANK+/+ or RANK−/− tumors in Foxn1nu hosts). Tumors were analyzed at endpoint (>0.2 cm2). Mean, SEM and t-test two-tailed p-values are shown. Two representative primary tumors were used in these experiments. g Representative dot blots of leukocytes (CD45+) gated in live cells (7AAD) and lymphocytes (CD11b) gated on CD45+.
Fig. 2
Fig. 2. RANK loss in tumor cells leads to increased CD8+ Tcell tumor infiltration that mediates the delayed tumor latency of RANK−/− tumors.
a Graphs showing the percentage of T cells (CD3+CD11b within CD45+; ***p = 0.0001), CD8 (CD8+CD3+CD11b within CD45+; ****p < 0.0001), CD4 (CD8-CD3+CD11b within CD45+; p = 0.0503), and the CD4/CD8 ratio (****p < 0.0001) in RANK+/+ (n = 12) or RANK−/− (n = 10) tumor cells injected in syngeneic C57BL/6 mice#. Representative images (b) and quantification (c) of CD3+ (n = 4 tumors, ***p = 0.0009) and CD8+ cells (n = 6 tumors, ***p = 0.0001) in RANK+/+ and RANK−/− tumor transplants as assessed by IHC. Scale = 25 μm. Tumors derived from three independent primary tumors were used. Each dot represents one picture#. d Prf1 and Ifnγ mRNA levels relative to Hprt1 of whole tumors from RANK+/+ and RANK−/− transplants in syngeneic C57BL/6 mice (n = 10; Prf1 *p = 0.0286, Ifnγ *p = 0.0360)#. e, f Representative images (e) and quantification (f) of CD8+ cells in RANK+/+ control and anti-RANKL-treated tumors from second transplants as assessed by IHC. Scale = 25 μm. Each dot represents one picture (n = 12 pictures, n = 3 tumors, *p = 0.0168)#. g Schematic overview of CD8 (300 μg, clone 53-5.8) and NK1.1 (200 μg, clone PK136) treatments in orthotopic RANK+/+ and RANK−/− tumor transplants. Animals were treated i.p. on days −1, 0, 3, and 7 after tumor cell injection and then once per week until the day of killing, when tumors were >0.5 cm2. h Latency to tumor onset of RANK+/+ and RANK−/− tumor cells implanted in syngeneic C57BL/6 animals and treated with anti-CD8 or anti-NK1.1 depletion antibodies (n = 6) or corresponding isotype control (n = 4 for RANK+/+ and n = 6 for RANK−/−). Box and whisker plots (box represents the median and the 25th and 75th percentiles, whiskers show the largest and smallest values) and significant t-test two-tailed p-values are shown (*p = 0.05). i Graphs showing the percentage of infiltrating CD8 T cells (CD8+CD3+CD11b within CD45+) and NK (NK1.1+CD3 within CD45+). Each dot represents one tumor (n = 4 control and NK-depleted RANK+/+ tumors; n = 5 CD8-depleted RANK+/+ tumors; and n = 6 RANK−/− control, NK- and CD8-depleted tumors)#. #Mean, SEM and t-test two-tailed p-values are shown (*p < 0.05; **0.001 < p < 0.01; ***0.001 < p < 0.0001; ****p < 0.0001). For a and d, each dot represents one tumor analyzed at the endpoint (>0.2 cm2). Data for tumor transplants derived from two representative primary tumors in two independent experiments.
Fig. 3
Fig. 3. Neutrophils recruited by the proinflammatory cytokine/chemokine milieu driven by RANK restrict T-cell immunity.
a Cytokines/chemokines in the supernatant of RANK+/+ and RANK−/− tumor 3D acini cultured during 72 h, expressed as the magnitude of change between RANK+/+ and RANK−/− tumor acini (pool of 3 tumors, n = 1). See also Supplementary Data 5. b Il1b, Casp4, and S100a9 mRNA levels relative to Hprt1 of whole tumors from RANK+/+ and RANK−/− transplants in syngeneic C57BL/6 mice (n = 14 for Il1b, *p = 0.005; n = 5 RANK+/+ tumors, n = 6 RANK−/− tumors for Casp4, p = 0.011; and S100a9, p = 0.12). Two representative primary tumors of two independent experiments were used#. c Correlation between the frequency of TANs (Ly6G+ Ly6C+ CD11b+) and CD8+-T cells (CD8+ CD3+ CD11b) infiltrates in tumor transplants. Pearson’s correlation coefficients (r) associated probabilities are shown (p < 0.0001). d Percentage of Annexin V–7AAD neutrophils (n = 5, 2 healthy donors) cultured with conditioned media (CM) from the indicated RL-treated tumor cells. CM was added (1 : 1) to human neutrophil cultures for 24 h. Paired t-test with one-tailed p-value is shown (***p = 0.0002, **p = 0.009). e Mean fluorescence intensity (MFI) of CD11b+ neutrophils (n = 4, 2 healthy donors) cultured in CM from the indicated RL-treated tumor cells. CM was added (1 : 1) to human neutrophils cultures for 24 h. Paired t-test with one-tailed p-value is shown (***p = 0.0004, *p = 0.01). f Schematic overview of TAN (Ly6G+) depletion experiments in orthotopic RANK+/+ and RANK−/− tumor transplants. Anti-Ly6G (clone 1A8) was administered i.p. before tumor cell injection (400 µg) and then once per week (100 μg) until the day of killing. g Latency to tumor formation of RANK+/+ and RANK−/− tumor cells orthotopically implanted in syngeneic C57BL/6 animals and treated with anti-Ly6G depletion antibody or isotype control (n = 4 control and neutrophil-depleted RANK+/+ tumors, n = 8 control RANK−/− tumors, n = 4 neutrophil-depleted RANK−/− tumors). Box and whisker plots (box represents the median and the 25th and 75th percentiles, whiskers show the largest and smallest values) and t-test two-tailed p-values are shown. (*p = 0.028; **p = 0.007). h Graphs showing the percentage of TANs (Ly6G+ CD11b+, **p = 0.0012; ***p = 0.0003; ****p < 0.0001), leukocytes (CD45+; **p = 0.034), lymphocytes (CD11b; **p = 0.048; ***p = 0.0008; ****p < 0.0001), TAMs (F4/80+ CD11b+, **p = 0.0019; ****p < 0.0001), CD8+ T cells (CD8+ CD3+ CD11b, ***p = 0.0003, **p = 0.0014), and CD4+ T cells (CD8 CD3+ CD11b, *p = 0.0213, ***p = 0.001; ****p < 0.0001) (n = 4 control and neutrophil-depleted RANK+/+ tumors, n = 8 control RANK−/− tumors, n = 4 neutrophil-depleted RANK−/− tumors)#. #Each dot represents one tumor. Mean, SEM, and t-test two-tailed p-values are shown (*p < 0.05; **p < 0.01; ***p < 0.001; ****p < 00001). Tumors of similar size were analyzed at endpoint (>0.2 cm2). For d, e, each dot represents a technical replicate from healthy donors. Representative dot blots are shown below.
Fig. 4
Fig. 4. RANKL pharmacological inhibition reinforces anti-CTLA4 and anti-PD-L1 anti-tumor response in RANK+/+ but not in RANK−/− tumors.
a Graphs showing the percentage of PD-1+ cells within CD11b lymphocytes (n = 12 RANK+/+ tumors, n = 10 RANK−/− tumors; PD-1+ within CD11bCD45+; ****p < 0.0001), CTLA4 within CD4+ T cells (n = 8; CTLA4 within CD3+ CD8CD11bCD45+; *p = 0.0166), PD-L1 within tumor CD45 cells (n = 26 RANK+/+ tumors, n = 22 RANK−/− tumors; *p = 0.017), and Tregs (n = 12 RANK+/+ tumors, n = 10 RANK−/− tumors; FoxP3+ CD25+ CD4+ CD11b within CD45+; ****p < 0.0001) in RANK+/+ and RANK−/− transplants in syngeneic C57BL/6 mice. Each dot represents an individual tumor transplant derived from two to five different primary tumors. Mean, SEM, and t-test two-tailed p-values are shown (*p < 0.05; ****p < 0.0001). b Experimental scheme for early treatments with anti-RANKL (a-RL), anti-CTLA4, anti-PD-L1, or their respective isotype controls (rat IgG2A and mouse IgG2b). All treatments were administered i.p, two times/week, and started 3 days after injection of RANK+/+ and RANK−/− tumor cells into the mammary gland of syngeneic C57BL/6 mice. c, d Tumor growth curves for early treatments (scheduled as in Fig. 4b) of RANK+/+ (c) and RANK−/− (d) tumor cells injected in syngeneic C57BL/6. Each thin curve represents one single tumor. Each thick curve represents the mean of all the tumors that received the specific treatment. Linear regression analysis was performed and a two-tailed p-value was calculated to compare the tumor growth slopes after the specified treatments (****p < 0.0001). e Experimental scheme for late treatments with anti-RL, anti-CTLA4, anti-PD-L1, or their respective isotype controls (rat IgG2A and mouse IgG2b). All treatments were administered i.p., three times/week, and started when transplanted tumors reached a size of 0.09 cm2. f, g Tumor growth curves for late treatments (scheduled as in Fig. 4e) of RANK+/+ (f) and RANK−/− (g) tumor cells injected in syngeneic C57BL/6. Each thin curve represents one single tumor. Each thick curve represents the mean of all the tumors that received the specific treatment. Linear regression analysis was performed and a two-tailed p-value was calculated to compare the tumor growth slopes after the specified treatments ***p = 0.0002; ****p < 0.0001).
Fig. 5
Fig. 5. The immunomodulatory role of anti-RANKL in BC.
a Change from baseline in serum levels of free-sRANKL (n = 23, p = 2.384e-07) and CTX (n = 17, p = 1.526e-05) (significance assessed by the two-tailed sign test), the percentage of Ki-67-positive cells (p = 0.485) and the staining of activated caspase-3 (p = 0.391) (H-score) (n = 24) (significance assessed by two-tailed paired t-tests). Boxplots display median line, IQR boxes, 1.5 × IQR whiskers, and data points. b Each bar plot shows the change from baseline (Δ; post- minus pretreatment values) of the immune parameters assessed using HE (TILs) and IHC (CD3, CD20, CD8, FOXP3, proliferative TILs (TILsKi67+), CD68, and CD163). Each bar represents one patient, which are ranked by their increase in stromal TIL levels. Geometric mean changes, 95% CIs, and p-values are shown below each bar plot. For each measured parameter, the corresponding boxplot is displayed on the right-hand side. Boxplots display median line, IQR boxes, 1.5 × IQR whiskers, and data points. Tumor characteristics and tumor RANK metagene expression at baseline are shown above. p; p-values derived from two-tailed paired t-tests (*p < 0.05)#. c Representative micrographs of multiplex IHC of pre- and posttreatment tumor sections from the four patients with the highest immunomodulatory response. White scale bar, 100 μm. d Top 20 significantly enriched pathways after denosumab treatment, identified by GAGE. e Comparison of baseline serum levels of sRANKL between non-responders (NR; n = 13) vs. responders (R; n = 11) and comparison of baseline percentage of regulatory T cells (Tregs) as inferred from CIBERSORT. Boxplots display median line, IQR boxes, 1.5 × IQR whiskers, and data points. Significance determined by the two tailed Mann–Whitney U-test. f Comparison of baseline mRNA expression levels of indicated genes (normalized counts) between non-responder (NR; n = 11) and responder (R; n = 11) groups. Boxplots display median line, IQR boxes, 1.5 × IQR whiskers, and data points. Significance determined by the two-tailed Mann–Whitney U-test p-values: FOXP3 (p = 1.61e − 05), IL7R (p = 1.53e − 07), MS4A1 (p = 1.00E − 06), CD28 (p = 5.63e − 06), IFNG (p = 4.15e − 05). g Comparison of baseline RANK metagene and RANKL-treated PyMT tumor acini-derived gene signature between non-responder (NR; n = 11) and responder (R; n = 11) patients. Significance determined by the two tailed Mann–Whitney U-test. For a, b: each colored line represents one patient and indicates increase (red), decrease (blue), or no change (black) relative to baseline. Note that all variables were analyzed for all patients, but values for some lines overlap or the indicated population was not detected. Boxplots display median line, IQR boxes, 1.5 × IQR whiskers, and data points. #Responder patients are those with ≥10% increase in TIL infiltration after denosumab treatment. Significance determined by the two-tailed Mann–Whitney U-test.
Fig. 6
Fig. 6. The RANK pathway as immune modulator in breast cancer.
RANK expression in luminal breast cancer cells leads to the expression of proinflammatory cytokines/chemokines favoring recruitment of TAMs and TANs, immunosuppressive population that interfere with lymphocyte T-cell recruitment and/or activity. Denosumab (anti-RANKL) or RANK signaling inhibition results in increased TILs, lymphocytes, and CD8+ T-cell infiltration, transforming immune “cold” tumors into “hot” ones and attenuating tumor growth. Eventually, the exacerbated immune response driven by RANK inhibition will induce the expression of immune checkpoints evading immune surveillance and allowing tumor growth. These results support the benefit of combining RANKL and immune-checkpoint inhibitors in luminal breast cancer.

References

    1. Azim, H. A. et al. RANK-ligand (RANKL) expression in young breast cancer patients and during pregnancy. Breast Cancer Research. 17, 24 (2015). - PMC - PubMed
    1. Fata JE, et al. The osteoclast differentiation factor osteoprotegerin-ligand is essential for mammary gland development. Cell. 2000;103:41–50. doi: 10.1016/S0092-8674(00)00103-3. - DOI - PubMed
    1. Gonzalez-Suarez E, et al. RANK overexpression in transgenic mice with mouse mammary tumor virus promoter-controlled RANK increases proliferation and impairs alveolar differentiation in the mammary epithelia and disrupts lumen formation in cultured epithelial acini. Mol. Cell. Biol. 2007;27:1442–1454. doi: 10.1128/MCB.01298-06. - DOI - PMC - PubMed
    1. Gonzalez-Suarez E, et al. RANK ligand mediates progestin-induced mammary epithelial proliferation and carcinogenesis. Nature. 2010;468:103–107. doi: 10.1038/nature09495. - DOI - PubMed
    1. Schramek D, et al. Osteoclast differentiation factor RANKL controls development of progestin-driven mammary cancer. Nature. 2010;468:98–102. doi: 10.1038/nature09387. - DOI - PMC - PubMed

Publication types

MeSH terms

Associated data