. 2020 Dec 10;11(1):6322.
doi: 10.1038/s41467-020-20059-6.

Single-cell RNA landscape of intratumoral heterogeneity and immunosuppressive microenvironment in advanced osteosarcoma

Affiliations

Single-cell RNA landscape of intratumoral heterogeneity and immunosuppressive microenvironment in advanced osteosarcoma

Yan Zhou et al. Nat Commun. .

Erratum in

Abstract

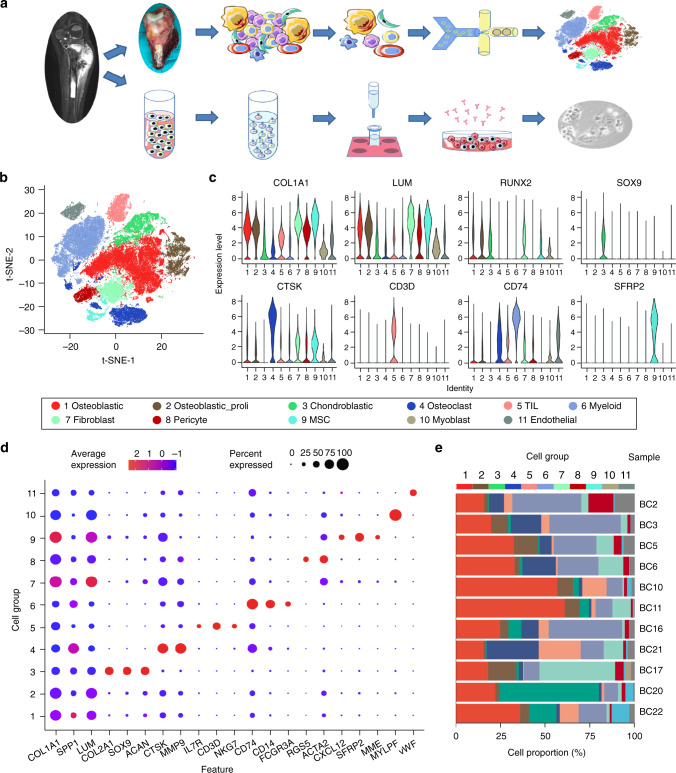
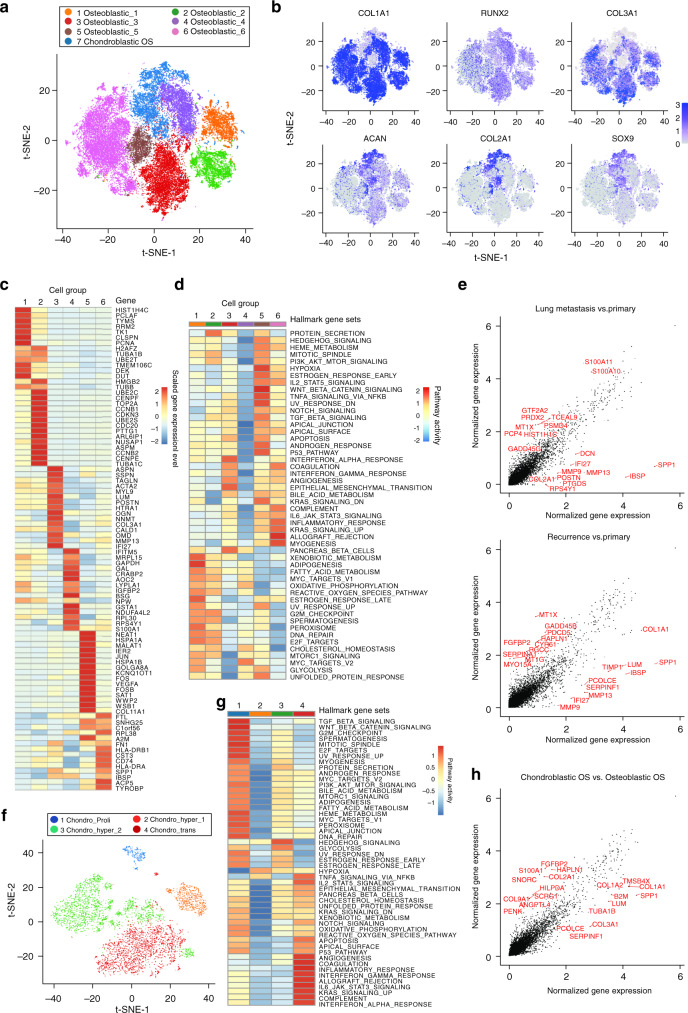
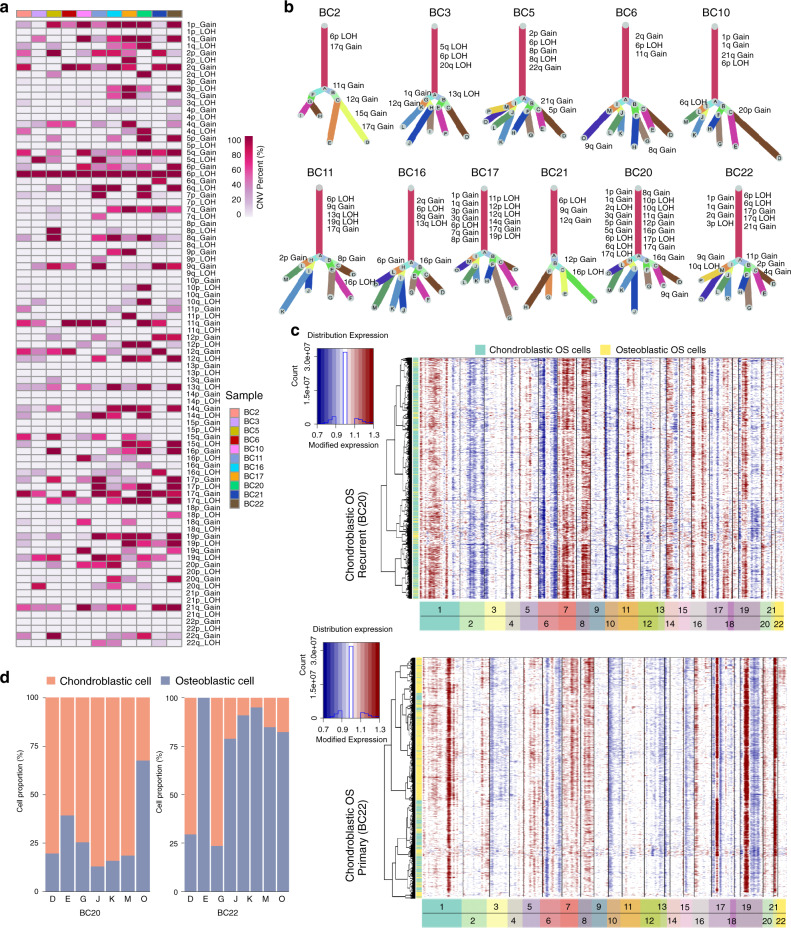
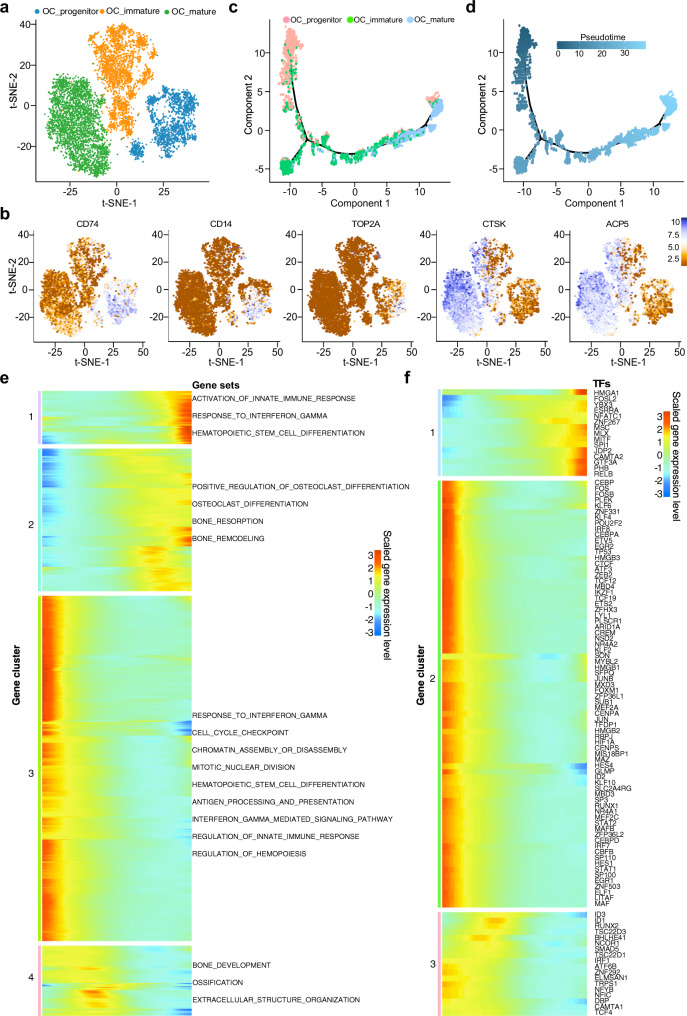
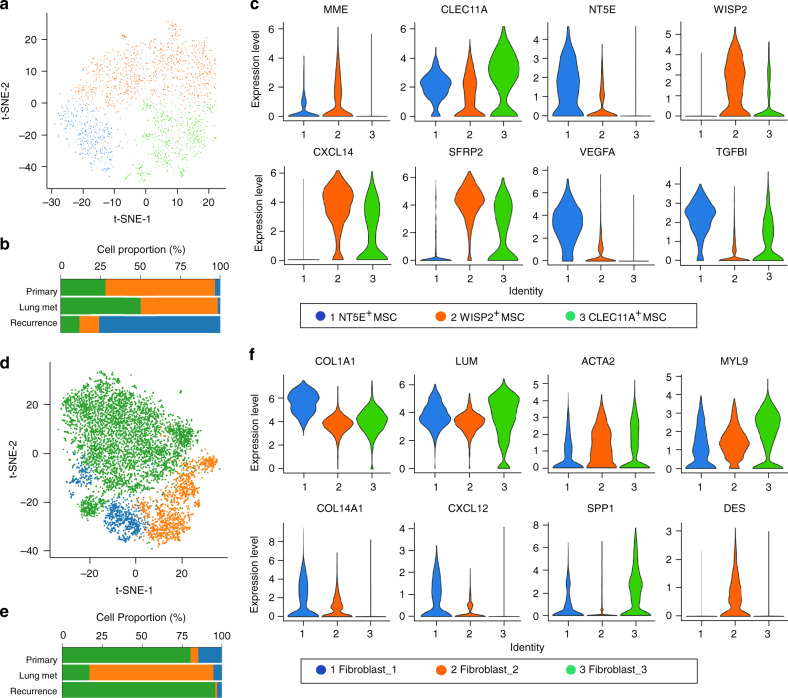
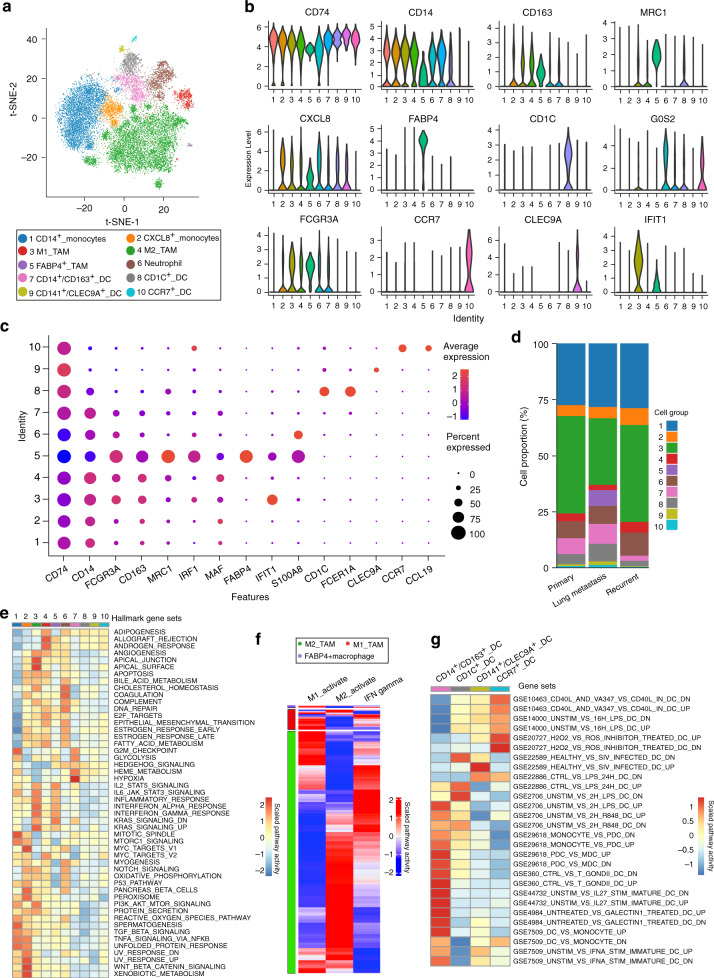
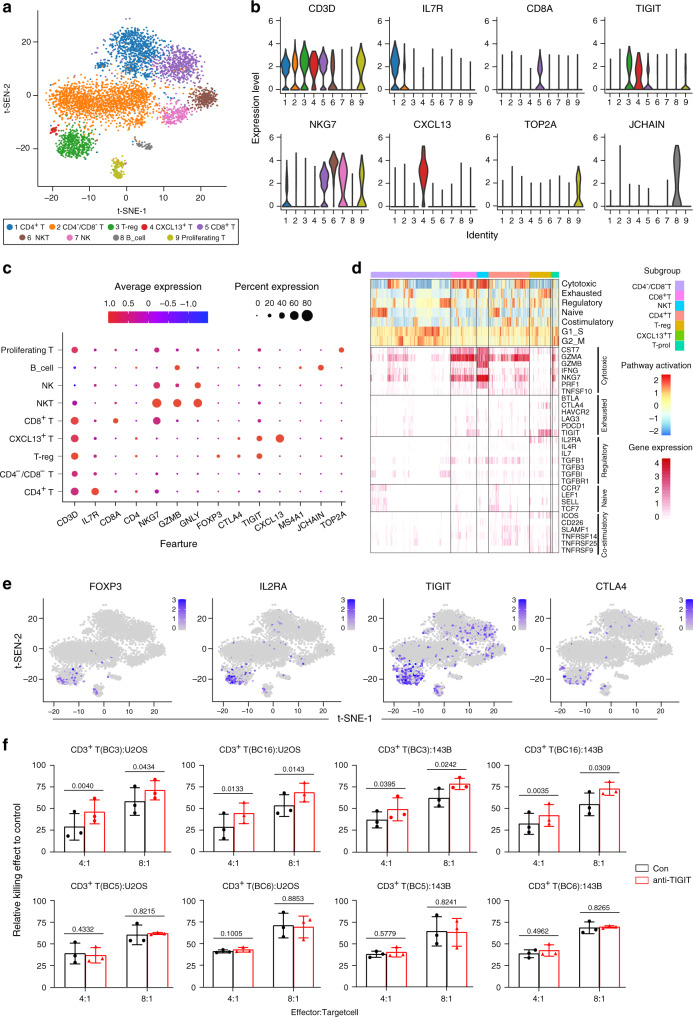
Osteosarcoma is the most frequent primary bone tumor with poor prognosis. Through RNA-sequencing of 100,987 individual cells from 7 primary, 2 recurrent, and 2 lung metastatic osteosarcoma lesions, 11 major cell clusters are identified based on unbiased clustering of gene expression profiles and canonical markers. The transcriptomic properties, regulators and dynamics of osteosarcoma malignant cells together with their tumor microenvironment particularly stromal and immune cells are characterized. The transdifferentiation of malignant osteoblastic cells from malignant chondroblastic cells is revealed by analyses of inferred copy-number variation and trajectory. A proinflammatory FABP4+ macrophages infiltration is noticed in lung metastatic osteosarcoma lesions. Lower osteoclasts infiltration is observed in chondroblastic, recurrent and lung metastatic osteosarcoma lesions compared to primary osteoblastic osteosarcoma lesions. Importantly, TIGIT blockade enhances the cytotoxicity effects of the primary CD3+ T cells with high proportion of TIGIT+ cells against osteosarcoma. These results present a single-cell atlas, explore intratumor heterogeneity, and provide potential therapeutic targets for osteosarcoma.


Conflict of interest statement

The authors declare no competing interests.

Figures

Fig. 1
Fig. 1. Single-cell transcriptomic analysis of OS lesions.
a Graphical view of the study roadmap. Single-cell suspensions were collected from OS lesions of 11 patients followed by scRNA-seq on 10× Genomics platform, respectively. A total of 100,987 qualified single cells were recovered. The peripheral blood CD3+ T cells were isolated for cytotoxicity analysis for TIGIT blocking experiments. b The t-distributed stochastic neighbor embedding (t-SNE) plot of the 11 identified main cell types in OS lesions. c Violin plots showing the normalized expression levels of eight representative canonical marker genes across the 11 clusters. d Dot plots showing the 21 signature gene expressions across the 11 cellular clusters. The size of dots represents the proportion of cells expressing the particular marker, and the spectrum of color indicates the mean expression levels of the markers (log1p transformed). e Relative proportion of each cell cluster across 11 OS lesions as indicated. The values of the detailed relative proportion of each cell cluster are provided in the Source Data file.
Fig. 2
Fig. 2. Distinct clusters of malignant cells in OS lesions.
a Seven main malignant OS cell subclusters were identified by t-SNE analysis. b Feature plots for marker genes of osteoblastic (COL1A1, RUNX2, and COL3A1) and chondroblastic (ACAN, COL2A1 and SOX9) tumor cells. The color legend shows the log1p normalized expression levels of the genes. c The heatmap of the average expression of top 15 DEGs among six subclusters of osteoblastic tumor cells. The color legend indicates normalized gene expression levels among the subclusters. d The heatmap of GSEA of the 50 hallmark gene sets in MSigDB database among the six osteoblastic cell subclusters. e The scatter plot of the DEGs between osteoblastic tumor cells from lung metastasis (upper panel) or recurrent lesion (lower panel) versus primary lesion. The top 10 DEGs in each comparison were labeled in red. f The t-SNE plot of the four subclusters of chondroblastic cells. g The heatmap of GSEA of the 50 hallmark gene sets in MSigDB among the four chondroblastic clusters. h The scatter plot of the DEGs between chondroblastic and osteoblastic malignant cells. The top 10 genes in each subcluster were marked in red. Relative GSEA scores for each gene set across the cell clusters (d, g) and detailing average normalized gene expression (log1p transformed) values in different tumor sites (e) or types (h) are provided in the Source Data file.
Fig. 3
Fig. 3. Copy-number variation and clonal evolution analysis of OS cells.
a The summary CNV profiles of the OS cells for the 11 OS samples inferred from inferCNV analysis. The CNV levels were categorized by the chromosome arm and simplified as gain or loss in single cells. Color in the heatmap indicated the percent of the CNV events in the single cells from each individual sample. b Clonality trees of the single cells from each patient. The branches are delineated according to the percentage of cells in the subclone containing the corresponding CNVs. The canonical CNV events in each lesion were labeled in the clonality tree. c The hierarchical heatmap showing large-scale CNVs in chondroblastic OS lesions form one primary (BC22) and one recurrent (BC20) OS sample (see Supplementary Fig. 8 for the other nine OS samples). d The percentage of chondroblastic and osteoblastic OS cells in each branch of clonality tree as indicated in (b) for the two lesions (BC20 and BC22). The percent value of the chromosomal CNV events (a) in the single cells from each individual sample is provided in the Source Data file.
Fig. 4
Fig. 4. Trajectory analysis of osteoclast cells (OC) in OS lesions.
a t-SNE plot showing the three main subclusters of osteoclasts. b Feature plots showing the normalized expression levels of myeloid and osteoclast markers CD74, CD14, ACP5, CTSK, and TOP2A in these subclusters. c, d The Monocle 2 trajectory plot showing the dynamics of osteoclast subclusters (c) and their pseudotime curve (d). e The DEGs (in rows, q-value < 10−10) along the pseudotime were hierarchically clustered into four subclusters. The top annotated GO terms in each cluster were provided. f Heatmap hierarchical clustering showing differentially expressed transcription factor genes along with the pseudotime curve in (e).
Fig. 5
Fig. 5. Clustering and identification of mesenchymal stem cells (MSCs) and cancer-associated fibroblasts (CAFs) subclusters in OS lesions.
a t-SNE plot of MSCs identified in the 11 OS lesions, colored by the three subclusters of cells as indicated. b The mean percent of the 3 MSC subclusters in primary, lung metastasis and recurrent samples. c Violin plots showing the normalized expression levels of marker genes across the clusters. d t-SNE plot of three subclusters of CAFs identified in the 11 OS lesions. e The mean percent of CAF subclusters in the three types of lesions. f Violin plots showing the normalized expression levels of marker genes across the three subclusters of CAFs. The values of mean proportions of MSCs (b) and CAFs (e) subclusters are provided in the Source Data file.
Fig. 6
Fig. 6. Comprehensive dissection of myeloid cells in OS lesions.
a t-SNE plot separated 10 subclusters of the myeloid cells in OS lesions. b The violin plots showing the normalized expression levels of signature genes across the myeloid subclusters. c Dot plots showing cluster signature genes in myeloid cells. The size of dots represents the proportion of cells expressing the particular marker, and the spectrum of color indicates the mean expression levels of the markers (log1p transformed). d The proportion of the myeloid cells in the OS lesions with different types of lesions. e The heatmap of GSEA of 50 hallmark gene sets in MSigDB database between the 10 subclusters of myeloid cells. f Heatmap of the gene sets or signaling pathways specific for M1-activation, M2-activation, and IFN-γ activation for the macrophages in OS lesions, based on GSVA enrichment scores. g Heatmap of the gene sets or signaling pathways specific for each of the four subclusters of DC-activation based on GSEA enrichment scores with MSigDB database. The detailed cell proportion values of (d) and the relative GSEA scores for each gene set across the cell clusters of (e, g) are provided in the Source Data file.
Fig. 7
Fig. 7. Cell clustering and functional annotation of tumor-infiltrating lymphocytes (TILs) in OS lesions.
a t-SNE plot for TILs in OS lesions, and the cells were classified into seven subclusters. b The violin plots showing the normalized expression levels of 8 signature genes across the TIL subclusters. c Dot plots showing 14 signature genes among the TIL subclusters. The size of dots represents the proportion of cells expressing the particular marker, and the spectrum of color indicates the mean expression level of the markers (log1p transformed). d The t-SNE plot showing the expression profiles of the four selected well-known marker genes for exhausted T cells. e Heatmap of the gene sets of T-cell cytotoxicity, exhaustion, regulatory cytokines and receptors, naive T cells, and T-cell costimulation, based on GSVA enrichment analysis. f Blockade of TIGIT increases the CD3+ T cells mediated cellular cytotoxicity activities on U2OS and 143B cells derived from patients BC3 and BC16, but not for BC5 and BC6 (n = 3). Error bar: mean value ± SD. P values were determined by paired two-sided Student’s t-test. The source data for the relative T cellular cytotoxicity activities on OS cell lines (f) are provided in the Source Data file.

References

    1. Pingping B, et al. Incidence and Mortality of Sarcomas in Shanghai, China, During 2002–2014. Front. Oncol. 2019;9:662. - PMC - PubMed
    1. Lancia C, et al. A novel method to address the association between received dose intensity and survival outcome: benefits of approaching treatment intensification at a more individualised level in a trial of the European Osteosarcoma Intergroup. Cancer Chemother. Pharmacol. 2019;83:951–962. - PMC - PubMed
    1. Rosenberg AE. WHO Classification of Soft Tissue and Bone, fourth edition: summary and commentary. Curr. Opin. Oncol. 2013;25:571–573. - PubMed
    1. Mutsaers AJ, Walkley CR. Cells of origin in osteosarcoma: mesenchymal stem cells or osteoblast committed cells? Bone. 2014;62:56–63. - PubMed
    1. Ciernik IF, et al. Proton-based radiotherapy for unresectable or incompletely resected osteosarcoma. Cancer. 2011;117:4522–4530. - PMC - PubMed

Publication types

MeSH terms