. 2020 Dec 10;11(1):6337.
doi: 10.1038/s41467-020-19716-7.

Diffuse neural coupling mediates complex network dynamics through the formation of quasi-critical brain states

Affiliations

Diffuse neural coupling mediates complex network dynamics through the formation of quasi-critical brain states

Eli J Müller et al. Nat Commun. .

Abstract

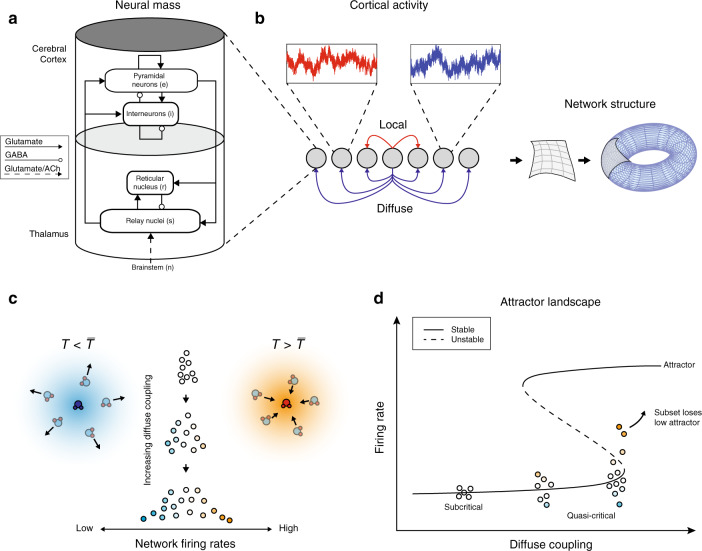
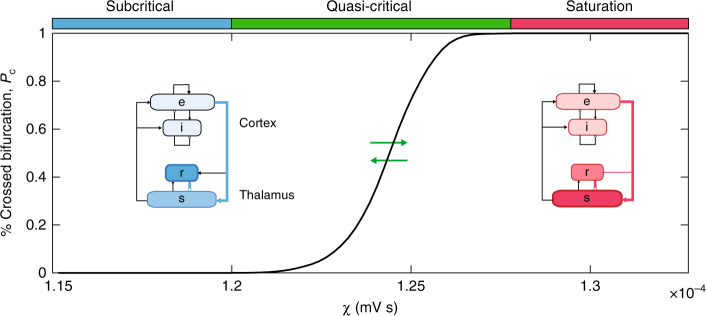
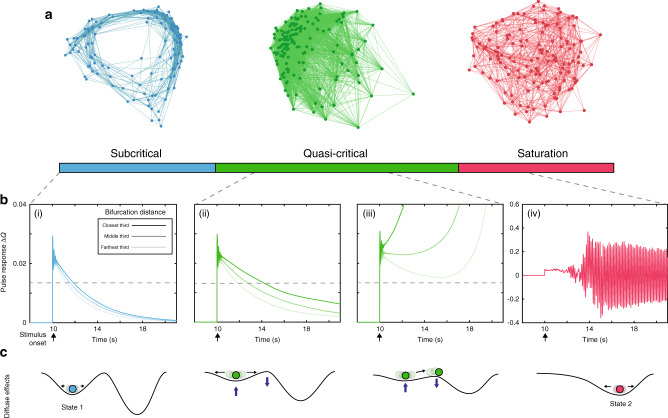
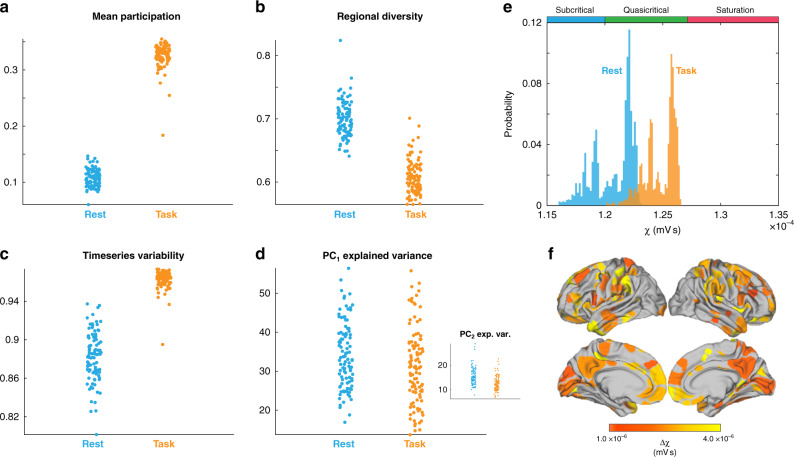
The biological mechanisms that allow the brain to balance flexibility and integration remain poorly understood. A potential solution may lie in a unique aspect of neurobiology, which is that numerous brain systems contain diffuse synaptic connectivity. Here, we demonstrate that increasing diffuse cortical coupling within a validated biophysical corticothalamic model traverses the system through a quasi-critical regime in which spatial heterogeneities in input noise support transient critical dynamics in distributed subregions. The presence of quasi-critical states coincides with known signatures of complex, adaptive brain network dynamics. Finally, we demonstrate the presence of similar dynamic signatures in empirical whole-brain human neuroimaging data. Together, our results establish that modulating the balance between local and diffuse synaptic coupling in a thalamocortical model subtends the emergence of quasi-critical brain states that act to flexibly transition the brain between unique modes of information processing.


Conflict of interest statement

The authors declare no competing interests.

Figures

Fig. 1
Fig. 1. Model schema.
a Corticothalamic neural mass model implemented at each node of the network: each mass was comprised of four distinct cellular populations: an excitatory cortical pyramidal cell (“e“), an inhibitory cortical interneuron (i), an excitatory, specific thalamic relay nucleus (“s”), and an inhibitory thalamic reticular nucleus (“r), with intranode corticothalamic neural mass coupling defined according to known anatomical connectivity. b Connectivity schematic—local and diffuse coupling with periodic boundary conditions (toroidal topology). c Distribution of nodal firing rates across the network—an increase in diffuse coupling subsequently increases the standard deviation of firing rates, with the tails of this distribution having greater above (and below) average values. The cartoons depict subsets of a thermal system with temperature T below (left) and above (right) the average T¯. d Qualitative effect of increasing diffuse coupling in the presence of heterogeneity on the attractor landscape: increased diffuse coupling shifts all nodes towards their local saddle-node bifurcation point. In the middle of this continuum, the heterogeneous inputs allow a particular subset of nodes (shaded orange) to cross this point and the activity of these nodes begins to move towards the high firing attractor.
Fig. 2
Fig. 2. Promoting quasi-critical states.
The time averaged percentage of nodes that have crossed their bifurcation, Pc, as a function of diffuse coupling, χ. We identified three qualitative zones: a low variability subcritical zone (blue), where no nodes crossed their bifurcation point for the full duration of the simulation, a highly variable, quasi-critical zone (green) where at least one node was below its bifurcation during the second half of the simulation, and a saturated, oscillatory zone (red). The insets show steady-state firing rates for each population within the neural mass model relatively represented via color intensity.
Fig. 3
Fig. 3. Properties of quasi-critical states.
a Average regional correlations within each zone shown as a force-directed graph. b For a given χ, each node was stimulated with an excitatory rectangular pulse (amplitude = 1 mV; width = 10 ms) at t = 10 s. The target nodes activity was then compared to simulated activity in the absence of the pulse using the same noise sequence in order to quantify the perturbation induced. The pulse results are sorted based on their mean distance to bifurcation in the preceding 8 time points. For visualization purposes we then average the activity within the closest, middle, and farthest thirds based on this sorted distance, and low-pass filtered with a passband frequency of 0.001 Hz. (i) χ = 1.15 × 10−4 (ii) χ = 1.21 × 10−4 (iii) χ = 1.25 × 10−4 (iv) χ = 1.3 × 10−4 mV s; Note the vertical axis on (iv) differs from (i)–(iii). c Qualitative effect of increasing diffuse coupling on the attractor landscape: in the subcritical zone, the system was enslaved to the lower attractor; increasing χ into the quasi-critical zone had the effect of flattening the attractor landscape, allowing noise-driven excursions to transition nodes across their local bifurcation point; at high values of χ, the system became enslaved to the higher attractor.
Fig. 4
Fig. 4. Network topology and dimensionality.
a Mean participation—which quantifies the extent to which a region functionally connects across multiple modules (these were calculated using a weighted version of the Louvain algorithm across all simulations). (b: left) Average time-series variability; (b: right) Regional diversity—defined as the variance in the upper triangle of the region-wise functional connectivity matrix. c Explained variance captured by PC1, σ1, and PC2, σ2. κ demarcates corresponding points in all panels.
Fig. 5
Fig. 5. Signatures of quasi-criticality across task and rest.
fMRI data from 100 unrelated subjects during a two-back task from the Human Connectome Project were analyzed to determine whether the task and rest states were associated with unique signatures of complex, adaptive brain dynamics. a Mean Participation was elevated during task performance (paired t test: t = 83.8; p = 1.02 × 10−93). b Regional diversity, defined as the variance in the upper triangle of the region-wise functional connectivity matrix, was lower during task performance than rest (paired t test: t = 29.1; p = 2.37 × 10−50); c fMRI time-series variability (paired t test: t = −31.1; p = 6.83 × 10−53). d Variance explained by first principal component (paired t test: t = 5.21; p = 1.04 × 10−6). d (inset) Variance explained by second principal component (paired t test: t = 9.06; p = 1.23 × 10−14). e Task and rest signatures were applied to a novel stochastic data-fitting algorithm to orient the brain states at different levels of χ: rest was associated with a lower diffuse coupling (χtest ~ 1.22 ± 0.1 mV s) than task states (χtask ~ 1.26 ± 0.1 mV s); (f) surface projection of Δχ for each region , generated by independently removing each region of the data, recalculating the signatures, and refitting to generate a Δχ.

References

    1. Shine JM, et al. Human cognition involves the dynamic integration of neural activity and neuromodulatory systems. Nat. Neurosci. 2019;22:289–296. doi: 10.1038/s41593-018-0312-0. - DOI - PubMed
    1. Sporns O, Tononi G, Edelman GM. Connectivity and complexity: the relationship between neuroanatomy and brain dynamics. Neural Netw. 2000;13:909–922. doi: 10.1016/S0893-6080(00)00053-8. - DOI - PubMed
    1. Kehagia AA, Murray GK, Robbins TW. Learning and cognitive flexibility: frontostriatal function and monoaminergic modulation. Curr. Opin. Neurobiol. 2010;20:199–204. doi: 10.1016/j.conb.2010.01.007. - DOI - PubMed
    1. Bullmore E, Sporns O. The economy of brain network organization. Nat. Rev. Neurosci. 2012;13:336–349. doi: 10.1038/nrn3214. - DOI - PubMed
    1. Cunningham JP, Yu BM. Dimensionality reduction for large-scale neural recordings. Nat. Neurosci. 2014;17:1500–1509. doi: 10.1038/nn.3776. - DOI - PMC - PubMed

Publication types