

Dynamic changes in cell size and corresponding cell fate after optic nerve injury
- PMID: 33303775
- PMCID: PMC7730151
- DOI: 10.1038/s41598-020-77760-1
Dynamic changes in cell size and corresponding cell fate after optic nerve injury
Abstract
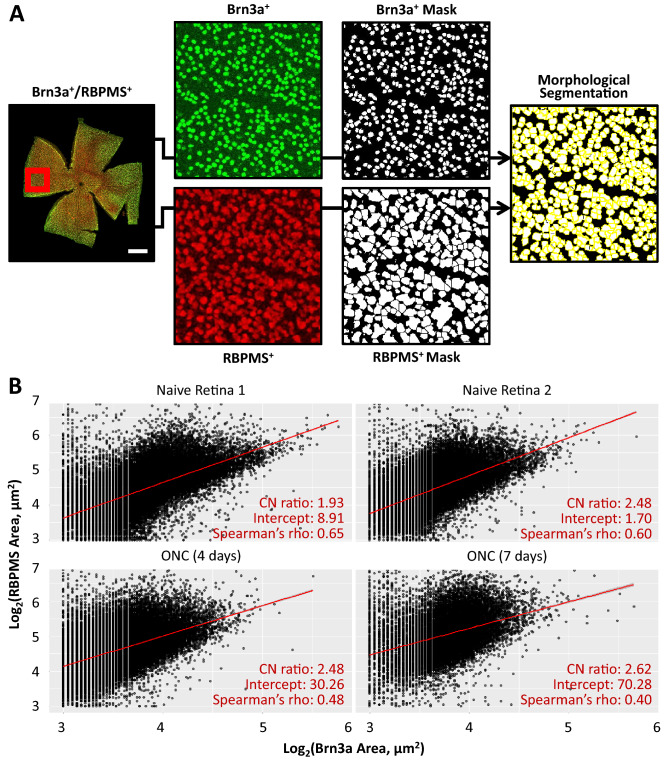
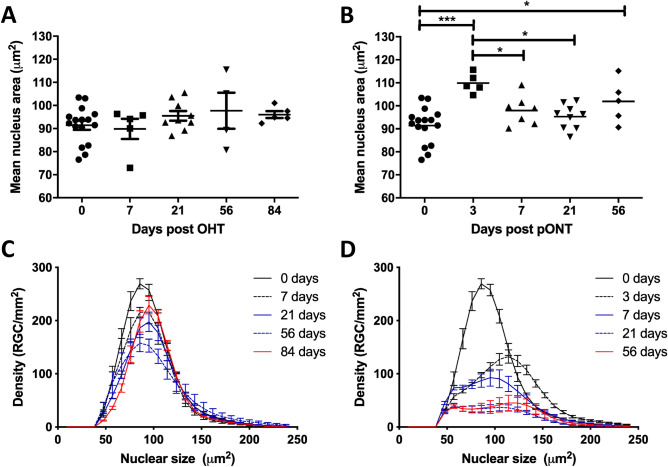
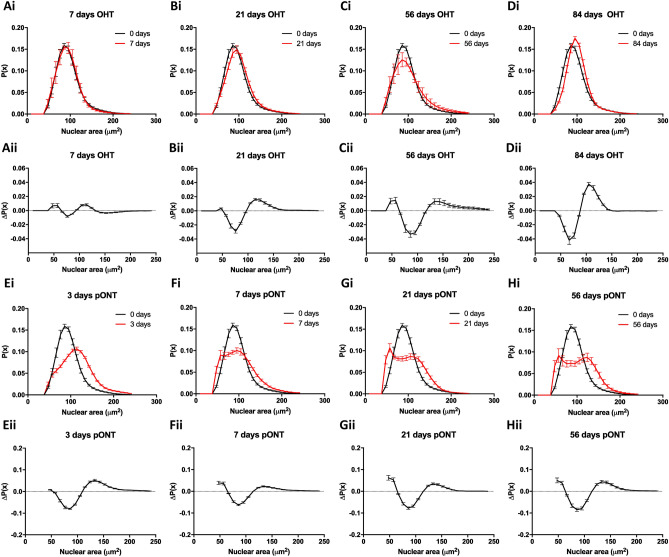
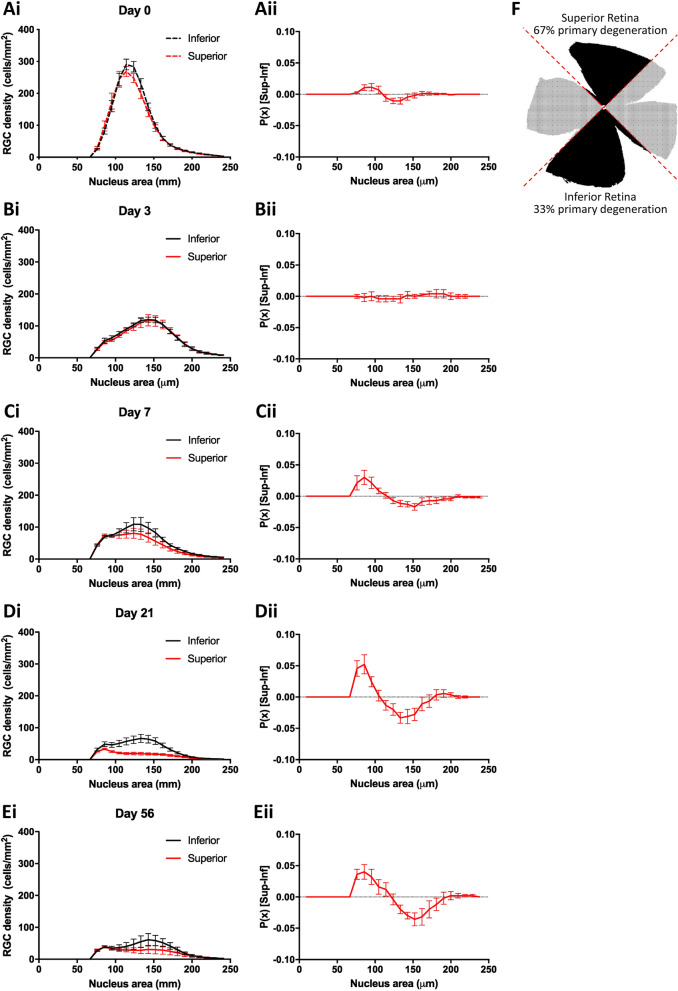
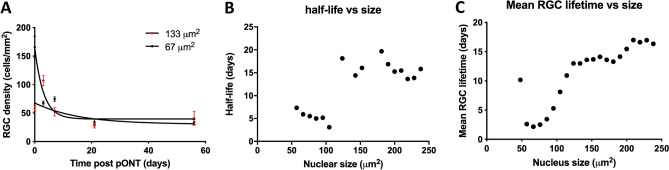
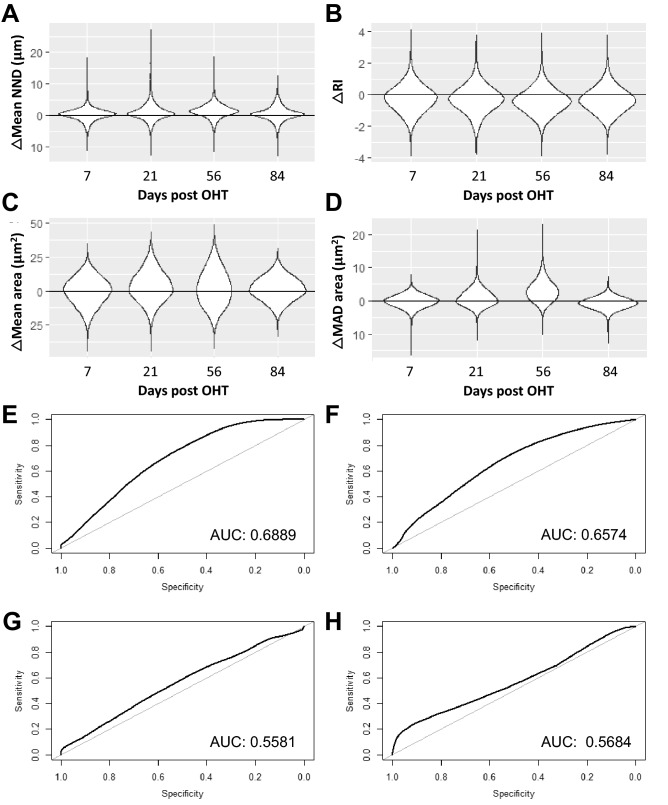
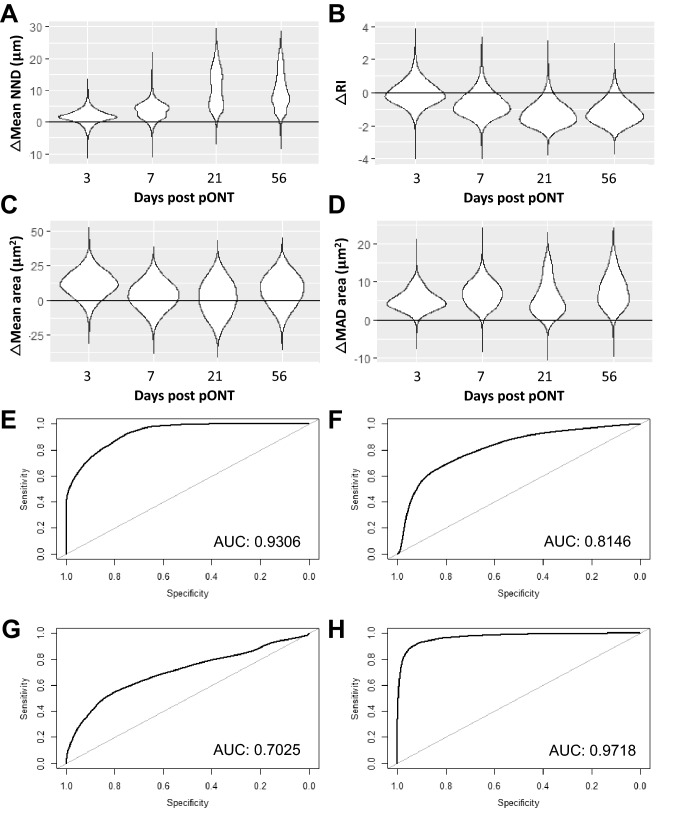
Identifying disease-specific patterns of retinal cell loss in pathological conditions has been highlighted by the emergence of techniques such as Detection of Apoptotic Retinal Cells and Adaptive Optics confocal Scanning Laser Ophthalmoscopy which have enabled single-cell visualisation in vivo. Cell size has previously been used to stratify Retinal Ganglion Cell (RGC) populations in histological samples of optic neuropathies, and early work in this field suggested that larger RGCs are more susceptible to early loss than smaller RGCs. More recently, however, it has been proposed that RGC soma and axon size may be dynamic and change in response to injury. To address this unresolved controversy, we applied recent advances in maximising information extraction from RGC populations in retinal whole mounts to evaluate the changes in RGC size distribution over time, using three well-established rodent models of optic nerve injury. In contrast to previous studies based on sampling approaches, we examined the whole Brn3a-positive RGC population at multiple time points over the natural history of these models. The morphology of over 4 million RGCs was thus assessed to glean novel insights from this dataset. RGC subpopulations were found to both increase and decrease in size over time, supporting the notion that RGC cell size is dynamic in response to injury. However, this study presents compelling evidence that smaller RGCs are lost more rapidly than larger RGCs despite the dynamism. Finally, using a bootstrap approach, the data strongly suggests that disease-associated changes in RGC spatial distribution and morphology could have potential as novel diagnostic indicators.
Conflict of interest statement
The authors declare no competing interests.
Figures
Similar articles
-
Establishing the ground squirrel as a superb model for retinal ganglion cell disorders and optic neuropathies.Lab Invest. 2021 Sep;101(9):1289-1303. doi: 10.1038/s41374-021-00637-y. Epub 2021 Jul 12. Lab Invest. 2021. PMID: 34253851 Free PMC article.
-
Retinal ganglion cell loss in a rat ocular hypertension model is sectorial and involves early optic nerve axon loss.Invest Ophthalmol Vis Sci. 2011 Jan 21;52(1):434-41. doi: 10.1167/iovs.10-5856. Print 2011 Jan. Invest Ophthalmol Vis Sci. 2011. PMID: 20811062 Free PMC article.
-
Overexpression of Brain-Derived Neurotrophic Factor Protects Large Retinal Ganglion Cells After Optic Nerve Crush in Mice.eNeuro. 2017 Jan 17;4(1):ENEURO.0331-16.2016. doi: 10.1523/ENEURO.0331-16.2016. eCollection 2017 Jan-Feb. eNeuro. 2017. PMID: 28101532 Free PMC article.
-
Assessment of retinal ganglion cell damage in glaucomatous optic neuropathy: Axon transport, injury and soma loss.Exp Eye Res. 2015 Dec;141:111-24. doi: 10.1016/j.exer.2015.06.006. Epub 2015 Jun 9. Exp Eye Res. 2015. PMID: 26070986 Review.
-
Advances in retinal ganglion cell imaging.Eye (Lond). 2015 Oct;29(10):1260-9. doi: 10.1038/eye.2015.154. Epub 2015 Aug 21. Eye (Lond). 2015. PMID: 26293138 Free PMC article. Review.
Cited by
-
Training in cortically-blind fields confers patient-specific benefit against retinal thinning after occipital stroke.medRxiv [Preprint]. 2023 Dec 20:2023.12.19.23298260. doi: 10.1101/2023.12.19.23298260. medRxiv. 2023. Update in: Invest Ophthalmol Vis Sci. 2024 Apr 1;65(4):29. doi: 10.1167/iovs.65.4.29. PMID: 38196617 Free PMC article. Updated. Preprint.
-
Differential susceptibility of retinal ganglion cell subtypes against neurodegenerative diseases.Graefes Arch Clin Exp Ophthalmol. 2022 Jun;260(6):1807-1821. doi: 10.1007/s00417-022-05556-2. Epub 2022 Jan 17. Graefes Arch Clin Exp Ophthalmol. 2022. PMID: 35038014 Review.
-
Quantification and image-derived phenotyping of retinal ganglion cell nuclei in the nee mouse model of congenital glaucoma.Exp Eye Res. 2021 Nov;212:108774. doi: 10.1016/j.exer.2021.108774. Epub 2021 Sep 29. Exp Eye Res. 2021. PMID: 34597676 Free PMC article.
-
Training in Cortically Blinded Fields Appears to Confer Patient-Specific Benefit Against Retinal Thinning.Invest Ophthalmol Vis Sci. 2024 Apr 1;65(4):29. doi: 10.1167/iovs.65.4.29. Invest Ophthalmol Vis Sci. 2024. PMID: 38635245 Free PMC article.
References
-
- Quigley HA, et al. Retinal ganglion cell death in experimental glaucoma and after axotomy occurs by apoptosis. Invest. Ophthalmol. Vis. Sci. 1995;36:774–786. - PubMed
Publication types
MeSH terms
Grants and funding
LinkOut - more resources
Full Text Sources
Medical
