

Rho-GTPase pathways may differentiate treatment response to TNF-alpha and IL-17A inhibitors in psoriatic arthritis
- PMID: 33303908
- PMCID: PMC7728744
- DOI: 10.1038/s41598-020-78866-2
Rho-GTPase pathways may differentiate treatment response to TNF-alpha and IL-17A inhibitors in psoriatic arthritis
Abstract
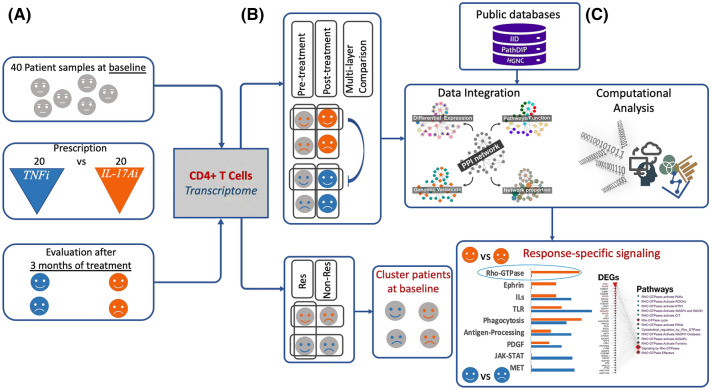
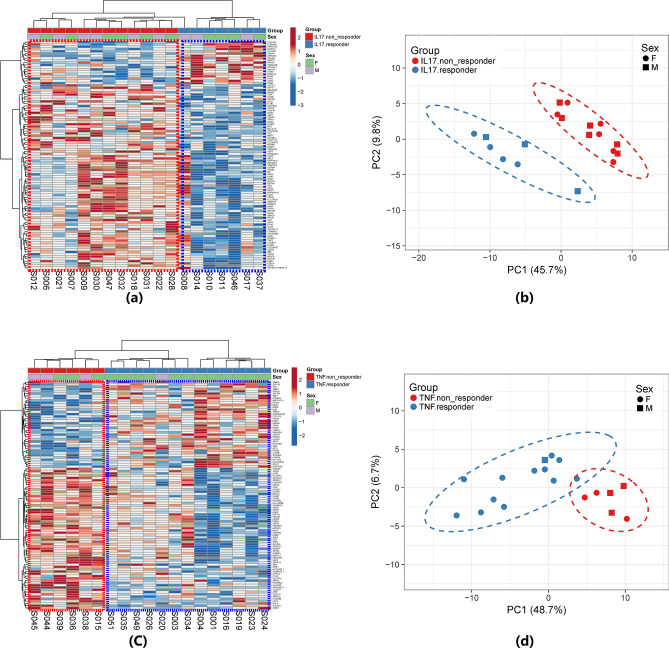
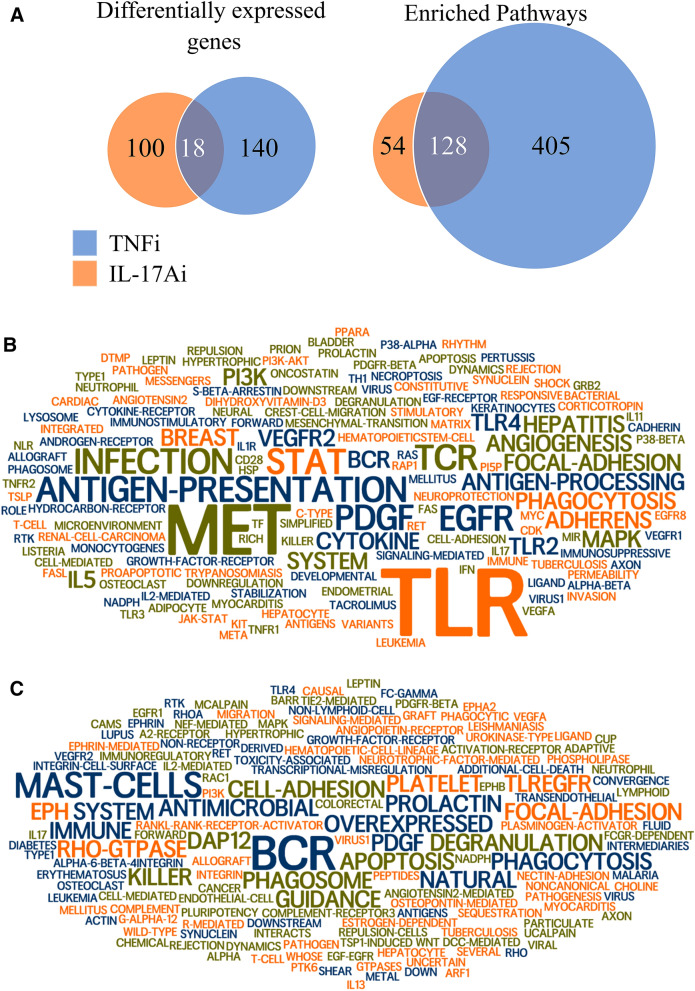
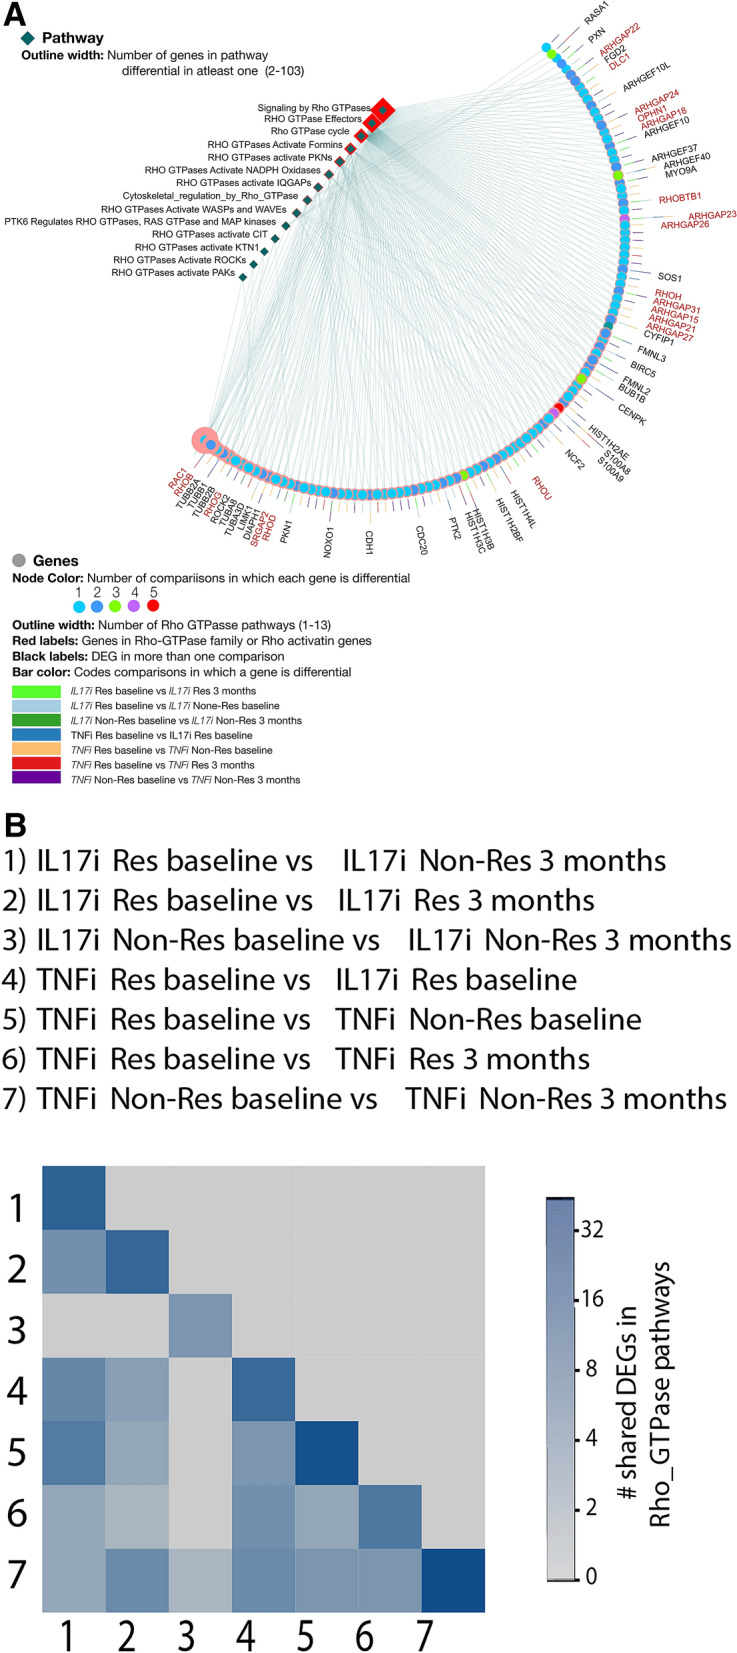
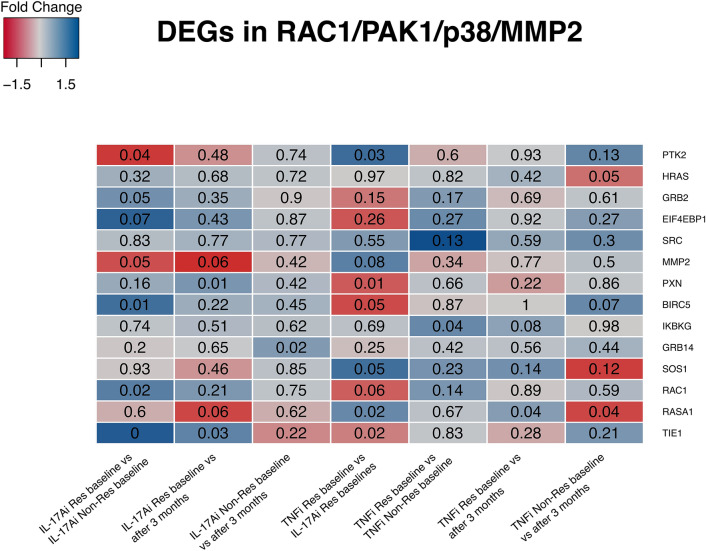
Biological therapies have dramatically improved the therapeutic landscape of psoriatic arthritis (PsA); however, 40-50% of patients are primary non-responders with response rates declining significantly with each successive biological therapy. Therefore, there is a pressing need to develop a coherent strategy for effective initial and subsequent selection of biologic agents. We interrogated 40 PsA patients initiating either tumour necrosis factor inhibitors (TNFi) or interleukin-17A inhibitors (17Ai) for active PsA. Patients achieving low disease activity according to the Disease Activity Index for PsA (DAPSA) at 3 months were classified as responders. Baseline and 3-month CD4+ transcript profiling were performed, and novel signaling pathways were identified using a multi-omics profiling and integrative computational analysis approach. Using transcriptomic data at initiation of therapy, we identified over 100 differentially expressed genes (DEGs) that differentiated IL-17Ai response from non-response and TNFi response from non-response. Integration of cell-type-specific DEGs with protein-protein interactions and further comprehensive pathway enrichment analysis revealed several pathways. Rho GTPase signaling pathway exhibited a strong signal specific to IL-17Ai response and the genes, RAC1 and ROCKs, are supported by results from prior research. Our detailed network and pathway analyses have identified the rewiring of Rho GTPase pathways as potential markers of response to IL17Ai but not TNFi. These results need further verification.
Conflict of interest statement
DG: Grants and/or consulting fees from Abbvie, Amgen, BMS, Eli Lilly, Galapagos, Gilead, Janssen, Novartis, Pfizer, UCB; VC: Advisory board- Abbvie, Amgen, BMS, Celgene, Eli Lilly, Janssen, Novartis, Pfizer, UCB; Research grants- Abbvie, Celgene; Spousal employment- Eli Lilly; PR: Advisory board- Abbvie, Amgen, BMS, Celgene, Eli Lilly, Janssen, Merck, Novartis, Pfizer, UCB; Research grants- Janssen, Novartis.
Figures
Similar articles
-
Effect of interleukin-17A inhibitor in Japanese patients with psoriatic arthritis compared with tumor necrosis factor-alpha inhibitor.J Orthop Surg (Hong Kong). 2021 May-Aug;29(2):23094990211012286. doi: 10.1177/23094990211012286. J Orthop Surg (Hong Kong). 2021. PMID: 33938296
-
Modulation of Interleukin-23 Signaling With Guselkumab in Biologic-Naive Patients Versus Tumor Necrosis Factor Inhibitor-Inadequate Responders With Active Psoriatic Arthritis.Arthritis Rheumatol. 2024 Jun;76(6):894-904. doi: 10.1002/art.42803. Epub 2024 Mar 4. Arthritis Rheumatol. 2024. PMID: 38253404 Clinical Trial.
-
Soluble biomarkers associated with response to treatment with tumor necrosis factor inhibitors in psoriatic arthritis.J Rheumatol. 2013 Jun;40(6):866-71. doi: 10.3899/jrheum.121162. Epub 2013 May 1. J Rheumatol. 2013. PMID: 23637322
-
Novel approaches to biological therapy for psoriatic arthritis.Expert Opin Biol Ther. 2016;16(2):173-86. doi: 10.1517/14712598.2016.1118045. Epub 2015 Dec 17. Expert Opin Biol Ther. 2016. PMID: 26572089 Review.
-
Tumor necrosis factor inhibitors in psoriatic arthritis.Expert Rev Clin Pharmacol. 2017 Aug;10(8):899-910. doi: 10.1080/17512433.2017.1329009. Epub 2017 May 22. Expert Rev Clin Pharmacol. 2017. PMID: 28490202 Free PMC article. Review.
Cited by
-
Precision medicine using molecular-target drugs in psoriatic arthritis.Ther Adv Musculoskelet Dis. 2025 Jan 5;17:1759720X241311462. doi: 10.1177/1759720X241311462. eCollection 2025. Ther Adv Musculoskelet Dis. 2025. PMID: 39776828 Free PMC article. Review.
-
Defining imaging sub-phenotypes of psoriatic arthritis: integrative analysis of imaging data and gene expression in a PsA patient cohort.Rheumatology (Oxford). 2022 Nov 28;61(12):4952-4961. doi: 10.1093/rheumatology/keac078. Rheumatology (Oxford). 2022. PMID: 35157043 Free PMC article.
-
Proteome and phospholipidome interrelationship of synovial fluid-derived extracellular vesicles in equine osteoarthritis: An exploratory 'multi-omics' study to identify composite biomarkers.Biochem Biophys Rep. 2024 Jan 18;37:101635. doi: 10.1016/j.bbrep.2023.101635. eCollection 2024 Mar. Biochem Biophys Rep. 2024. PMID: 38298208 Free PMC article.
-
Do genetics contribute to TNF inhibitor response prediction in Psoriatic Arthritis?Pharmacogenomics J. 2023 Jan;23(1):1-7. doi: 10.1038/s41397-022-00290-8. Epub 2022 Oct 15. Pharmacogenomics J. 2023. PMID: 36243888 Free PMC article. Review.
References
Publication types
MeSH terms
Substances
LinkOut - more resources
Full Text Sources
Medical
Research Materials
Miscellaneous
