

Enzalutamide response in a panel of prostate cancer cell lines reveals a role for glucocorticoid receptor in enzalutamide resistant disease
- PMID: 33303959
- PMCID: PMC7729982
- DOI: 10.1038/s41598-020-78798-x
Enzalutamide response in a panel of prostate cancer cell lines reveals a role for glucocorticoid receptor in enzalutamide resistant disease
Abstract
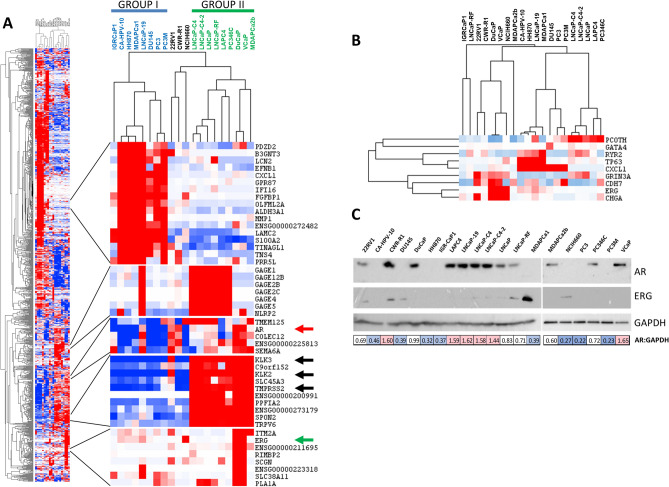
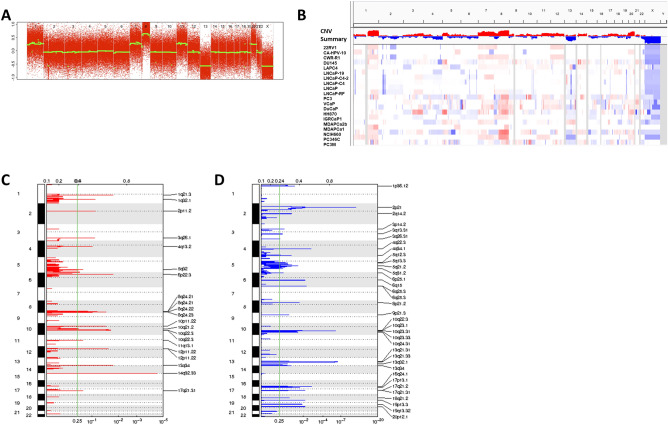
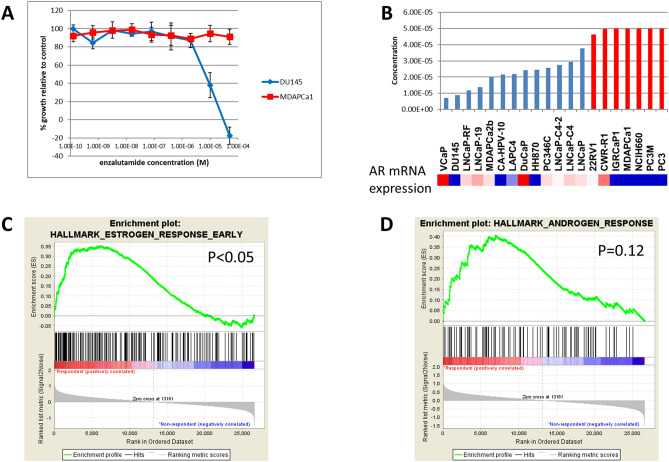
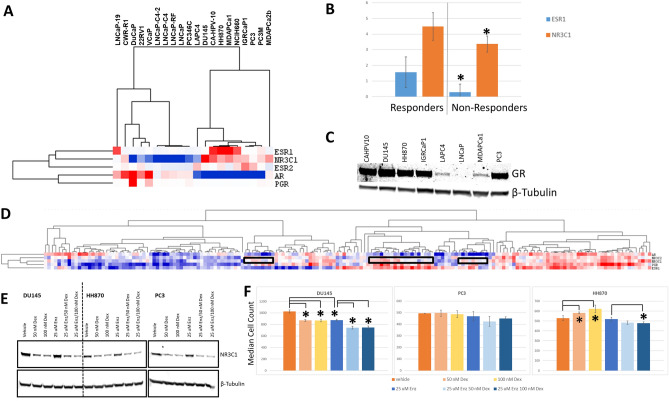
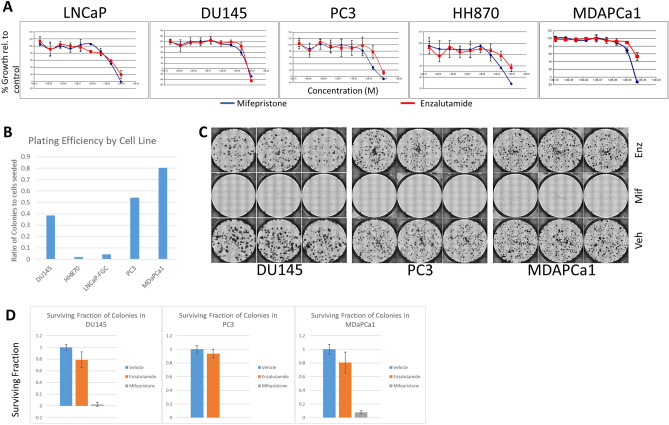
Representative in vitro model systems that accurately model response to therapy and allow the identification of new targets are important for improving our treatment of prostate cancer. Here we describe molecular characterization and drug testing in a panel of 20 prostate cancer cell lines. The cell lines cluster into distinct subsets based on RNA expression, which is largely driven by functional Androgen Receptor (AR) expression. KLK3, the AR-responsive gene that encodes prostate specific antigen, shows the greatest variability in expression across the cell line panel. Other common prostate cancer associated genes such as TMPRSS2 and ERG show similar expression patterns. Copy number analysis demonstrates that many of the most commonly gained (including regions containing TERC and MYC) and lost regions (including regions containing TP53 and PTEN) that were identified in patient samples by the TCGA are mirrored in the prostate cancer cell lines. Assessment of response to the anti-androgen enzalutamide shows a distinct separation of responders and non-responders, predominantly related to status of wild-type AR. Surprisingly, several AR-null lines responded to enzalutamide. These AR-null, enzalutamide-responsive cells were characterized by high levels of expression of glucocorticoid receptor (GR) encoded by NR3C1. Treatment of these cells with the anti-GR agent mifepristone showed that they were more sensitive to this drug than enzalutamide, as were several of the enzalutamide non-responsive lines. This is consistent with several recent reports that suggest that GR expression is an alternative signaling mechanism that can bypass AR blockade. This study reinforces the utility of large cell line panels for the study of cancer and identifies several cell lines that represent ideal models to study AR-null cells that have upregulated GR to sustain growth.
Conflict of interest statement
JA has received consulting or advisory role or speaker’s fees from Merck Sharp & Dohme, Dendreon, Astellas. JA has received institutional research funding from Aragon Pharmaceuticals, Astellas Pharma, Zenith Epigenetics, and Gilead Sciences. The other authors declare no competing interests.
Figures
Similar articles
-
Glucocorticoid receptor activity contributes to resistance to androgen-targeted therapy in prostate cancer.Horm Cancer. 2014 Apr;5(2):72-89. doi: 10.1007/s12672-014-0173-2. Epub 2014 Mar 11. Horm Cancer. 2014. PMID: 24615402 Free PMC article.
-
A TBX2-driven signaling switch from androgen receptor to glucocorticoid receptor confers therapeutic resistance in prostate cancer.Oncogene. 2025 Apr;44(13):877-892. doi: 10.1038/s41388-024-03252-5. Epub 2024 Dec 20. Oncogene. 2025. PMID: 39702503 Free PMC article.
-
TLE3 loss confers AR inhibitor resistance by facilitating GR-mediated human prostate cancer cell growth.Elife. 2019 Dec 19;8:e47430. doi: 10.7554/eLife.47430. Elife. 2019. PMID: 31855178 Free PMC article.
-
Current uses and resistance mechanisms of enzalutamide in prostate cancer treatment.Expert Rev Anticancer Ther. 2024 Nov;24(11):1085-1100. doi: 10.1080/14737140.2024.2405103. Epub 2024 Sep 20. Expert Rev Anticancer Ther. 2024. PMID: 39275993 Review.
-
Androgen receptor splice variants in the era of enzalutamide and abiraterone.Horm Cancer. 2014 Oct;5(5):265-73. doi: 10.1007/s12672-014-0190-1. Epub 2014 Jul 22. Horm Cancer. 2014. PMID: 25048254 Free PMC article. Review.
Cited by
-
Identification of PRDX5 as A Target for The Treatment of Castration-Resistant Prostate Cancer.Adv Sci (Weinh). 2024 Mar;11(9):e2304939. doi: 10.1002/advs.202304939. Epub 2023 Dec 20. Adv Sci (Weinh). 2024. PMID: 38115765 Free PMC article.
-
Abiraterone In Vitro Is Superior to Enzalutamide in Response to Ionizing Radiation.Front Oncol. 2021 Jul 21;11:700543. doi: 10.3389/fonc.2021.700543. eCollection 2021. Front Oncol. 2021. PMID: 34367984 Free PMC article.
-
WTAP-mediated m6A modification promotes drug sensitivity by regulating NR3C1 in prostate cancer.Sci China Life Sci. 2025 Jul 8. doi: 10.1007/s11427-024-2776-3. Online ahead of print. Sci China Life Sci. 2025. PMID: 40650812
-
The impact of androgen-induced translation in modulating androgen receptor activity.Biol Direct. 2024 Nov 11;19(1):111. doi: 10.1186/s13062-024-00550-6. Biol Direct. 2024. PMID: 39529201 Free PMC article.
-
Gαi2 Protein Inhibition Blocks Chemotherapy- and Anti-Androgen-Induced Prostate Cancer Cell Migration.Cancers (Basel). 2024 Jan 10;16(2):296. doi: 10.3390/cancers16020296. Cancers (Basel). 2024. PMID: 38254786 Free PMC article.
References
-
- Huggins C, Hodges CV. Studies on prostatic cancer. I. The effect of castration, of estrogen and of androgen injection on serum phosphatases in metastatic carcinoma of the prostate. Cancer Res. 1941;1:293–297. - PubMed
Publication types
MeSH terms
Substances
LinkOut - more resources
Full Text Sources
Other Literature Sources
Medical
Research Materials
Miscellaneous
