. 2020 Dec 10;3(1):754.
doi: 10.1038/s42003-020-01496-x.

Somatostatin expressing GABAergic interneurons in the medial entorhinal cortex preferentially inhibit layerIII-V pyramidal cells

Affiliations

Somatostatin expressing GABAergic interneurons in the medial entorhinal cortex preferentially inhibit layerIII-V pyramidal cells

Miklós Kecskés et al. Commun Biol. .

Abstract

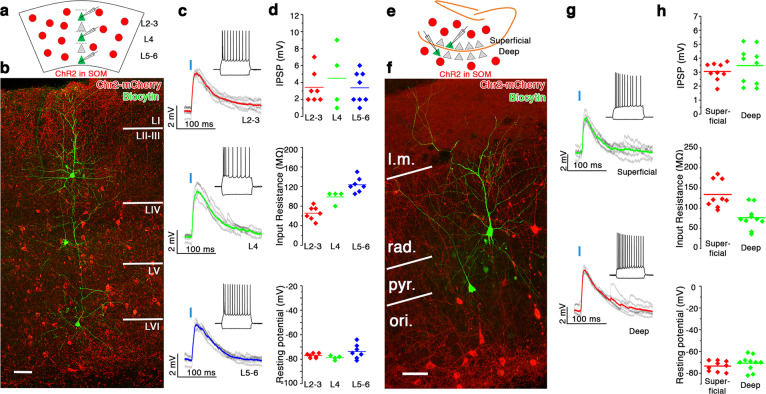
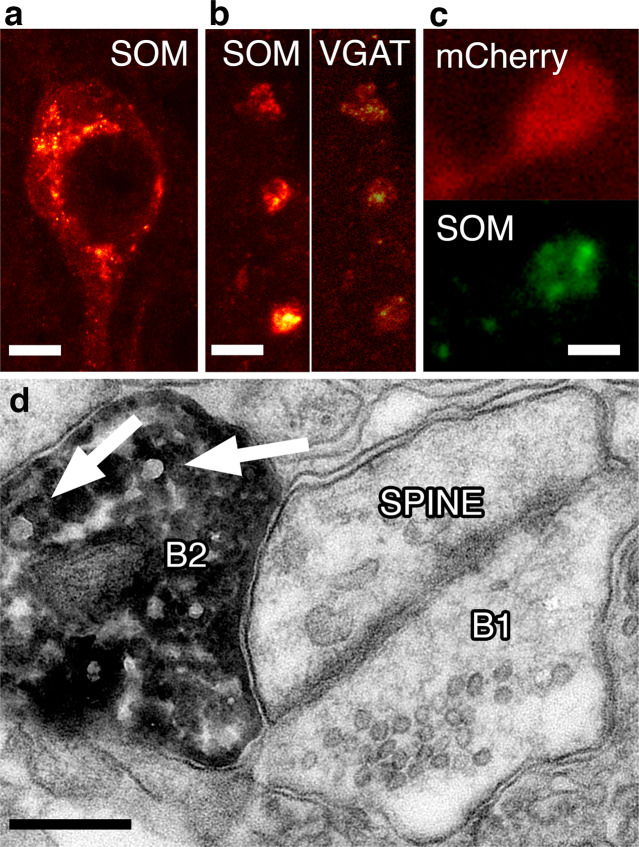
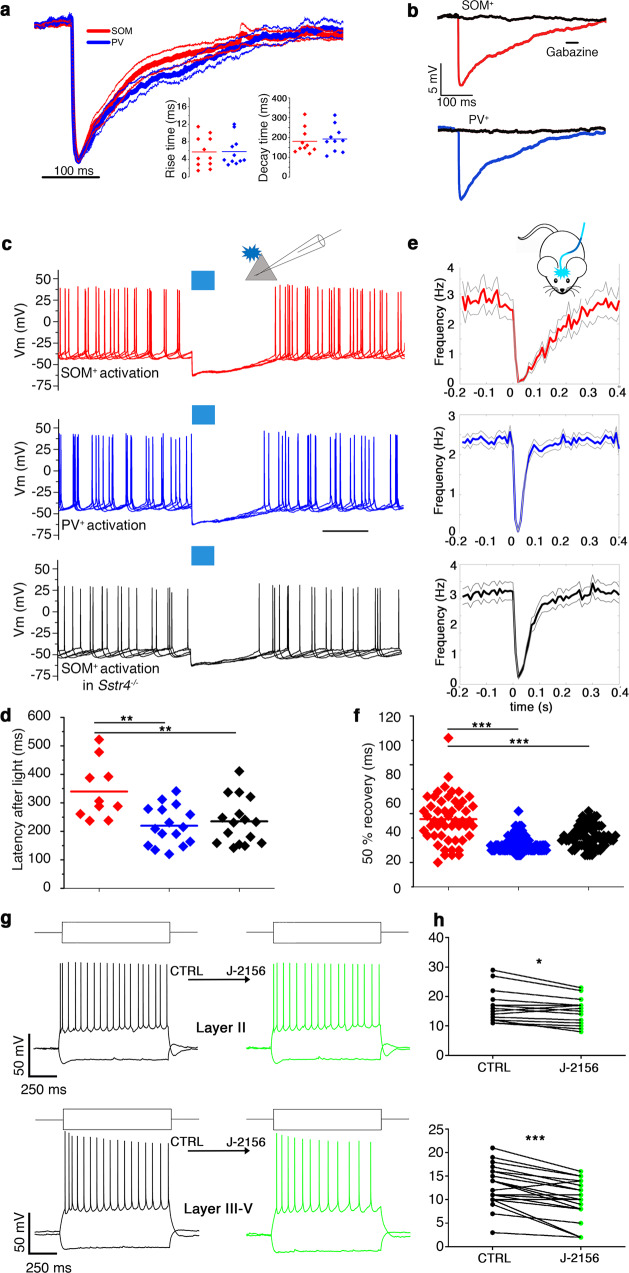
GABA released from heterogeneous types of interneurons acts in a complex spatio-temporal manner on postsynaptic targets in the networks. In addition to GABA, a large fraction of GABAergic cells also express neuromodulator peptides. Somatostatin (SOM) containing interneurons, in particular, have been recognized as key players in several brain circuits, however, the action of SOM and its downstream network effects remain largely unknown. Here, we used optogenetics, electrophysiologic, anatomical and behavioral experiments to reveal that the dendrite-targeting, SOM+ GABAergic interneurons demonstrate a unique layer-specific action in the medial entorhinal cortex (MEC) both in terms of GABAergic and SOM-related properties. We show that GABAergic and somatostatinergic neurotransmission originating from SOM+ local interneurons preferentially inhibit layerIII-V pyramidal cells, known to be involved in memory formation. We propose that this dendritic GABA-SOM dual inhibitory network motif within the MEC serves to selectively modulate working-memory formation without affecting the retrieval of already learned spatial navigation tasks.


Conflict of interest statement

The authors declare no competing interests.

Figures

Fig. 1
Fig. 1. SOM+ local interneurons are strongly biased to innervate layerIII–V pyramidal cells in the MEC.
a, b Left: low-magnification image of the horizontally sectioned temporal cortex of a SOM-Cre (a) and a PV-Cre (b) mouse showing Cre-dependent local ChR2 expression in the MEC. LEC lateral entorhinal cortex, SUB subiculum, DG dentate gyrus. Right: high-magnification image of ChR2-mCherry (green), SOM (red), and PV (blue) immunoreactive cells in the two Cre animals (scale bars: 250 and 10 μm). c, d Reconstructions of ChR2-expressing interneurons in the MEC of SOM-Cre (c) and PV-Cre (d) mice and the responses of the recorded cells to 1 s current injection (−200 and +200 pA) and to 3 ms (blue bar) photo-stimulation. Insets: confocal images of the biocytin-(Bio, green) filled interneurons showing the expression of Chr2-mCherry (red) (scale bars: 100 and 10 μm). e, h Confocal images of biocytin-filled layerII stellate (LIIstell), layerII pyramidal (LIIpyr), layerIII (LIII), and layerV (LV) cells and the surrounding ChR2-mCherry-positive axons (red) in the MEC of SOM-Cre (e) and PV-Cre (h) mice (scale bars: 50 µm). f, i Whole-cell postsynaptic voltage response of the layerII stellate (green), layerII pyramidal (red), layerIII (blue), and layerV (black) pyramidal cells, shown in e and h, to photo-stimulation of ChR2+ interneurons (five superimposed consecutive traces in gray, averages in color) in SOM-Cre (f) and PV-Cre (i) mice, respectively. g, j Plots of the recorded events (IPSP, mV) in layerII stellate, layerII pyramidal, layerIII, and layerV pyramidal cells in SOM-Cre (g) and in PV-Cre (j) animals.
Fig. 2
Fig. 2. Pyramidal cells in different layers are equally innervated by SOM+ interneurons in the somatosensory cortex and in the hippocampal CA1 region.
a Schematic of the experimental configuration in the somatosensory cortex: brief (3 ms) whole-field photo-stimulation of ChR2-expressing SOM+ cells (red circles) and simultaneous recordings from neighboring pyramidal cells from several layers. b Overview image of three recorded and biocytin-filled pyramidal cells in layerIII, layerIV, and layerVI (green) in SOM-ChR2 (red) expressing somatosensory cortex (coronal section). c Light-evoked (blue lines represent time of illumination) postsynaptic potential changes in the three recorded cells. Colored lines are the averages of individual (gray) events. Insets: responses to hyperpolarizing and depolarizing current steps of the recorded cells. d Postsynaptic potential (IPSP, top), input resistance (middle), and resting membrane potentials (bottom) of the layerII–III (red), layerIV (green), and layerV–VI (blue) cells. e Schematic figure of the experimental configuration in the hippocampal CA1 region. f One superficial (top right) and one deep pyramidal cell (bottom left, green) surrounded by ChR2-mCherry-expressing cells in SOM-ChR2 animal (coronal section). l.m. lacunosum moleculare, rad. stratum radiatum, pyr. stratum pyramidale, ori. stratum oriens. g Postsynaptic responses of the two recorded cells to 3 ms photo-stimulations. Colored lines are the averages; gray lines are the individual events. Insets: responses to hyperpolarizing and depolarizing current steps of the recorded cells. h Postsynaptic potential (top), input resistance (middle), and resting membrane potentials (bottom) of the superficial (red) and deep (green) pyramidal cells. Note that the intracellular solution contained 40 mM CsCl solution, producing depolarizing effect of GABAA receptor opening. L.m. stratum lacunosum moleculare, rad stratum radiatum, pyr stratum pyramidale, ori stratum oriens. Scale bars: 50 μm.
Fig. 3
Fig. 3. Prolonged SOM+ inhibition in the MEC in awake behaving mice.
Optogenetic modulation of MEC networks in vivo in PV-Cre-ChR2 (left column) and SOM-Cre-ChR2 (right column) animals. a Representative spike raster (top) and peri-stimulus histogram (PSTH, bottom) of light-responsive putative PV+ (left) and a SOM+ (right) interneuron aligned to the 10 ms light onset (0 s). Middle: schematic representation of experimental set-up. b Raster plot (top) and PSTH (middle) of representative light-inhibited putative pyramidal cells in PV-Cre (right) and SOM-Cre (left) animals. Bottom: average (solid line) and standard error of the mean (gray) of all inhibited putative pyramidal cells in PV-Cre (left) and SOM-Cre (right) animals. Note the quick return of firing in PV-Cre-ChR2 animals and the elongated inhibition in SOM-Cre-ChR2 animals. All traces aligned to light onset (0 s).
Fig. 4
Fig. 4. The SOM neuromodulator peptide is synthetized in the somatic region and packed into synaptic vesicles.
a STED image of SOM immunoreactivity in a soma in the MEC. Note the granular labeling of putative endoplasmatic reticulum surrounding the empty nucleus. Scale: 2 μm. b SOM (left) and VGAT immunoreactivity detected with STED microscopy within the same synaptic boutons in MEC. Scale: 1 μm. c STED images of a Cre-dependent mCherry/ChR2-expressing bouton in the MEC of a SOM-Cre animal (top, red). SOM immunoreactivity in the same bouton shows granular, putative synaptic vesicle localization (bottom, green). Scale: 0.5 μm. d Electron microscopic image of a spine in layerII of the MEC innervated by two different type of boutons. B1 is a putative excitatory bouton with similar-sized synaptic vesicles. B2 is a bouton of mCherry/ChR2 (DAB precipitate) expressing SOM+ interneuron. Note the larger-sized synaptic vesicles (arrows) occurring among the normal-sized vesicles. Scale: 200 nm.
Fig. 5
Fig. 5. Prolonged inhibition in layerIII–V pyramidal cells is mediated by the neuromodulator peptide SOM.
a Decay and rise times similarities of PSPs elicited by PV+ and SOM+ interneurons indicate classical fast GABAA receptor-mediated inhibition. The averages (thick lines) and S.E.M. (thin lines) of PSPs after short (3 ms) light pulses in PV-ChR2 (blue) and SOM-ChR2 (red) MEC. LayerIII–V pyramidal cells held at resting membrane potentials. Inset: rise and decay times of individual pyramidal cells in PV-ChR2 (blue) and SOM-ChR2 (red) animals. b Both in SOM-ChR2 and PV-ChR2 animals, the PSPs (red, blue lines, respectively) can be completely eliminated by gabazine (black traces). c Action potentials (elicited by depolarization) in layerIII–V pyramidal cells are stopped by 100 ms light pulse for different time in SOM-ChR2 (red), PV-ChR2 (blue), and SOM-ChR2+/SST4 KO (black) animals. d Statistic showing MEC deep principal cells firing latencies (as shown in c) after optogenetic stimulation of SOM-ChR2 (red), PV-ChR2 (blue), and SOM-ChR2+/SST4 KO (black) animals. e Population averages of the light-inhibited pyramidal cells in in vivo awake mice. Note that plots for SOM+ (red) and PV+ (blue) are same as in Fig. 3b for comparison with SST4 KO animals (black). f Statistics showing 50% recovery times of firing after light-induced inhibition in SOM+ (red), PV+ (blue), and SST4 KO (black) animals. g Representative voltage responses of MEC layerII (up) and deep layer (bottom) principal cell upon step current injections (150 and −200 pA) under control conditions (left) and after bath application of 1 µM J-2156 (right, green). h Firing frequencies of MEC layerII (up) and deep layer (bottom) principal cells upon current injections under control and J-2156-treated conditions. *p < 0.05, **p < 0.01, ***p < 0.001, paired Student’s T test for in vitro and Wilcoxon rank-sum test for in vivo experiments.
Fig. 6
Fig. 6. The inhibition of deep layer cells by SOM+ GABAergic interneurons regulates short-term memory formation without influencing spatial navigation.
a Schematic indicating the design of the Y-maze experiment combined with optogenetic stimulation of SOM+ cells in the MEC. Light was illuminated into the MEC during exploration, when animal was in the center area (gray). Alternation was considered correct, when after two entries (e.g., arms #1, #2) the animal entered the unvisited (#3) arm. b Correct spontaneous alternations of ChR2-expressing SOM-Cre (left), EGFP-expressing SOM-Cre (middle), and ChR2-expressing PV-Cre animals (right) during control (CTRL) and during ChR2 exciting light (ON) (*p < 0.05, paired Student’s T test). c Schematic representing the Morris water-maze experiments. Light pulses exciting ChR2+ SOM cells were applied while the animal was finding the hidden platform on the last day (day 6) of the trainings. d Escape latencies of ChR2-expressing SOM-Cre (left), EGFP-expressing SOM-Cre (middle), and ChR2-expressing PV-Cre animals (right) during control (CTRL) and during light pulses (ON). e Schematic summarizing the network motif revealed in the present study. LayerII pyramidal (black, left), layerII stellate (black, right), layerIII–V pyramidal (black, bottom), PV+ interneuron (PV, blue), and SOM+ interneuron (SOM, red). Thicker axons represent stronger inhibition on the targeted cells.

References

    1. Klausberger T, et al. Brain-state- and cell-type-specific firing of hippocampal interneurons in vivo. Nature. 2003;421:844–848. doi: 10.1038/nature01374. - DOI - PubMed
    1. Royer S, et al. Control of timing, rate and bursts of hippocampal place cells by dendritic and somatic inhibition. Nat. Neurosci. 2012;15:769–775. doi: 10.1038/nn.3077. - DOI - PMC - PubMed
    1. Rudy B, Fishell G, Lee S, Hjerling-Leffler J. Three groups of interneurons account for nearly 100% of neocortical GABAergic neurons. Dev. Neurobiol. 2011;71:45–61. doi: 10.1002/dneu.20853. - DOI - PMC - PubMed
    1. Lovett-Barron M, et al. Regulation of neuronal input transformations by tunable dendritic inhibition. Nat. Neurosci. 2012;15:423–430. doi: 10.1038/nn.3024. - DOI - PubMed
    1. Adler A, Zhao R, Shin ME, Yasuda R, Gan W-B. Somatostatin-expressing interneurons enable and maintain learning-dependent sequential activation of pyramidal neurons. Neuron. 2019;102:202.e7–216.e7. doi: 10.1016/j.neuron.2019.01.036. - DOI - PMC - PubMed

Publication types

LinkOut - more resources