. 2021 Sep;42(9):1437-1448.
doi: 10.1038/s41401-020-00569-1. Epub 2020 Dec 10.

The vascular endothelial growth factor trap aflibercept induces vascular dysfunction and hypertension via attenuation of eNOS/NO signaling in mice

Affiliations

The vascular endothelial growth factor trap aflibercept induces vascular dysfunction and hypertension via attenuation of eNOS/NO signaling in mice

Zhi-Chao Dong et al. Acta Pharmacol Sin. 2021 Sep.

Abstract

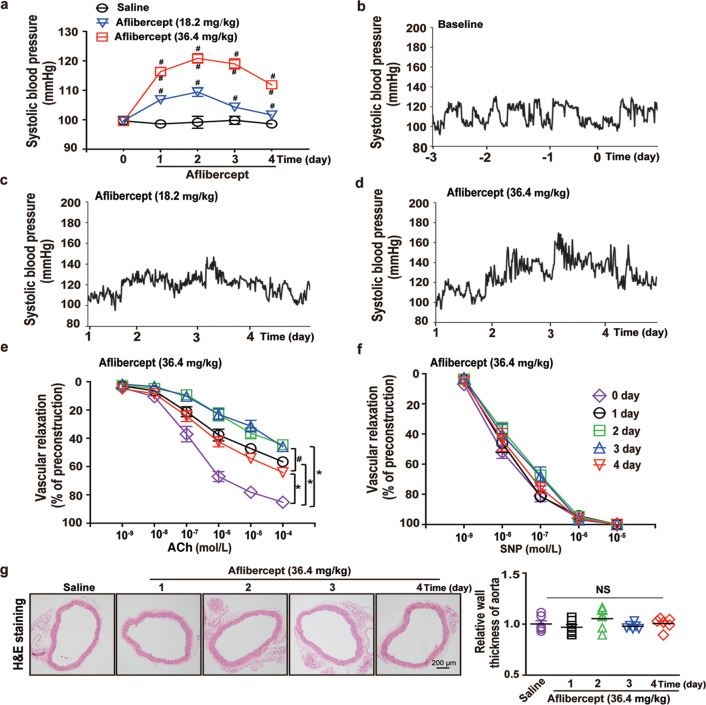
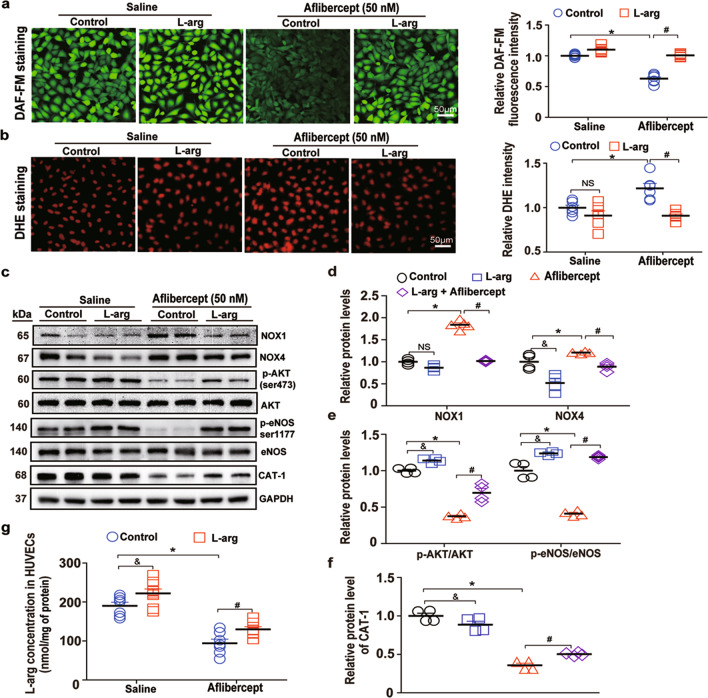
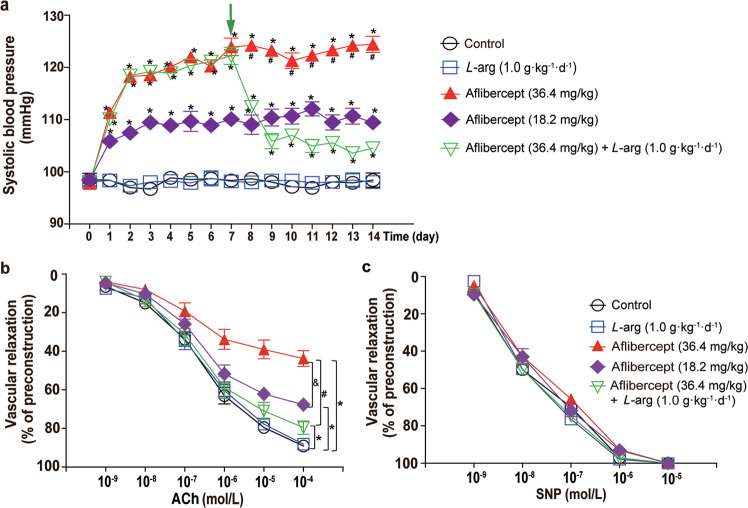
Aflibercept, as a soluble decoy vascular endothelial growth factor receptor, Which has been used as a first-line monotherapy for cancers. Aflibercept often causes cardiovascular toxicities including hypertension, but the mechanisms underlying aflibercept-induced hypertension remain unknown. In this study we investigated the effect of short-term and long-term administration of aflibercept on blood pressure (BP), vascular function, NO bioavailability, oxidative stress and endothelin 1 (ET-1) in mice and cultured endothelial cells. We showed that injection of a single-dose of aflibercept (18.2, 36.4 mg/kg, iv) rapidly and dose-dependently elevated BP in mice. Aflibercept treatment markedly impaired endothelial-dependent relaxation (EDR) and resulted in NADPH oxidases 1 (NOX1)- and NADPH oxidases 4 (NOX4)-mediated generation of ROS, decreased the activation of protein kinase B (Akt) and endothelial nitric oxide synthase (eNOS) concurrently with a reduction in nitric oxide (NO) production and elevation of ET-1 levels in mouse aortas; these effects were greatly attenuated by supplementation of L-arginine (L-arg, 0.5 or 1.0 g/kg, bid, ig) before aflibercept injection. Similar results were observed in L-arg-pretreated cultured endothelial cells, showing markedly decreased ROS accumulation and AKT/eNOS/NO signaling impairment induced by aflibercept. In order to assess the effects of long-term aflibercept on hypertension and to evaluate the beneficial effects of L-arg supplementation, we administered these two drugs to WT mice for up to 14 days (at an interval of two days). Long-term administration of aflibercept resulted in a sustained increase in BP and a severely impaired EDR, which are associated with NOX1/NOX4-mediated production of ROS, increase in ET-1, inhibition of AKT/eNOS/NO signaling and a decreased expression of cationic amino acid transporter (CAT-1). The effects caused by long-term administration were greatly attenuated by L-arg supplementation in a dose-dependent manner. We conclude that aflibercept leads to vascular dysfunction and hypertension by inhibiting CAT-1/AKT/eNOS/NO signaling, increasing ET-1, and activating NOX1/NOX4-mediated oxidative stress, which can be suppressed by supplementation of L-arg. Therefore, L-arg could be a potential therapeutic agent for aflibercept-induced hypertension.

Keywords: L-arginine; cultured endothelial cells; aflibercept; endothelial dysfunction; hypertension; superoxide production; endothelin 1; cationic amino acid transporter-1.


Conflict of interest statement

The authors declare no competing interests.

Figures

Fig. 1
Fig. 1. A single dose of aflibercept leads to an acute increase in SBP and impairment of vascular function.
a SBP was measured by the noninvasive tail-cuff method before and after treatment with a single dose of saline or aflibercept (n = 8; *P < 0.05 versus the saline group; #P < 0.05 versus the low-dose aflibercept group). bd Representative SBP recordings from WT mice 3 days before aflibercept treatment as a baseline (b) and 1–4 days after infusion of a single dose of aflibercept at 18.4 mg/kg (c) or 36.4 mg/kg (d) using radiotelemetric BP measurements (n = 6). e, f Dose-response curves for endothelium-dependent (e) and endothelium-independent relaxation (f) at different times (1–4 days) after treatment with 36.4 mg/kg aflibercept (n = 8; *P < 0.05 versus the saline group; #P < 0.05 versus the 4th day after aflibercept treatment group). g Representative images of H&E staining of thoracic aortas. Wall thickness in each group (n = 6). The data are presented as the mean ± SEM; n represents the number of samples or mice; NS no significant difference; SBP systolic blood pressure; ACh acetylcholine; SNP sodium nitroprusside.
Fig. 2
Fig. 2. A single dose of aflibercept results in NOX1/NOX4-mediated ROS accumulation and impairs AKT/eNOS/NO signaling.
a Representative images of DHE staining of aortic segments after injection of a single dose of 36.4 mg/kg aflibercept, and DHE fluorescence intensity from the data representing ROS levels on days 1–4 after aflibercept injection (n = 5; scale bar; 50 μm; *P < 0.05 versus the saline group). b Nitrotyrosine was assessed as an index of peroxynitrite (ONOO) formation in aorta (n = 7–8; *P < 0.05 versus saline group). c Immunoblotting analysis of NOX1 and NOX4 protein expression in the aorta before and after injection of 36.4 mg/kg aflibercept and protein abundance from the experiments was shown (n = 4; *P < 0.05 versus the saline group; #P < 0.05 versus the 3rd day after aflibercept treatment group). d, e Aflibercept significantly reduced NO levels in serum and aortic tissues (n = 6 or 7; *P < 0.05 versus the saline group; #P < 0.05 versus the 4th day after aflibercept treatment group). f Aflibercept significantly increased ET-1 levels in serum (n = 6 or 7; *P < 0.05 versus the saline group). g Representative immunoblots showing VEGFR1 and VEGFR2 protein expression in the aorta; Protein expression levels of VEGFR1 and VEGFR2 before and after aflibercept injection (n = 4). h Representative immunoblots showing p-AKT (Ser473), AKT, p-eNOS (Ser1177), and eNOS expression in the aorta, and quantification of protein levels from the data were shown (n = 4; *P < 0.05 versus the saline group; #P < 0.05 versus the 3rd day after aflibercept treatment group). The data are presented as the mean ± SEM; n represents number of samples or mice; NS no significant difference; Akt protein kinase B; p-Akt phosphorylated Akt; eNOS endothelial nitric oxide synthase; p-eNOS phosphorylated eNOS.
Fig. 3
Fig. 3. L-arg supplementation prevents hypertension, impairment of EDR, ROS accumulation, and reduction in NO production induced by a single dose of aflibercept.
a SBP was measured by the noninvasive tail-cuff method in mice treated with saline or L-arg (0.5 or 1.0 g· kg−1 ·d−1) before and after injection of a single dose of 36.4 mg/kg aflibercept (n = 6; *P < 0.05 versus the saline group; #P < 0.05 versus the low-dose L-arg group). b Following injection of a single dose of aflibercept, NO levels in the aortic tissues were measured using a nitric oxide assay kit in the presence or absence of L-arg (1.0 g· kg−1· d−1) on days 1 and 3 (n = 6; *P < 0.05 versus the saline group; #P < 0.05 versus the L-arg group; &P < 0.05 versus the 1st day after aflibercept + L-arg treatment group; $P < 0.05 versus the 3rd day after aflibercept + L-arg treatment group). c, d Dose-response curves for endothelium-dependent (c) and endothelium-independent relaxation (d) were constructed on days 1 and 3 after 36.4 mg/kg aflibercept injection in the presence or absence of L-arg (1.0 g· kg−1 ·d−1) (n = 7 or 8; *P < 0.05 versus the saline group). e, f Representative images of DHE staining of aortic segments (e) and DHE fluorescence intensity data demonstrating that aflibercept-induced ROS accumulation was reversed by L-arg (f) (n = 5; *P < 0.05 versus the saline group; #P < 0.05 versus the L-arg group; &P < 0.05 versus the 1st day after aflibercept + L-arg treatment group; $P < 0.05 versus the 3rd day after aflibercept + L-arg treatment group). g ET-1 levels in aortic tissues were measured after administration of a single dose of aflibercept on days 1 and 3 in the absence or presence of L-arg (n = 6; *P < 0.05 versus the saline group; &P < 0.05 versus the 1st day after aflibercept + L-arg treatment group; $P < 0.05 versus the 3rd day after aflibercept + L-arg treatment group). The data are presented as the mean ± SEM; n represents the number of samples or mice; NS no significant difference.
Fig. 4
Fig. 4. L-arg prevents against aflibercept-induced ROS accumulation and impairment of AKT/eNOS/NO in cultured endothelial cells.
a Green fluorescence observed by confocal microscopy in cells preloaded with DAF-FM representing intracellular NO levels, and integrative fluorescence per image demonstrating that the aflibercept-induced reduction in NO levels was rescued by L-arg (n = 6; *P < 0.05 versus the saline group; #P < 0.05 versus the aflibercept group). b Representative DHE staining of HUVECs and DHE fluorescence intensity data demonstrating that aflibercept-induced ROS accumulation was reserved by L-arg in each group (n = 6; *P < 0.05 versus the saline group; #P < 0.05 versus the aflibercept group). cf Representative immunoblots showing NOX1, NOX4, p-AKT (Ser473), AKT, p-eNOS (Ser1177), eNOS, and CAT-1 expression in HUVECs (c) and quantification of protein expression levels from the data shown in (df) (n = 4; *P < 0.05 versus the saline group; &P < 0.05 versus the L-arg group; #P < 0.05 versus the aflibercept group). g The intracellular L-arg concentration in HUVECs was measured by the L-Arginine Assay Kit, and the data showed that the aflibercept-induced decrease in intracellular L-arg was greatly attenuated by extracellular L-arg supplementation (n = 6; *P < 0.05 versus the saline group; &P < 0.05 versus the L-arg group; #P < 0.05 versus the aflibercept group). The data are presented as the mean ± SEM; n represents the number of samples or mice.
Fig. 5
Fig. 5. Long-term application of aflibercept-induced hypertension and vascular dysfunction in mice.
a The SBP of each group was measured by the noninvasive tail-cuff method for up to 14 days; the data demonstrated that L-arg supplementation prevented the sustained increase in SBP induced by long-term aflibercept injection (n = 7 or 8; *P < 0.05 versus the saline group; #P < 0.05 versus the aflibercept + low-dose L-arg group; &P < 0.05 versus the Ang II group). bg Representative SBP recordings from radiotelemetric BP measurements from WT mice 3 days before aflibercept treatment as a baseline (b) and from those administered L-arg, aflibercept and L-arg + aflibercept showing the raw data generated on the last 3 days (cf), with Ang II (490 ng ·kg−1 ·min−1) (g) as a positive control (n = 6). h, i Dose-response curves for endothelium-dependent (h) and endothelium-independent relaxation (i) were constructed on day 14 after injection of 36.4 mg/kg aflibercept in the presence or absence of 0.5 or 1.0 g/kg L-arg (n = 7 or 8; *P < 0.05 versus the saline group; #P < 0.05 versus the aflibercept + low-dose L-arg group). The data are presented as the mean ± SEM; n represents the number of samples or mice.
Fig. 6
Fig. 6. L-arg ameliorates hypertension and vascular dysfunction induced by long-term application of aflibercept in mice.
a The SBP of each group was measured by the noninvasive tail-cuff method for up to 14 days; consistently, long-term high-dose application of aflibercept led to a sustained increase in SBP, and this dramatic aflibercept-induced increase in SBP was greatly inhibited by L-arg supplementation on day 7 (as indicated by the green arrowhead) (n = 7; *P < 0.05 versus the saline group; #P < 0.05 versus the low-dose aflibercept group). b, c Dose-response curves for endothelium-dependent (b) and endothelium-independent relaxation (c) were constructed on day 14 after injection of 36.4 mg/kg aflibercept in the presence of absence of 1.0 g/kg L-arg on 8–14 days (n = 7; *P < 0.05 versus the saline group; #P < 0.05 versus the aflibercept group; &P < 0.05 versus the low-dose aflibercept group). The data are presented as the mean ± SEM; n represents the number of samples or mice.
Fig. 7
Fig. 7. L-arg prevents oxidative stress and the reduction in eNOS/NO signaling induced by long-term application of aflibercept.
a Representative images of DHE staining of aortic segments after injection of a single dose of 36.4 mg/kg aflibercept in the presence or absence of L-arg and the fluorescence intensity data demonstrating that aflibercept-induced ROS accumulation was greatly attenuated by L-arg (n = 6; *P < 0.05 versus the saline group; #P < 0.05 versus the aflibercept + low-dose L-arg group; &P < 0.05 versus the aflibercept + high-dose L-arg group). b Representative immunoblots showing p-eNOS (Ser1177) and eNOS expression in aortic tissues and quantification of protein abundance demonstrating that the aflibercept-induced decrease in p-eNOS was ameliorated by L-arg (n = 4; *P < 0.05 versus the saline group; $P < 0.05 versus the L-arg group; #P < 0.05 versus the aflibercept + low-dose L-arg group; &P < 0.05 versus the aflibercept + high-dose L-arg group). c NO levels in aortic tissues were measured by the Nitric Oxide Assay Kit on day 14 in the absence or presence of L-arg following aflibercept injection (n = 6; *P < 0.05 versus the saline group; $P < 0.05 versus the L-arg group; #P < 0.05 versus the aflibercept + low-dose L-arg group; &P < 0.05 versus the aflibercept + high-dose L-arg group). df Representative images of H&E staining of thoracic aortas (d); Wall thickness data (e) and the percentage of the fibrotic area in each indicated group (n = 6) (f). The data are presented as the mean ± SEM; n represents number of samples or mice; NS no significant difference.

References

    1. Ferrara N, Adamis AP. Ten years of anti-vascular endothelial growth factor therapy. Nat Rev Drug Discov. 2016;15:385–403. doi: 10.1038/nrd.2015.17. - DOI - PubMed
    1. Holash J, Davis S, Papadopoulos N, Croll SD, Ho L, Russell M, et al. VEGF-Trap: a VEGF blocker with potent antitumor effects. Proc Natl Acad Sci USA. 2002;99:11393–8. doi: 10.1073/pnas.172398299. - DOI - PMC - PubMed
    1. Rudge JS, Holash J, Hylton D, Russell M, Jiang S, Leidich R, et al. VEGF Trap complex formation measures production rates of VEGF, providing a biomarker for predicting efficacious angiogenic blockade. Proc Natl Acad Sci USA. 2007;104:18363–70.. doi: 10.1073/pnas.0708865104. - DOI - PMC - PubMed
    1. Moslehi JJ. Cardiovascular toxic effects of targeted cancer therapies. N Engl J Med. 2016;375:1457–67.. doi: 10.1056/NEJMra1100265. - DOI - PubMed
    1. Hamnvik OP, Choueiri TK, Turchin A, McKay RR, Goyal L, Davis M, et al. Clinical risk factors for the development of hypertension in patients treated with inhibitors of the VEGF signaling pathway. Cancer. 2015;121:311–9. doi: 10.1002/cncr.28972. - DOI - PMC - PubMed

MeSH terms