

Indices of non-ignorable selection bias for proportions estimated from non-probability samples
- PMID: 33304001
- PMCID: PMC7724611
- DOI: 10.1111/rssc.12371
Indices of non-ignorable selection bias for proportions estimated from non-probability samples
Abstract
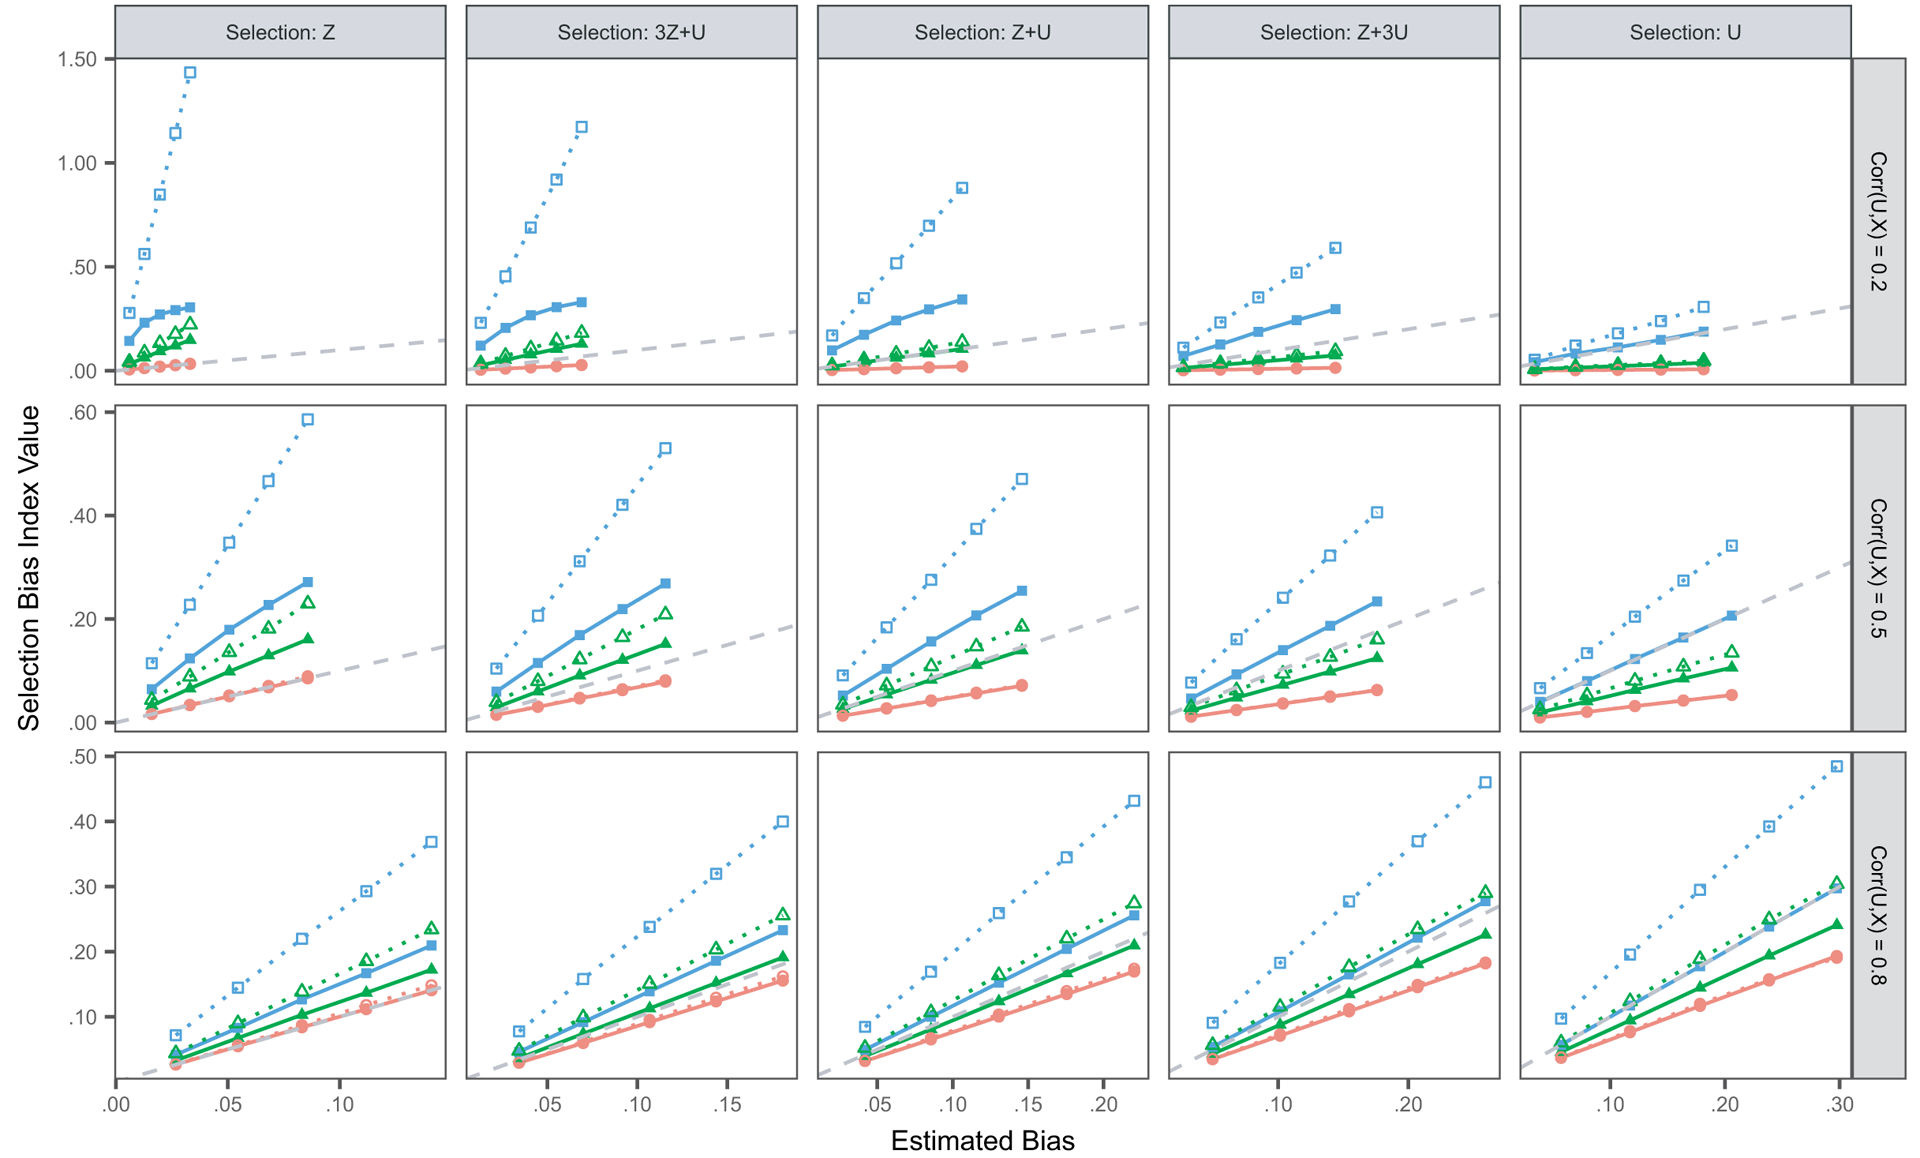
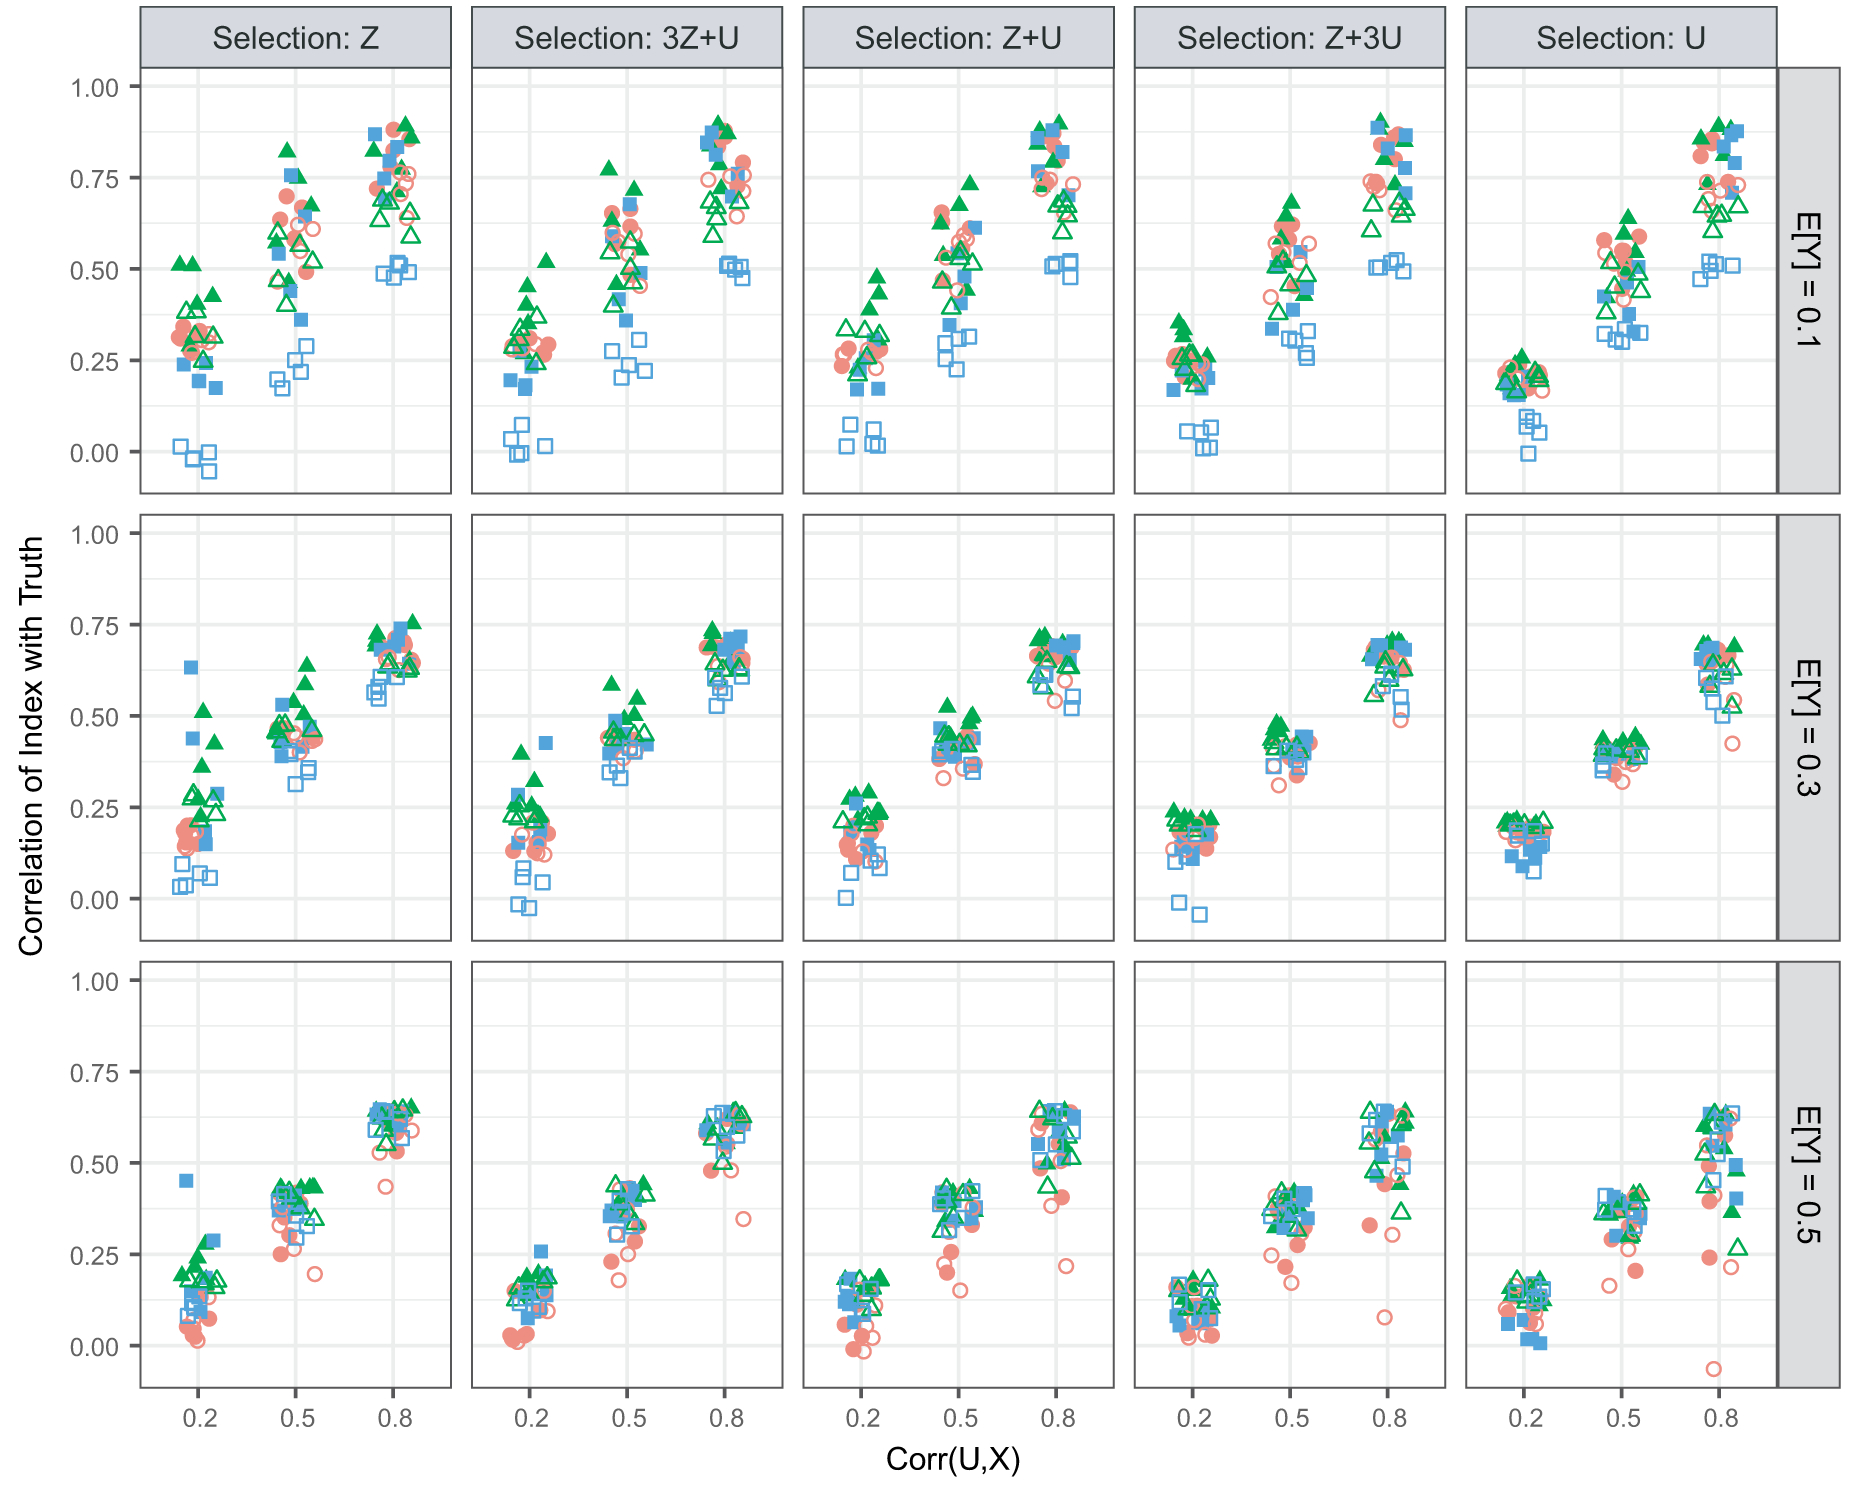
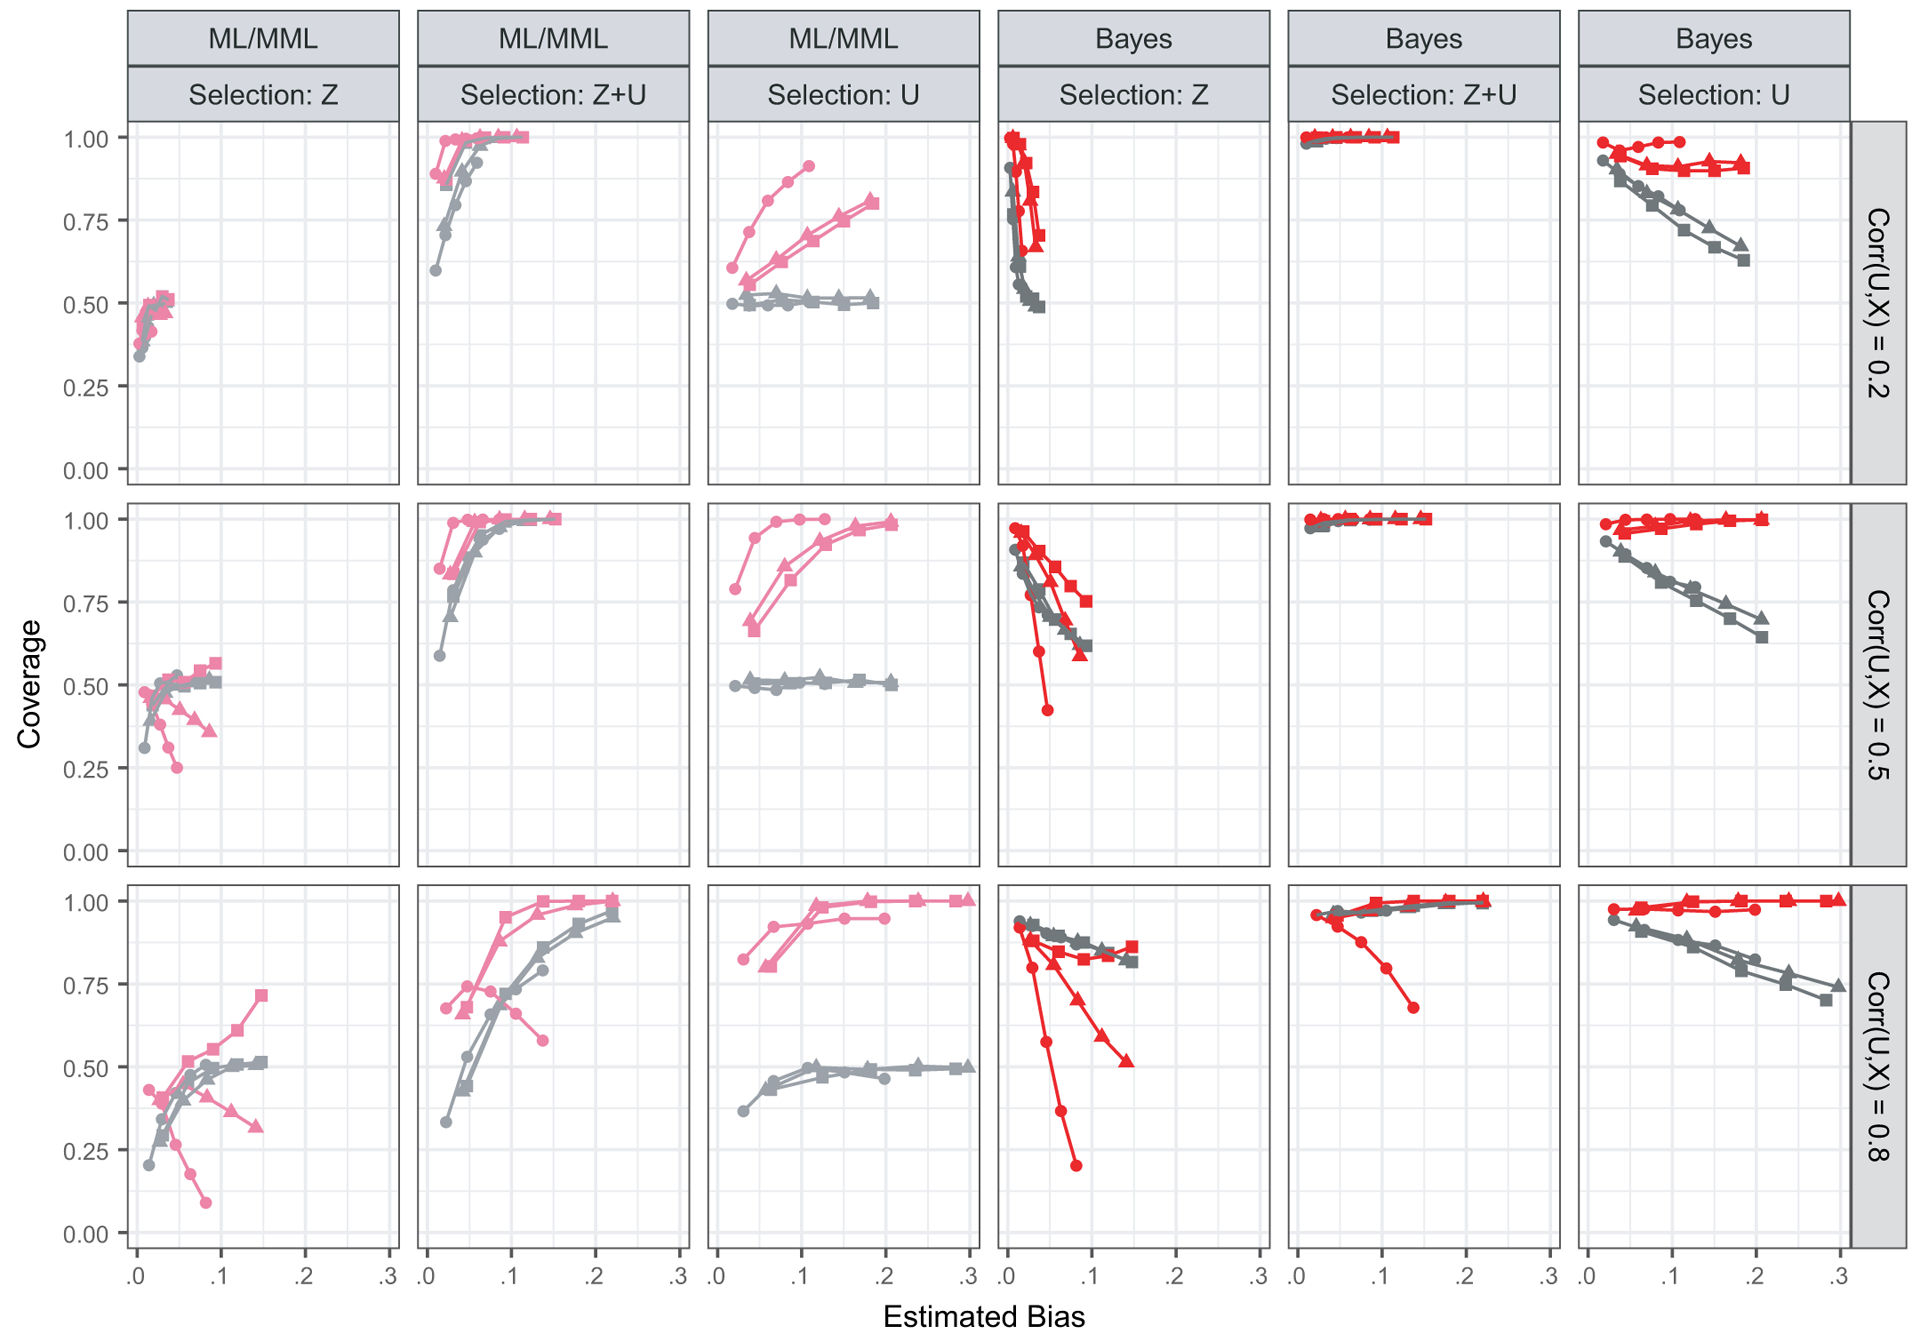
Rising costs of survey data collection and declining response rates have caused researchers to turn to non-probability samples to make descriptive statements about populations. However, unlike probability samples, non-probability samples may produce severely biased descriptive estimates due to selection bias. The paper develops and evaluates a simple model-based index of the potential selection bias in estimates of population proportions due to non-ignorable selection mechanisms. The index depends on an inestimable parameter ranging from 0 to 1 that captures the amount of deviation from selection at random and is thus well suited to a sensitivity analysis. We describe modified maximum likelihood and Bayesian estimation approaches and provide new and easy-to-use R functions for their implementation. We use simulation studies to evaluate the ability of the proposed index to reflect selection bias in non-probability samples and show how the index outperforms a previously proposed index that relies on an underlying normality assumption. We demonstrate the use of the index in practice with real data from the National Survey of Family Growth.
Keywords: Non-ignorable selection bias; Non-probablity samples; Selection at random; Survey data collection.
Figures
References
-
- Andridge RR and Little RJA (2011) Proxy pattern-mixture analysis for survey nonresponse. J. Off. Statist, 27, 153–180.
-
- Andridge RR and Little RJA (2019) Proxy pattern-mixture analysis for a binary survey variable subject to nonresponse. Submitted to J. Off. Statist
-
- Bowen DJ, Bradford J and Powers D (2007) Comparing sexual minority status across sampling methods and populations. Womn Hlth, 44, no. 2, 121–134. - PubMed
-
- Braithwaite D, Emery J, de Lusignan S and Sutton S (2003) Using the Internet to conduct surveys of health professionals: a valid alternative? Famly Pract., 20, 545–551. - PubMed
-
- Brick JM and Williams D (2013) Explaining rising nonresponse rates in cross-sectional surveys. Ann. Am. Acad. Polit. Socl Sci, 645, 36–59.
Grants and funding
LinkOut - more resources
Full Text Sources