. 2020 Dec 1:75:71-143.
doi: 10.3897/mycokeys.75.59872. eCollection 2020.

A global meta-analysis of ITS rDNA sequences from material belonging to the genus Ganoderma (Basidiomycota, Polyporales) including new data from selected taxa

Affiliations

A global meta-analysis of ITS rDNA sequences from material belonging to the genus Ganoderma (Basidiomycota, Polyporales) including new data from selected taxa

Vassiliki Fryssouli et al. MycoKeys. .

Abstract

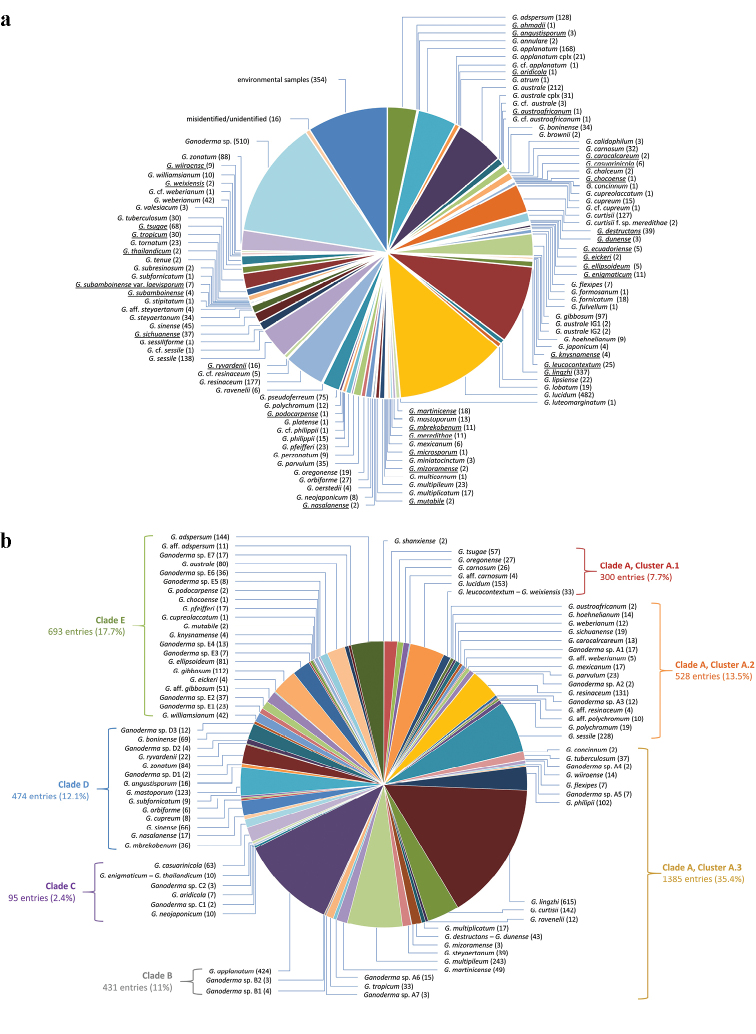
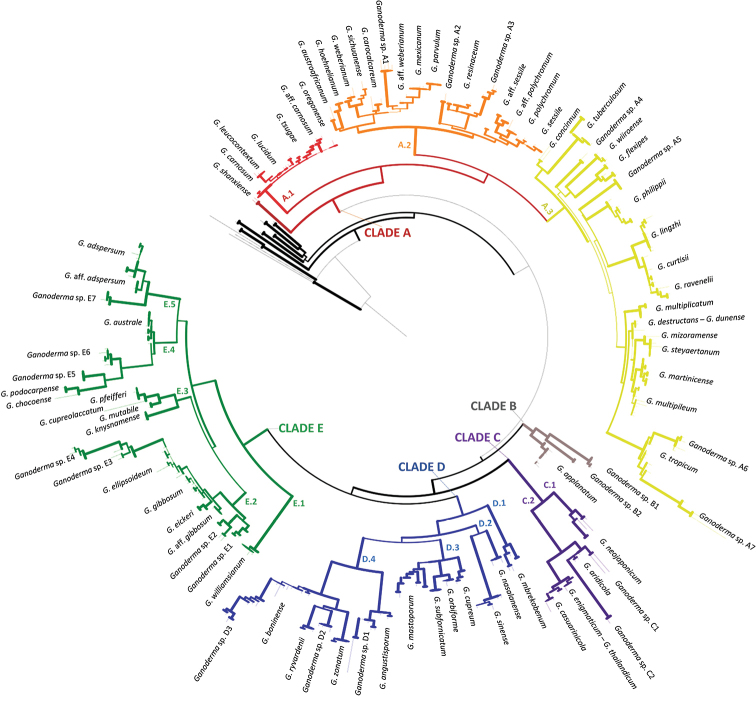
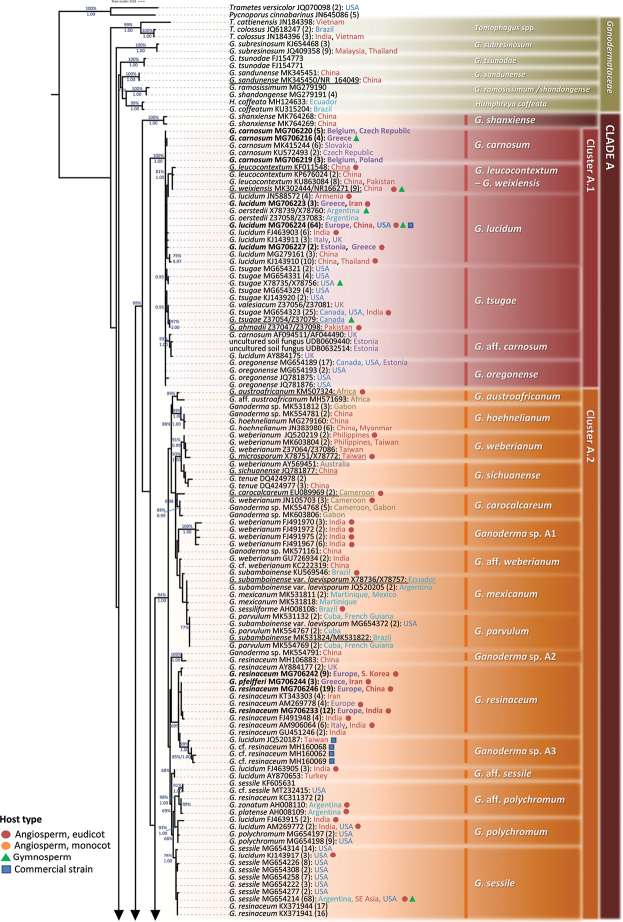
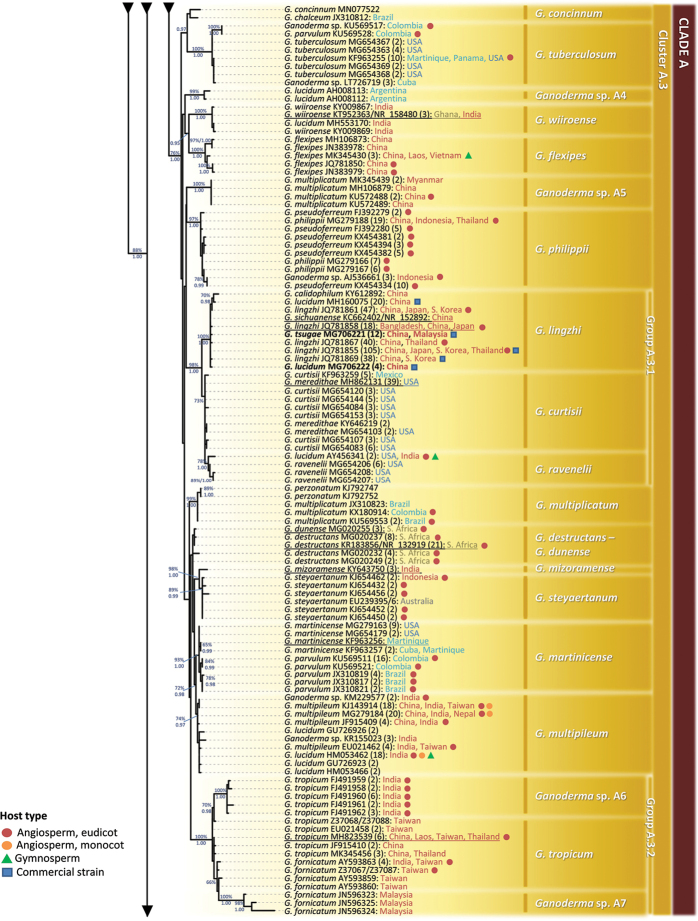
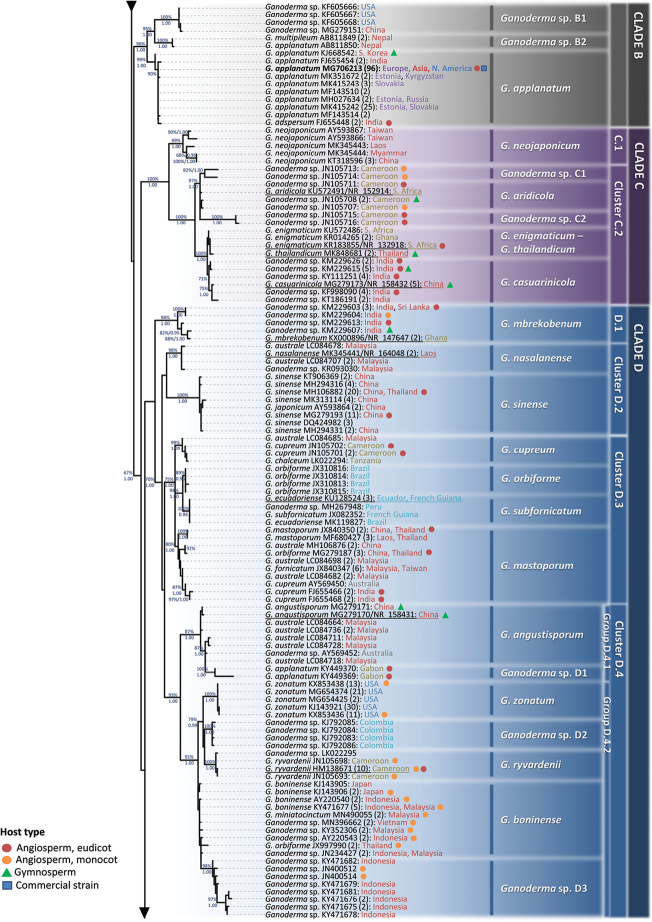
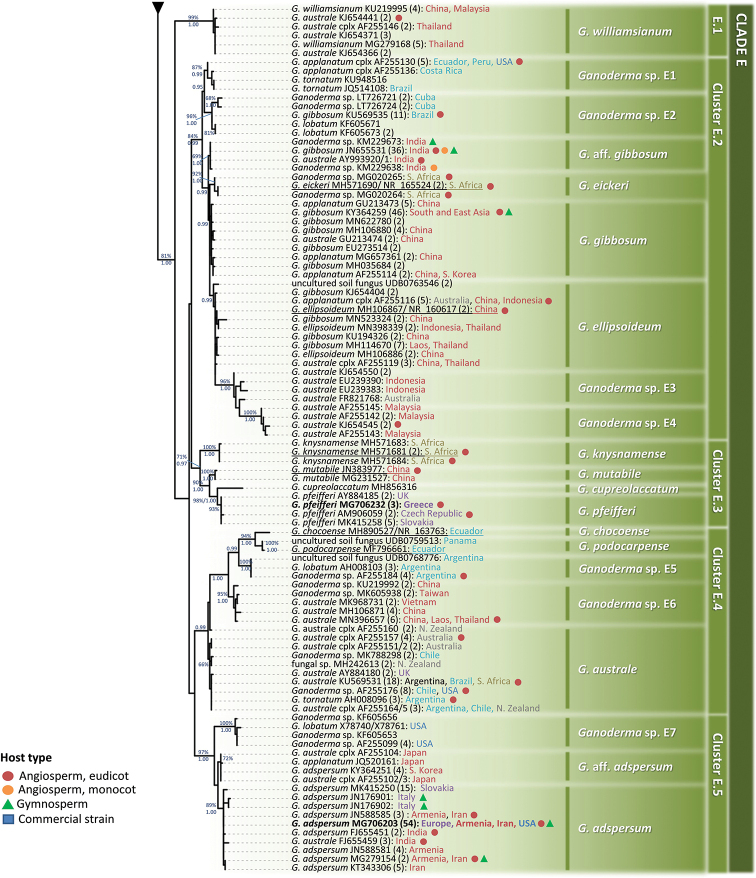
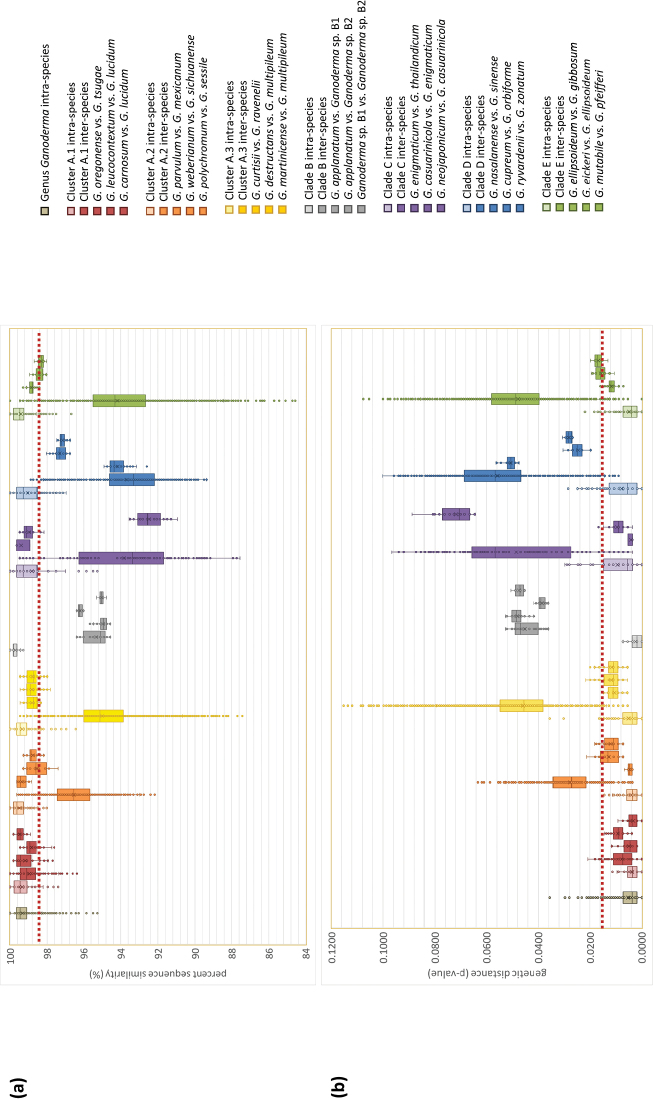
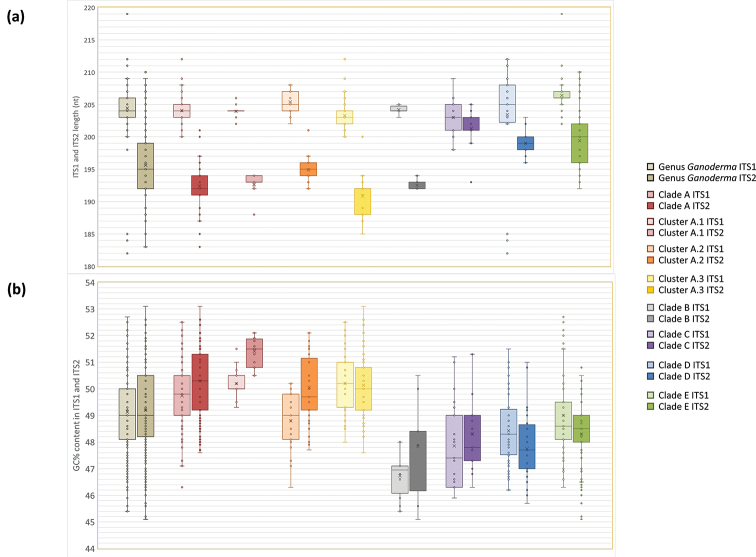
Ganoderma P. Karst. is a cosmopolitan genus of white-rot fungi which comprises species with highly-prized pharmaceutical properties, valuable biotechnological applications and of significant phytopathological interest. However, the status of the taxonomy within the genus is still highly controversial and ambiguous despite the progress made through molecular approaches. A metadata analysis of 3908 nuclear ribosomal internal transcribed spacer (ITS) rDNA sequences obtained from GenBank/ENA/DDBJ and UNITE was performed by targeting sequences annotated as Ganoderma, but also sequences from environmental samples and from material examined for the first time. Ganoderma taxa segregated into five main lineages (Clades A to E). Clade A corresponds to the core of laccate species and includes G. shanxiense and three major well-supported clusters: Cluster A.1 ('G. lucidum sensu lato') consists of taxa from Eurasia and North America, Cluster A.2 of material with worldwide occurrence including G. resinaceum and Cluster A.3 is composed of species originating from all continents except Europe and comprises G. lingzhi. Clade B includes G. applanatum and allied species with a Holarctic distribution. Clade C comprises taxa from Asia and Africa only. Clade D consists of laccate taxa with tropical/subtropical occurrence, while clade E harbours the highest number of non-laccate species with a cosmopolitan distribution. The 92 Ganoderma-associated names, initially used for sequences labelling, correspond to at least 80 taxa. Amongst them, 21 constitute putatively new phylospecies after our application of criteria relevant to the robustness/support of the terminal clades, intra- and interspecific genetic divergence and available biogeographic data. Moreover, several other groups or individual sequences seem to represent distinct taxonomic entities and merit further investigation. A particularly large number of the public sequences was revealed to be insufficiently and/or incorrectly identified, for example, 87% and 78% of entries labelled as G. australe and G. lucidum, respectively. In general, ITS demonstrated high efficacy in resolving relationships amongst most of the Ganoderma taxa; however, it was not equally useful at elucidating species barriers across the entire genus and such cases are outlined. Furthermore, we draw conclusions on biogeography by evaluating species occurrence on a global scale in conjunction with phylogenetic structure/patterns. The sequence variability assessed in ITS spacers could be further exploited for diagnostic purposes.

Keywords: Biogeography; ITS; fungal diversity; medicinal mushroom; phylogeny; taxonomy.


Figures

Figure 1.
Figure 1.
a Initial labelling of 3908 Ganoderma sequences analysed in the present study: numbers in parentheses correspond to sequences deposited under the particular name in GenBank/ENA/DDBJ and UNITE, while species names appear underlined when ITS sequences derive from type material b final assigment of 3908 Ganoderma sequences to 80 species and six distinct groups as a result of the phylogenetic analyses performed in this study: numbers in parentheses correspond to the number of sequences grouped within each taxon (data deriving from Table 1 and Suppl. material 1: Tables S2, S4).
Figure 2.
Figure 2.
Basidiomes of Ganoderma spp. amongst those collected and analysed in this study (specimens codes appear in parantheses; Suppl. material 1: Table S1) aG. lucidum (A1180) bG. carnosum (DD1243) cG. resinaceum (2012-0077) dG. adspersum (2010-0015) eG. applanatum (DD2119) fG. pfeifferi (DD2118).
Figure 3.
Figure 3.
Summary tree of the genus Ganoderma inferred from ML analysis, based on ITS sequence data (main dataset, DS; Table 2). Thick lines represent ML bootstrap values (BS) ≥ 65% and Bayesian Posterior Probabilities (BPP) ≥ 0.95. Clades and Clusters within the tree appear as presented in Table 1 and Suppl. material 1: Table S2. Species names correspond to those inferred in this study. Scale bar: 0.01 nucleotide substitutions per site.
Figure 4.
Figure 4.
Detail from Fig. 3. Phylogenetic reconstruction of the genus Ganoderma inferred from ML analysis, based on ITS sequence data (main dataset, DS; Table 2) for Clade A, Clusters A.1 and A.2. ML bootstrap values (BS) ≥ 65% and Bayesian Posterior Probabilities (BPP) ≥ 0.95 are shown. Sequences names on the left appear as initially labelled and are followed by the respective GenBank/ENA/DDBJ or UNITE accession number, while the total number of identical entries corresponding to a particular sequence is placed in parentheses, followed by the type of host plant (legend for the coloured shapes is found at the lower left side of tree) and geographic origin of the respective material (the latter appears in different font colour depending on the continent of provenance; see also Table 1 and Suppl. material 1: Table S2). Species names on the right correspond to those inferred in this study evaluated in conjunction with literature data. Sequences generated in the present work appear in bold typeface, while underlined sequences are those originating from type material. Scale bar: 0.01 nucleotide substitutions per site.
Figure 5.
Figure 5.
Detail from Fig. 3. Phylogenetic reconstruction of the genus Ganoderma inferred from ML analysis, based on ITS sequence data (main dataset, DS; Table 2) for Clade A, Cluster A.3. ML bootstrap values (BS) ≥ 65% and Bayesian Posterior Probabilities (BPP) ≥ 0.95 are shown. Sequences names on the left appear as initially labelled and are followed by the respective GenBank/ENA/DDBJ or UNITE accession number, while the total number of identical entries corresponding to a particular sequence is placed in parentheses, followed by the type of host plant (legend for the coloured shapes is found at the lower left side of the tree) and geographic origin of the respective material (the latter appears in different fonts colour depending on the continent of provenance; see also Table 1 and Suppl. material 1: Table S2). Species names on the right correspond to those inferred in this study evaluated in conjunction with literature data. Sequences generated in the present work appear in bold typeface, while underlined sequences are those originating from type material. Scale bar: 0.01 nucleotide substitutions per site.
Figure 6.
Figure 6.
Detail from Fig. 3. Phylogenetic reconstruction of the genus Ganoderma inferred from ML analysis, based on ITS sequence data (main dataset, DS; Table 2) for Clades B, C and D. ML bootstrap values (BS) ≥ 65% and Bayesian Posterior Probabilities (BPP) ≥ 0.95 are shown. Sequences names on the left appear as initially labelled and are followed by the respective GenBank/ENA/DDBJ or UNITE accession number, while the total number of identical entries corresponding to a particular sequence is placed in parentheses, followed by the type of host plant (legend for the coloured shapes is found at the lower left side of the tree) and geographic origin of the respective material (the latter appears in different fonts colour depending on the continent of provenance; see also Table 1 and Suppl. material 1: Table S2). Species names on the right correspond to those inferred in this study evaluated in conjunction with literature data. Sequences generated in the present work appear in bold typeface, while underlined sequences are those originating from type material. Scale bar: 0.01 nucleotide substitutions per site.
Figure 7.
Figure 7.
Detail from Fig. 3. Phylogenetic reconstruction of the genus Ganoderma inferred from ML analysis, based on ITS sequence data (main dataset, DS; Table 2) for Clade E. ML bootstrap values (BS) ≥ 65% and Bayesian Posterior Probabilities (BPP) ≥ 0.95 are shown. Sequences names on the left appear as initially labelled and are followed by the respective GenBank/ENA/DDBJ or UNITE accession number, while the total number of identical entries corresponding to a particular sequence is placed in parentheses, followed by the type of host plant (legend for the coloured shapes is found at the lower left side of tree) and geographic origin of the respective material (the latter appears in different fonts colour depending on the continent of provenance; see also Table 1 and Suppl. material 1: Table S2). Species names on the right correspond to those inferred in this study evaluated in conjunction with literature data. Sequences generated in the present work appear in bold typeface, while underlined sequences are those originating from type material. Scale bar: 0.01 nucleotide substitutions per site.
Figure 8.
Figure 8.
Box plots of aITS sequence similarity (%) and b genetic distances (p-values) within (intra) and between (inter) Ganoderma species for each one of the main lineages (Clades/Clusters) of the genus, as well as pairwise comparisons between selected species. The size of each box represents 50% of the values, the black horizontal line within each box indicates the median, the ‘x’ represents the average value, the error bars represent interquartile ranges and circles indicate outliers. The red-dotted horizontal line, transversing the plots, represents the value levels accepted in this study for proposing new phylogenetic species.
Figure 9.
Figure 9.
Box plots of a length (bases) and b GC (%) content of ITS1 and ITS2 sequences for each one of the main lineages (Clades/Clusters) of the genus Ganoderma. The size of each box represents 50% of the values, the black horizontal line within each box indicates the median, the ‘x’ represents the average value, the error bars represent interquartile ranges and circles indicate outliers.

References

    1. Adaskaveg JE, Gilbertson RL. (1986) Cultural studies and genetics of sexuality of Ganoderma lucidum and G. tsugae in relation to the taxonomy of the G. lucidum complex. Mycologia 78(5): 694–705. 10.1080/00275514.1986.12025312 - DOI
    1. Adaskaveg JE, Gilbertson RL. (1988) Basidiospores, pilocystidia, and other basidiocarp characters in several species of the G. lucidum complex. Mycologia 80(4): 493–507. 10.1080/00275514.1988.12025571 - DOI
    1. Altschul SF, Madden TL, Schäffer AA, Zhang J, Zhang Z, Miller W, Lipman DJ. (1997) Gapped BLAST and PSI-BLAST: a new generation of protein database search programs. Nucleic Acids Research 25(17): 3389–3402. 10.1093/nar/25.17.3389 - DOI - PMC - PubMed
    1. Ankenbrand MJ, Keller A, Wolf M, Schultz J, Förster F. (2015) ITS2 database V: Twice as much. Molecular Biology and Evolution 32(11): 3030–3032. 10.1093/molbev/msv174 - DOI - PubMed
    1. Badotti F, de Oliveira FS, Garcia CF, Vaz AB, Fonseca PL, Nahum LA, Oliveira G, Góes-Neto A. (2017) Effectiveness of ITS and sub-regions as DNA barcode markers for the identification of Basidiomycota (Fungi). BMC Microbiology 17(1): 1–42. 10.1186/s12866-017-0958-x - DOI - PMC - PubMed

LinkOut - more resources