. 2020 Nov 16:11:597549.
doi: 10.3389/fendo.2020.597549. eCollection 2020.

CCN3 Signaling Is Differently Regulated in Placental Diseases Preeclampsia and Abnormally Invasive Placenta

Affiliations

CCN3 Signaling Is Differently Regulated in Placental Diseases Preeclampsia and Abnormally Invasive Placenta

Liyan Duan et al. Front Endocrinol (Lausanne). .

Abstract

Objectives: An adequate development of the placenta includes trophoblast differentiation with the processes of trophoblast migration, invasion, cellular senescence and apoptosis which are all crucial to establishing a successful pregnancy. Altered placental development and function lead to placental diseases such as preeclampsia (PE) which is mainly characterized by insufficient trophoblast invasion and abnormally invasive placenta (AIP) disorders (Placenta accreta, increta, or percreta) which are characterized by excessive trophoblast invasion. Both of them will cause maternal and fetal morbidity/mortality. However, the etiology of these diseases is still unclear. Our previous study has shown that the matricellular protein nephroblastoma overexpressed (NOV, CCN3) induces G0/G1 cell cycle arrest, drives trophoblast cells into senescence and activates FAK and Akt kinases resulting in reduced cell proliferation and enhanced migration capability of the human trophoblast cell line SGHPL-5. The present study focuses on whether CCN3 can alter cell cycle-regulated pathways associated with trophoblast senescence and invasion activity in pathological versus gestational age-matched control placentas.

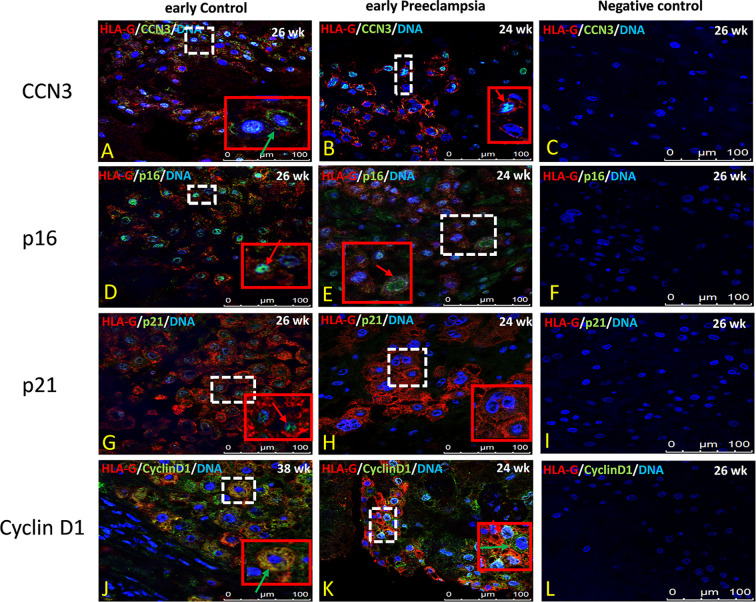
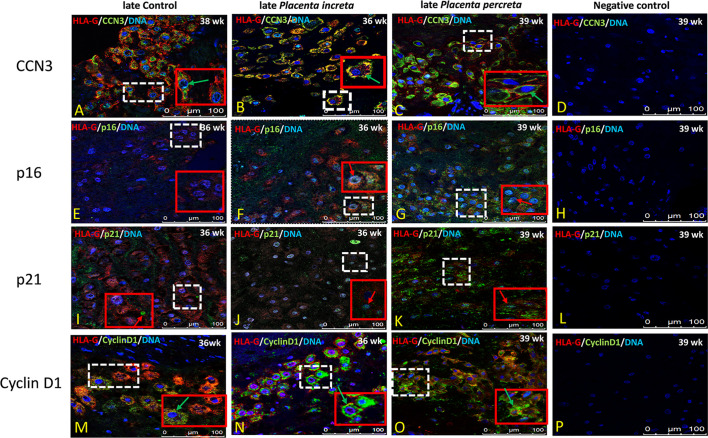
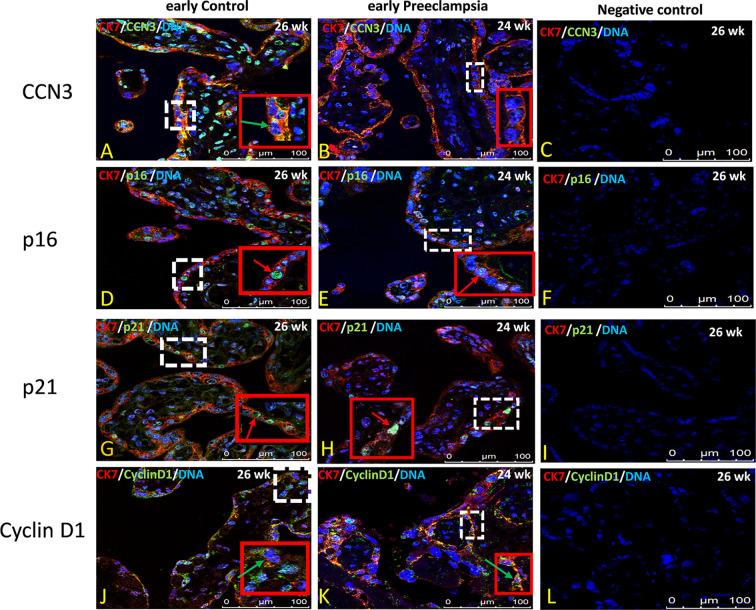
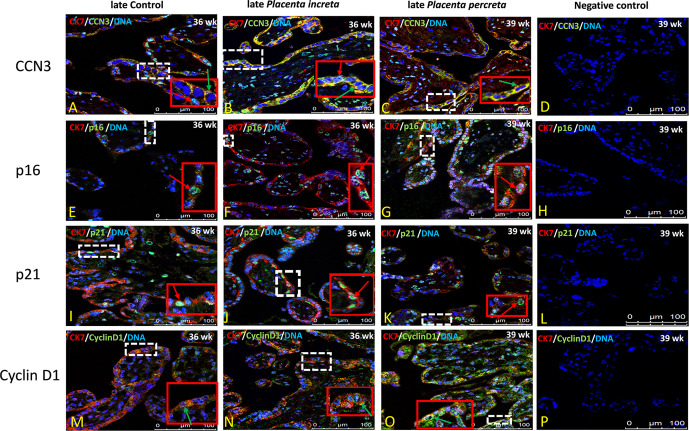
Methods: Cell cycle regulator proteins were investigated by immunoblotting and qPCR. For localization of CCN3, p16, p21, and Cyclin D1 proteins, co-immunohistochemistry was performed.

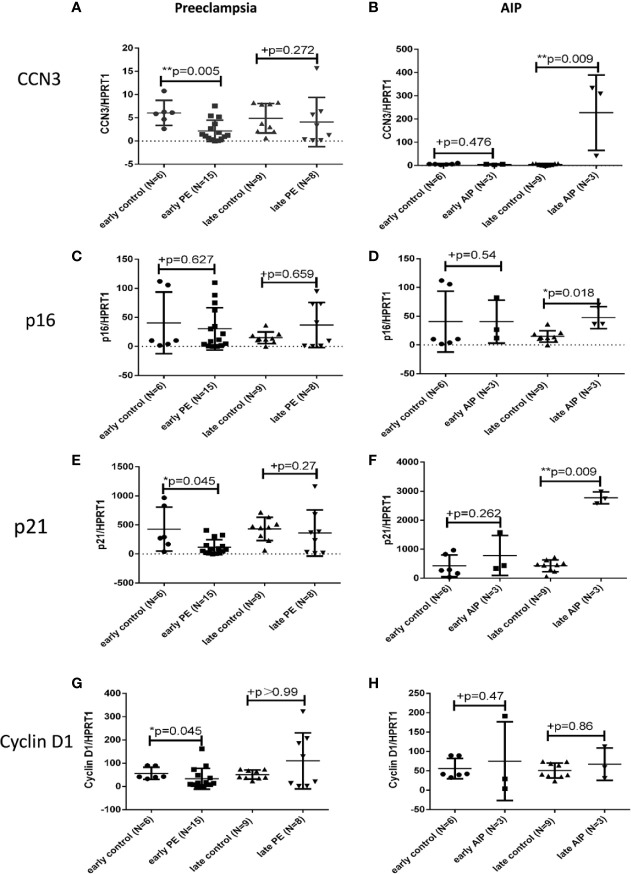
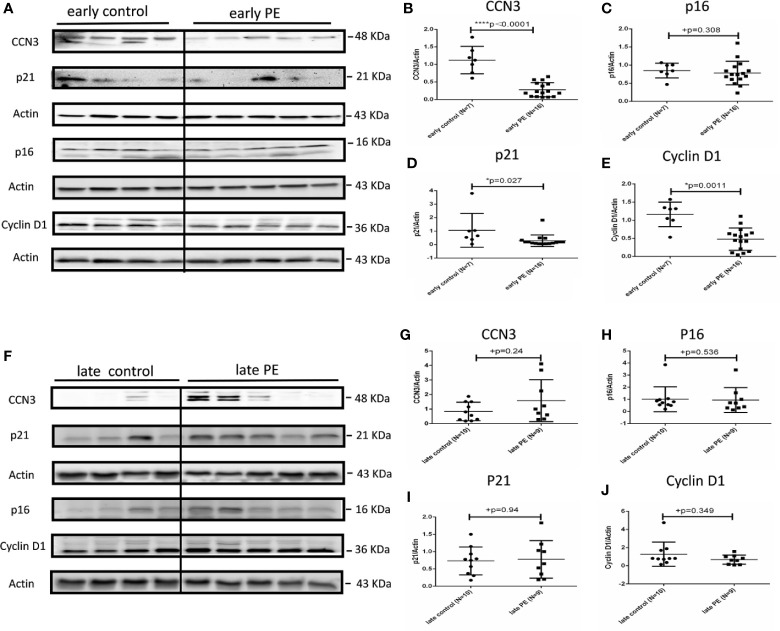
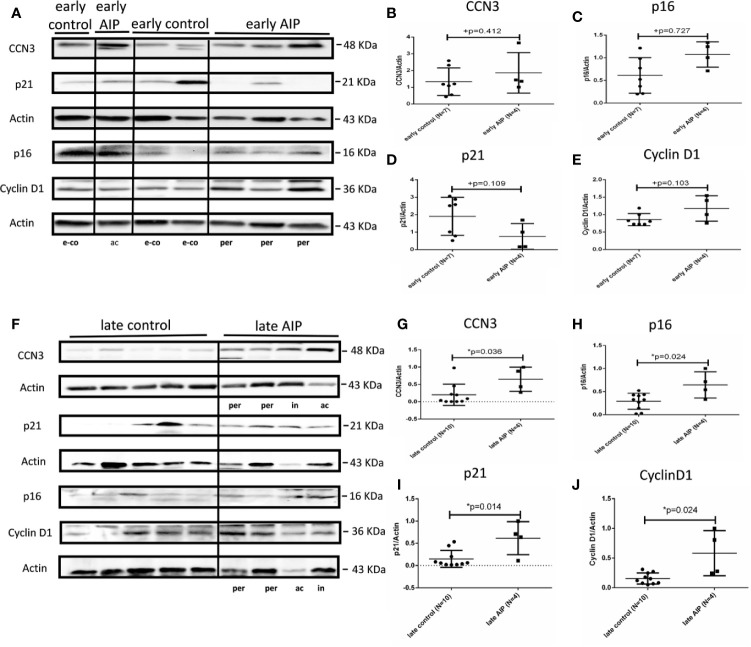
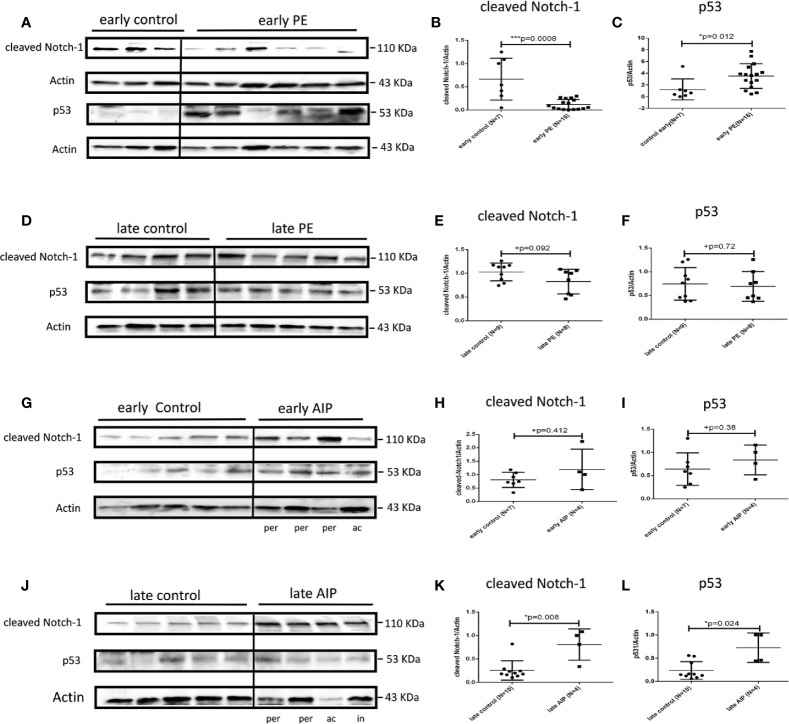
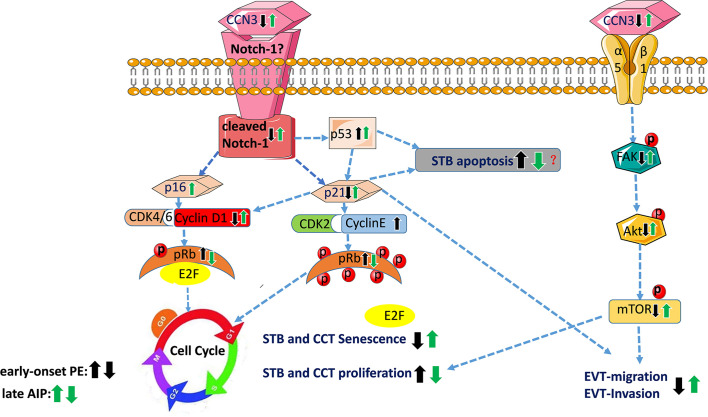
Results: In early-onset PE placentas, CCN3 was expressed at a significantly lower level compared to gestational age-matched controls. The decrease of CCN3 level is associated with an increase in p53, Cyclin E1 and pRb protein expression, whereas the level of cleaved Notch-1, p21, Cyclin D1, pFAK, pAKT, and pmTOR protein decreased. In term AIP placentas, the expression of CCN3 was significantly increased compared to matched term controls. This increase was correlated to an increase in p53, p16, p21, Cyclin D1, cleaved Notch-1, pFAK, pAkt, and pmTOR whereas pRb was significantly decreased. However, in late PE and early AIP placentas, no significant differences in CCN3, p16, p21, Cyclin D1, p53, and cleaved Notch-1 expression were found when matched to appropriate controls.

Conclusions: CCN3 expression levels are correlated to markers of cell cycle arrest oppositely in PE and AIP by activating the FAK/AKT pathway in AIP or down-regulating in PE. This may be one mechanism to explain the different pathological features of placental diseases, PE and AIP.

Keywords: CCN3; abnormally invasive placenta; invasion; preeclampsia; senescence; trophoblast.


Figures

Figure 1
Figure 1
Transcript expression of CCN3, p16, p21, and Cyclin D1 in preeclamptic and AIP placentas. Analysis of the mRNA expression of CCN3 (A, B), p16 (C, D), p21 (D, E), and Cyclin D1 (G, H) in the placentas of early control (N = 7), late control (N = 10), early PE (N = 16), late PE (N = 9), early AIP (N = 4), and late AIP (N = 4) placentas. The relative mRNA levels were tested by qRT-PCR. The transcript levels of examined genes were compared after normalization to HPRT1. Data represent means ± SD. *p < 0.05 and **p < 0.01, significantly up-/down-regulated compared to controls. +p > 0.05 indicates that there is no significant differences between the two and matched groups. The box blots showed that the mRNA of CCN3 (A), p21 (E), and Cyclin D1 (G) were significantly decreased in early PE compared to early control while there is no significant difference in late PE compared to late control. The mRNA expression of p16 (C) was not different in both groups. (B, D, F) show that the CCN3, p16 and p21 mRNA levels were significantly increased in late AIP while no difference in early AIP compared to gestational age-matched controls was shown. The Cyclin D1 mRNA level was not significantly different in both AIP groups (H).
Figure 2
Figure 2
Protein expression of CCN3, p16, p21, and Cyclin D1 in early and late preeclamptic placentas. (A) Representative western blot of CCN3, p16, p21, and Cyclin D1 protein expression in the early control group (N = 7) and early PE group (N = 16). (B–E) CCN3, p16, p21, and Cyclin D1 protein levels are normalized to Actin expression and further on normalized to the same sample as internal control which runs on each gel. The expression of CCN3, p21 and Cyclin D1 was significantly lower than controls, while p16 was not significantly different in the early PE group. (F) Representative western blot of CCN3, p16, p21, and Cyclin D1 protein expression in the late control (N = 10) and late PE (N = 9). (G–J) The expression of CCN3, p21 and Cyclin D1 was significantly lower compared to the control group while the p16 was not significantly different in the early PE group. Protein expression of CCN3, p21, p16, and Cyclin D1 was not significantly different between late PE and late control groups. Data represent means ± SD. *p < 0.05 and ****p < 0.0001, significantly up-/down-regulated compared to the control. +p ≥ 0.05 indicates that there is no significant difference between the groups.
Figure 3
Figure 3
Protein expression of CCN3, p16, p21, and Cyclin D1 in AIP placentas. (A) Representative western blot of CCN3, p16, p21, and Cyclin D1 protein expression in the early control group (N = 7) and early AIP group (N = 4), e-co represents early control, ac and per represent Placenta accreta and Placenta percreta samples. (B–E) CCN3, p16, p21, and Cyclin D1 protein levels were normalized to Actin and further on normalized to a same sample run on each gel. CCN3, p16, p21, and Cyclin D1 protein levels are not significantly different between early control and early AIP. (F) Representative western blot of CCN3, p16, p21, and Cyclin D1 protein expression in the late control (N = 10) and late AIP (N = 4). ac, in and per represent Placenta accreta, increta, and Placenta percreta samples. (G–J) The expression of CCN3, p21 and Cyclin D1 was significantly increased in the late AIP. Data represent means ± SD. *p < 0.05, significantly up-/down-regulated compared to the control. +p ≥ 0.05 indicates that there is no significant difference between the groups.
Figure 4
Figure 4
Protein expression of cleaved Notch-1 and p53 in preeclamptic placentas and AIP placentas. (A) Representative western blot results of cleaved Notch-1 and p53 protein expression in the early control (N = 7) and early PE (N = 16). (B, C) The expression of cleaved Notch-1 was significantly lower while p53 was significantly increased in the early PE group. (D) Representative western blot of cleaved Notch-1 and p53 protein expression in the late control (N = 10) and late PE (N = 9). (E, F) Protein expression of cleaved Notch-1 was not significantly different between late PE and late control group. (G) Representative western blot results of cleaved Notch-1 and p53 protein expression in the early control group (N = 7) and early AIP group (N = 4), e-co represented early control, ac and per represent Placenta accreta and Placenta percreta samples. (H, I) Cleaved Notch-1 and p53 protein levels are not significantly different between the early control group and early AIP. (J) Representative western blot of cleaved Notch-1 and p53 protein expression in the late control (N = 10) and late AIP (N = 4), l-co represented late control, ac, in and per represent Placenta accreta, increta and Placenta percreta samples. (K, L) The expression of cleaved Notch-1 and p53 was significantly increased in the late AIP group. The cleaved Notch-1 and p53 protein levels were normalized to Actin and further on normalized to the same sample run on each gel. Data represent means ± SD. *p < 0.05 and ***p < 0.001, significantly up-/down-regulated compared to the control. +p ≥ 0.05 indicates that there is no significant difference between the groups.
Figure 5
Figure 5
Immunolocalization of CCN3, p16, p21, and Cyclin D1 in EVT cells of early preeclamptic placenta. Double immunolabelling of CCN3 (A, B), p16 (D, E), p21 (G, H), and Cyclin D1 (J, K), in green, with the EVT marker HLA-G, in red; blue, DAPI, respectively. Red arrow, nuclear expression; green arrow, membrane/cytoplasmic expression. Negative controls were performed by omitting the primary antibody (C, F, I, L). Scale bar represents: (A–L), 100 μm. The red box is an enlargement of the white dotted box.
Figure 6
Figure 6
Immunolocalization of CCN3, p16, p21, and Cyclin D1 in EVT cells of late AIP. Double immunolabelling of CCN3 (A–C), p16 (E–G), p21 (I–K), and Cyclin D1 (M–O), in green, with HLA-G, in red; blue, DAPI, respectively. Red arrow, nuclear expression; green arrow, membrane/cytoplasmic. Negative controls were performed by omitting the primary antibody (D, H, L, P). Scale bar represents: (A–P), 100 μm. The red box is an enlarged part of the white dotted box.
Figure 7
Figure 7
Immunolocalization of CCN3, p16, p21, and Cyclin D1 in villous trophoblast cells of preeclamptic placenta. Double immunolabelling of CCN3 (A, B), p16 (D, E), p21 (G, H), and Cyclin D1 (J, K), in green, with the trophoblast marker CK-7, in red; blue, DAPI, respectively. Red arrow, nucleus expression; green arrow, membrane/cytoplasmic expression. Analysis of representative early control and early preeclamptic placental sections. Negative controls were performed by omitting the primary antibody (C, H, L, P). Scale bar represents: (A–L), 100 μm. The red box is an enlarged part of the white dotted box.
Figure 8
Figure 8
Immunolocalization of CCN3, p16, p21, and Cyclin D1 in villous trophoblast cells of AIP. Double immunolabelling of CCN3 (A–C), p16 (E–G), p21 (I–K), and Cyclin D1 (M–O), in green, with the trophoblast marker CK-7, in red; blue, DAPI, respectively. Red arrow, nuclear expression; green arrow, membrane/cytoplasmic expression. Negative controls were performed by omitting the primary antibody (D/H/L/P). Scale bar represents: (A–P), 100 μm. The red box is an enlarged part of the white dotted box.
Figure 9
Figure 9
Schematic overview of proposed CCN3-mediated signaling pathways in placental diseases PE and AIP. This figure summarizes the results of this study and showed the proposed signaling pathway of CCN3 in placentas of PE and AIP diseases. In early-onset preeclamptic placentas, CCN3 may promote STB and CCT cell cycle progression via p21/Cyclin E1/pRB and FAK/Akt/mTOR pathway. We speculate that the invasion and migration capacities of the EVT may be decreased by subsequently inhibiting FAK/Akt pathway and cleaved Notch/p21 signaling. Increased p53 expression can induce cell apoptosis and decreased p21 that also inducing cell apoptosis, which may result in PE. However, in the late AIP group, CCN3 may mediate cell cycle arrest by bringing about senescence which is advantageous for the differentiation from CTB to STB and EVT. Furthermore, CCN3 may enhance invasion and migration capacities of the trophoblast by activating FAK/Akt pathway. Although an increase in p53 may increase the apoptosis of trophoblast cells, increased p21 may also promote cell viability through an anti-apoptotic pathway, which may contribute to the AIP disease. CCT, cell column trophoblast; EVT, extravillous trophoblast; STB, syncytiotrophoblast.

Similar articles

Cited by

References

    1. Knöfler M, Haider S, Saleh L, Pollheimer J, Gamage TK, James J. Human placenta and trophoblast development: key molecular mechanisms and model systems. Cell Mol Life Sci (2019), 76:3479–96. 10.1007/s00018-019-03104-6 - DOI - PMC - PubMed
    1. Bartels HC, Postle JD, Downey P, Brennan DJ. Placenta Accreta Spectrum: A Review of Pathology, Molecular Biology, and Biomarkers. Dis Markers (2018) 2018:1507674. 10.1155/2018/1507674 - DOI - PMC - PubMed
    1. Abalos E, Cuesta C, Grosso AL, Chou D, Say L. Global and regional estimates of preeclampsia and eclampsia: a systematic review. Eur J Obstetr Gynecol Reprod Biol (2013) 170:1–7. 10.1016/j.ejogrb.2013.05.005 - DOI - PubMed
    1. Harrison MS, Goldenberg RL. Global burden of prematurity. Semin Fetal Neonatal Med (2016) 21:74–9. 10.1016/j.siny.2015.12.007 - DOI - PubMed
    1. Han C, Han L, Huang P, Chen Y, Wang Y, Xue F. Syncytiotrophoblast-Derived Extracellular Vesicles in Pathophysiology of Preeclampsia. Front Physiol (2019) 10:e1236. . 10.3389/fphys.2019.01236 - DOI - PMC - PubMed

Publication types