. 2020 Oct;10(1):e12024.
doi: 10.1002/jev2.12024. Epub 2020 Nov 11.

Adipose-derived mesenchymal stem cells reduce autophagy in stroke mice by extracellular vesicle transfer of miR-25

Affiliations

Adipose-derived mesenchymal stem cells reduce autophagy in stroke mice by extracellular vesicle transfer of miR-25

Yaoyun Kuang et al. J Extracell Vesicles. 2020 Oct.

Abstract

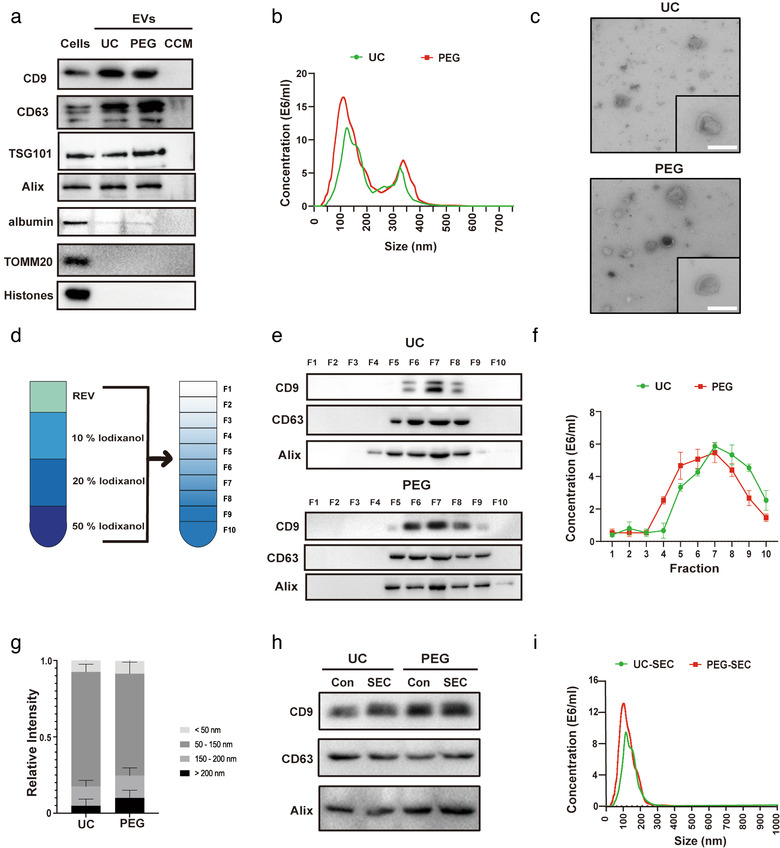
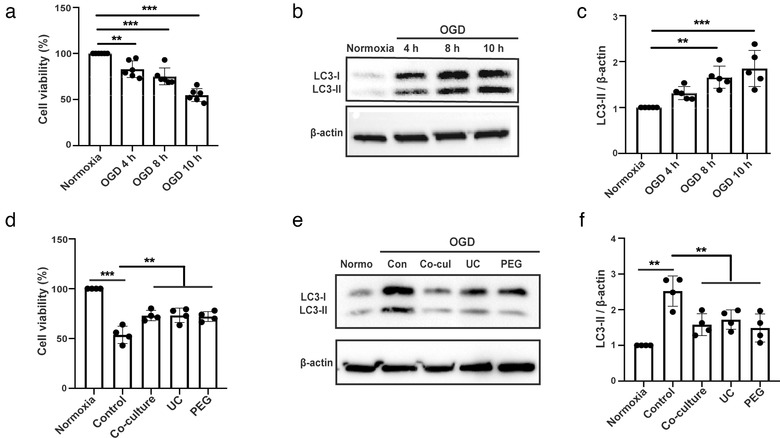
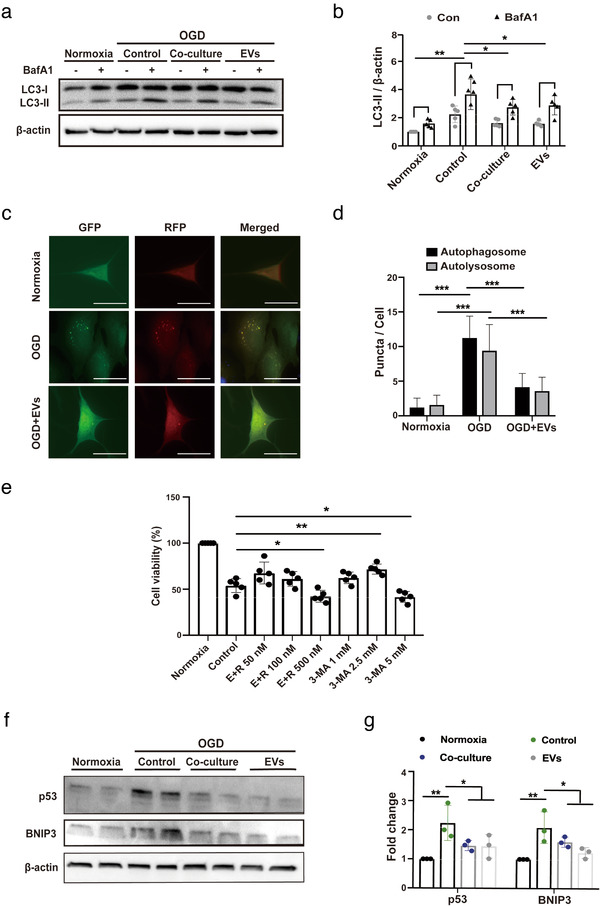
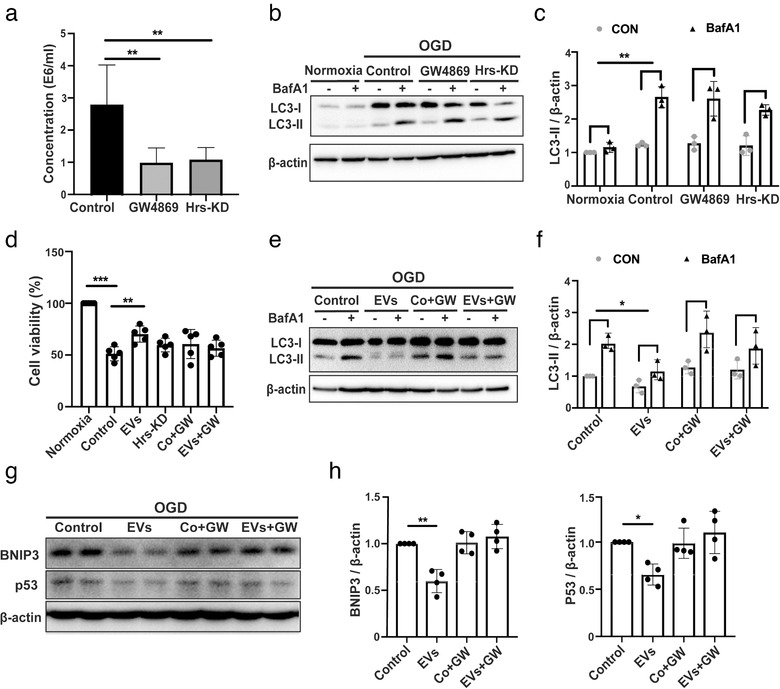
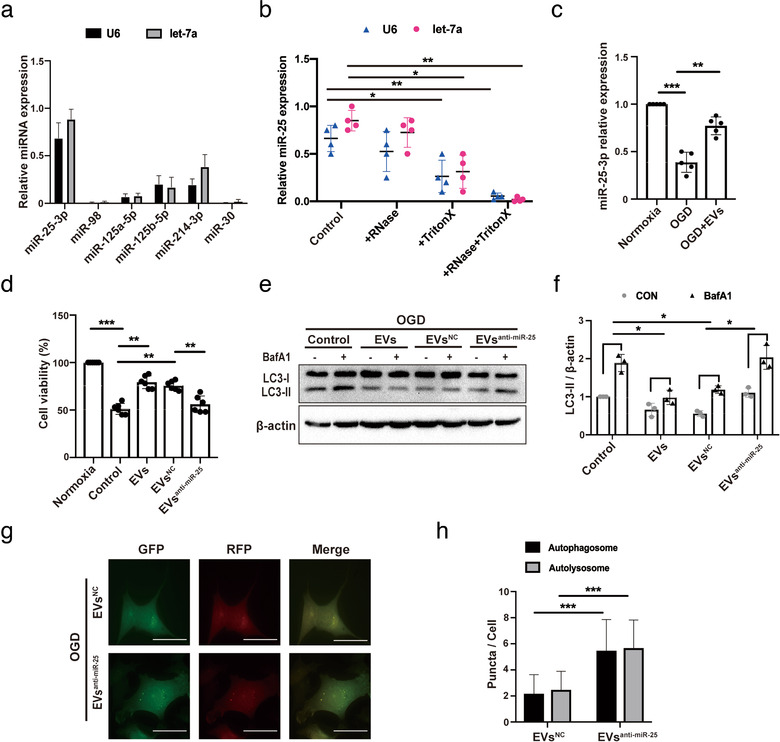
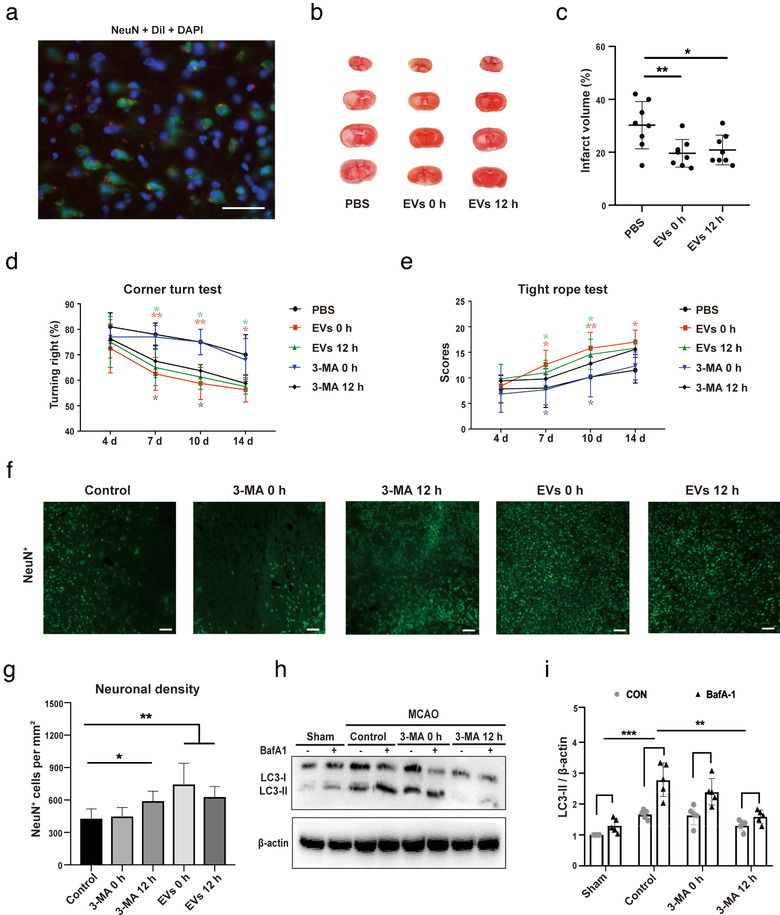
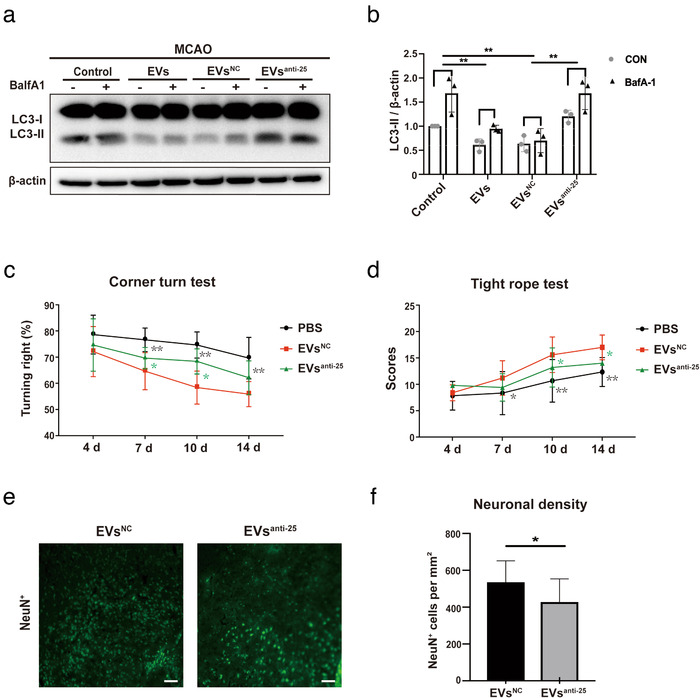
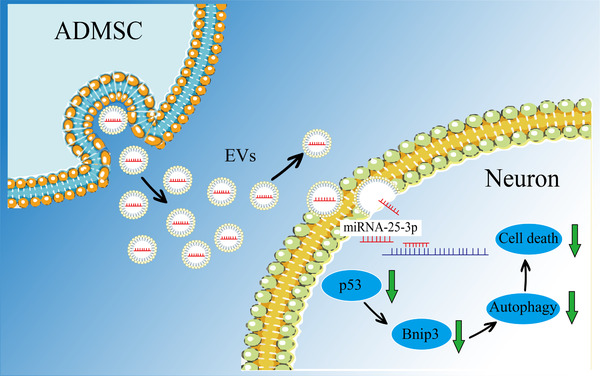
Grafted mesenchymal stem cells (MSCs) yield neuroprotection in preclinical stroke models by secreting extracellular vesicles (EVs). The neuroprotective cargo of EVs, however, has not yet been identified. To investigate such cargo and its underlying mechanism, primary neurons were exposed to oxygen-glucose-deprivation (OGD) and cocultured with adipose-derived MSCs (ADMSCs) or ADMSC-secreted EVs. Under such conditions, both ADMSCs and ADMSC-secreted EVs significantly reduced neuronal death. Screening for signalling cascades being involved in the interaction between ADMSCs and neurons revealed a decreased autophagic flux as well as a declined p53-BNIP3 activity in neurons receiving either treatment paradigm. However, the aforementioned effects were reversed when ADMSCs were pretreated with the inhibitor of exosomal secretion GW4869 or when Hrs was knocked down. In light of miR-25-3p being the most highly expressed miRNA in ADMSC-EVs interacting with the p53 pathway, further in vitro work focused on this pathway. Indeed, a miR-25-3p oligonucleotide mimic reduced cell death, whereas the anti-oligonucleotide increased autophagic flux and cell death by modulating p53-BNIP3 signalling in primary neurons exposed to OGD. Likewise, native ADMSC-EVs but not EVs obtained from ADMSCs pretreated with the anti-miR-25-3p oligonucleotide (ADMSC-EVsanti-miR-25-3p) confirmed the aforementioned in vitro observations in C57BL/6 mice exposed to cerebral ischemia. The infarct size was reduced, and neurological recovery was increased in mice treated with native ADMSC-EVs when compared to ADMSC-EVsanti-miR-25-3p. ADMSCs induce neuroprotection by improved autophagic flux through secreted EVs containing miR-25-3p. Hence, our work uncovers a novel key factor in naturally secreted ADMSC-EVs for the regulation of autophagy and induction of neuroprotection in a preclinical stroke model.

Keywords: autophagy; cerebral ischemia; extracellular vesicles, adipose‐derived MSCs; neurological recovery.


Conflict of interest statement

The authors declare to have no conflict of interest of any kind.

Figures

FIGURE 1
FIGURE 1
Characterization and purification of ADMSC‐EVs. Adipose‐derived mesenchymal stem cells (ADMSCs) were cultured under standard cell culture conditions, and conditioned cell medium (CCM) was obtained after passage three. CCM was used for the enrichment of extracellular vesicles (EVs) using either the differential centrifugation (i.e. ultracentrifugation, UC) or the polyethylene glycol (PEG) method. (a) Western blot analysis of EVs against exosomal markers of CD9, CD63, TSG101 and Alix, with albumin, TOMM20 and Histones being used as negative markers. Western blots were performed on total cell lysates (cells), EV lysates (UC and PEG) and the CCM. (b) Nanoparticle tracking analysis (NTA) from enriched EVs (UC and PEG) depicting size distribution patterns. (c) Representative transmission electron microscopy (TEM) analysis from EVs enriched by either UC or the PEG method. Scale bar, 100 nm. (d) Resuspended EVs isolated by UC or PEG were allowed to float into an overlayed iodixanol gradient to purify and isolate the small extracellular vesicle (sEV) population. (e) The iodixanol cushion gradient fractions for UC and PEG were analysed by Western blotting (fraction 1–10) using exosome markers. Equivalent volumes of each fraction were loaded per lane. Representative images were shown for CD9, CD63 and Alix which were enriched in fraction seven. (f) NTA was used to assess EV concentrations for each fraction (fraction 1–10). The two‐tailed independent Student's t‐test was used. (g) Representative size distribution of EVs isolated by UC or PEG from their corresponding fraction seven gradients. (h) Western blotting against EV markers (CD9, CD63, and Alix) were performed on ADMSC‐EVs isolated by UC or PEG after (or without, Con) size exclusion chromatography (SEC) purification. (i) The size analysis of SEC purified EVs (UC and PEG) was again done by means of NTA
FIGURE 2
FIGURE 2
ADMSC‐EVs protect neurons from oxygen‐glucose deprivation (OGD) injury through autophagy regulation. Neuroprotective effects of ADMSC‐EVs in cultivated mouse primary cortical neurons were detected by cell viability assays. Primary neurons were incubated for 4 days as mentioned in the materials and methods part. (a) Cell viability was analysed in primary neurons exposed to 4, 8 and 10 h of OGD followed by 24 h of reoxygenation using the MTT assay (n = 3). Cells incubated under standard cell culture conditions (‘Normoxia’) were defined as 100 % cell survival. (b‐c) Both qualitative and quantitative analysis of autophagy levels as indicated by the abundance of the autophagy associated protein LC3‐II under the aforementioned time points (n = 3). Cells incubated under standard cell culture conditions (‘’Normoxia ’) were used as negative control. (d) The neuroprotective effect of ADMSC‐EVs in cultured primary neurons was evaluated by the MTT assay. After 4 days of cell culture, cells were exposed to 10 h of OGD followed by 24 h of reoxygenation, as mentioned by “OGD” for the later assays. Cell viability was analysed in neurons incubated with either PBS (Control), ADMSCs (Co‐culture) or ADMSC‐EVs (EVs) isolated by UC or PEG after induction of OGD followed by reoxygenation. PBS, ADMSCs and EVs were given at the beginning of both hypoxia and reoxygenation. Cells incubated under standard cell culture conditions (Normoxia) were defined as 100 % cell survival (n = 3). (e‐f) LC3 levels were evaluated by Western blotting in OGD exposed primary neurons treated with ADMSCs (Co‐culture) or ADMSC‐EVs isolated by UC or PEG. ADMSCs and EVs were given at the beginning of both hypoxia and reoxygenation. Neurons treated with PBS under OGD conditions served as positive control (Control). Cells incubated under standard cell culture conditions (Normoxia) were used as negative control (n = 3). A representative Western blot is shown in (e), whereas the quantitative analysis for LC3‐II is shown in (f). One‐way ANOVA followed by the Tukey's post‐hoc‐test was used. Data are shown as mean ± SD. Data are statistically different from each other with *P < 0.05, **P < 0.01, and ***P < 0.001
FIGURE 3
FIGURE 3
ADMSC‐EVs inhibit autophagic flux and increase cell viability through p53 and BNIP3 signalling. (A‐B) Assessment of the autophagic flux was done using bafilomycin A1 (BafA1) in the aforementioned groups (Normoxia, Control, Co‐culture and EVs). BafA1 was added 3 h before harvesting the cells. LC3 levels were evaluated again by Western blotting in the presence of DMSO or BafA1 (n = 3). Quantitative analysis of LC3‐II blotting is shown in (b). (c‐d) Autophagosomes (yellow) and autolysosomes (red) were detected in OGD‐exposed primary neurons that express mRFP‐GFP‐LC3. The neurons were treated with PBS or ADMSC‐EVs. PBS and EVs were given at the beginning of hypoxia and reoxygenation. Cells incubated under standard cell culture conditions (Normoxia) were used as negative control. Scale bar, 10 μm. The number of autophagosomes and autolysosomes in each cell (20‐30 cells per group) was quantified in (d) (n = 3). (e) The impact of autophagy on neuronal survival after OGD was evaluated using different concentrations of the autophagy inhibitor 3‐MA in comparison to neurons treated with the solvent DMSO using the MTT assay. ADMSC‐EVs together with different concentrations of the autophagy stimulator rapamycin (E+R; n = 3) were also used on primary neurons exposed to OGD. All the drugs were given twice, at the beginning of hypoxia and reoxygenation. Cells incubated under standard cell culture conditions (Normoxia) were defined as 100 % cell survival. (f‐g) Both p53 and BNIP3 were evaluated by Western blotting in OGD exposed primary neurons treated with PBS, ADMSCs (Co‐culture) or ADMSC‐EVs (EVs). Neurons treated with PBS under OGD conditions served as positive control (Control). Cells incubated under standard cell culture conditions (Normoxia) were used as negative control (n = 3). EVs were given at the beginning of hypoxia and reoxygenation. The quantitative analysis of p53 and BNIP3 Western blotting is shown in (g). One‐way ANOVA followed by the Tukey's post‐hoc‐test, data are given as mean ± SD. Data are statistically different from each other with *P < 0.05, **P < 0.01, and ***P < 0.001
FIGURE 4
FIGURE 4
The regulation of the autophagic flux by ADMSC‐EVs depends on exosomes. (a) ADMSC‐derived EVs obtained from ADMSCs pre‐treated with DMSO, GW4869 or Hrs‐siRNA (knockdown, Hrs‐KD) were isolated by the PEG method. The quantification of EV numbers is shown in (A) (n = 5). (b‐c) LC3 levels were detected by Western blotting followed by densitometric analysis in primary neurons exposed to oxygen‐glucose‐deprivation (OGD). OGD‐exposed neurons were either incubated with EVs isolated from ADMSCs pre‐treated with the exosome secretion inhibitor GW4869 (GW4869) or with ADMSC‐derived EVs obtained from ADMSCs that were pre‐transfected with Hrs‐siRNA (Hrs‐KD). All experimental conditions were performed with or without the autophagic flux inhibitor BafA1 (n = 3). (d) Cell viability was examined in OGD‐exposed primary neurons that were treated with PBS, ADMSC‐EVs (EVs), ADMSC‐derived EVs obtained from ADMSCs that were pre‐transfected with Hrs‐siRNA (Hrs‐KD), ADMSCs treated with the exosome secretion inhibitor GW4869 (Co+GW) or ADMSC‐EVs isolated from conditioned medium containing GW4869 (EVs+GW; n = 3). Cells incubated under standard cell culture conditions (Normoxia) were defined as 100 % cell survival. (e‐f) OGD‐exposed neurons were either incubated with ADMSC‐derived EVs (EVs), ADMSCs pre‐treated with the exosome secretion inhibitor GW4869 (Co+GW), or with ADMSC‐derived EVs obtained from ADMSCs that were pretreated with GW4869 (EVs+GW). EVs, GW4869, EVs+GW were given at the beginning of both hypoxia and reoxygenation. All experimental conditions were performed with or without the autophagic flux inhibitor BafA1 (n = 3). BafA1 was added 3 h before harvesting the cells. (g‐h) P53 and BNIP3 were quantified by Western blotting in OGD‐exposed primary neurons co‐incubated with PBS, ADMSC‐EVs (EVs), ADMSCs with GW4869 (Co+GW) or with EVs isolated from ADMSCs pre‐treated with GW4869 (EVs+GW; n = 3). Quantitative analysis of p53 and BNIP3 is shown (h). One‐way ANOVA followed by the Tukey's post‐hoc‐test was used, data are shown as mean ± SD. Data are statistically different from each other with *P < 0.05, **P < 0.01, and ***P < 0.001
FIGURE 5
FIGURE 5
ADMSCs regulate autophagy and induce neuroprotection by miR‐25‐3p. (a) Real time Quantitative Polymerase chain reaction (qRT‐PCR) quantification of miRNA concentrations in EVs obtained from ADMSCs as stated in the materials and methods section. (b) Levels of miR‐25‐3p were detected in ADMSC‐EVs that were pretreated either RNase A (+RNase), the detergent Triton X‐100 (+Triton X), both of them (+RNase+Triton X), or with the solvent alone (Control) (n = 3). (c) Levels of cellular miR‐25‐3p were measured in primary neurons treated with PBS or ADMSC‐EVs in the OGD model by qRT‐PCR. PBS and EVs were given at the beginning of hypoxia and reoxygenation. Data refer to neurons cultured under standard cell culture conditions (Normoxia). (d) Cell viability was examined in primary neurons exposed to OGD that were treated with PBS, EVs obtained from normal ADMSCs (EVs), EVs isolated from ADMSCs that were pretreated with anti‐miR‐25‐3p (EVsanti‐miR‐25) or with EVs isolated from ADMSCs that were pretreated with scramble (EVsNC; n = 3). All of them were given at the beginning of hypoxia and reoxygenation. Cells incubated under standard cell culture conditions (Normoxia) were defined as 100 % cell survival. (e‐f) Western blot identification for LC3 in primary neurons after incubation with different EVs, i.e., EVs isolated from normal ADMSCs (EVs), EVs obtained from ADMSCs that were pretreated with anti‐miR‐25‐3p (EVsanti‐miR‐25) or with EVs isolated from ADMSCs that were pretreated with scramble (EVsNC). OGD experiments were performed with or without BafA1 under each condition (n = 3). Quantitative analysis of LC3‐II is shown in (f). (g‐h) Autophagosomes and autolysosomes were detected in EVsanti‐miR‐25‐treated primary neurons or in EVsNC‐treated neurons that expressed mRFP‐GFP‐LC3 under OGD conditions. The number of autophagosomes and autolysosomes in each cell (20‐30 cells per group) was quantified (n = 3). EVsanti‐miR‐25 and EVsNC were given twice as mentioned before. Scale bar, 10 μm. The two‐tailed independent Student's t‐test was used in H. One‐way ANOVA followed by the Tukey's post‐hoc‐test was used except for H, data are shown as mean ± SD. Data are statistically different from each other with *P < 0.05, **P < 0.01, and ***P < 0.001
FIGURE 6
FIGURE 6
EV‐induced regulation of autophagy reduces post‐stroke brain injury and improves neurological recovery. (a) Representative immunofluorescence images displaying the biodistribution of ADMSC‐EVs within the ischemic hemisphere. DiI (red spots), NeuN (green) and DAPI (blue). Scale bars, 25 μm. (b‐c) Neuroprotective effects of ADMSC‐EVs in mice exposed to 1 h of middle cerebral artery occlusion (MCAO) followed by 24 h of reperfusion were evaluated by TTC staining. ADMSC‐EVs were injected at the beginning of the reperfusion (EVs 0 h) or at 12 h after reperfusion (EVs 12 h). Mice treated with PBS served as control (n = 8 per group). Quantitative analysis of the infarct size is shown in (c). (d‐e) Mice (n = 10 per condition) were exposed to 1 h of MCAO with subsequent reperfusion for 14 days during which the corner turn test (d) and the tight rope test (e) were performed. Mice received systemic delivery of ADMSC‐EVs or of 3‐MA (15 mg/kg) immediately at the beginning of the reperfusion (EVs 0 h) or 12 h after reperfusion (EVs 12 h). Control mice received PBS only. Motor coordination tests were done at 4, 7, 10 and 14 days after cerebral ischemia. Both EVs 0 h and EVs 12 h groups showed significant improvement in the tight rope test compared to the PBS control group. On day fourteen, only EVs 0 h significantly improved tight rope performance. In the corner turn test, the EVs 0 h and 12 h group showed improvement on day seven, ten and fourteen compared to the PBS control group, and the 3‐MA 12 h group showed improvement on day seven and day ten compared to the PBS control group. (f‐g) The neuronal density was measured in mice treated with PBS (Control), ADMSC‐EVs or of 3‐MA. EVs and 3‐MA were systemically injected at the beginning of the reperfusion or 12 h after reperfusion. NeuN staining within the ischemic lesion site was done on day 14 (n = 10 per group). Scale bars, 50 μm. (g‐h) The autophagic flux was evaluated with BafA1 in MCAO mice that received 3‐MA injection immediately at the beginning of (3‐MA 0 h) or 12 h after reperfusion (3‐MA 12 h). PBS was given to control animals (n = 6 per group). Quantitative analysis of LC3‐II is shown (h). One‐way ANOVA followed by the Tukey's post‐hoc‐test was used, data are shown as mean ± SD. Data are statistically different from each other with *P < 0.05, **P < 0.01, and ***P < 0.001
FIGURE 7
FIGURE 7
Loss of miR‐25‐3p in ADMSC‐EVs diminishes post‐stroke EV‐induced regulation of autophagy and neuroprotection. (a‐b) The autophagic flux was evaluated with BafA1 in MCAO (middle cerebral artery occlusion) mice that either received PBS or ADMSC‐EVs 12 h after the induction of ischemic stroke, including ADMSC‐EVs, ADMSC‐EVsNC, and ADMSC‐EVsanti‐miR‐25 (n = 6 per group). BafA1 was injected 3 h before sacrifice. Quantitative analysis of LC3‐II is shown in (b). (c‐d) Motor coordination was evaluated by the tight rope test and by the corner turn test at four, seven, ten and fourteen days after cerebral ischemia to verify the effects of ADMSC‐EVsNC and ADMSC‐EVsanti‐miR‐25 in MCAO animals compared to PBS group. In the corner turn test, the EVsNC group showed improvement on day seven, ten and fourteen compared with PBS control group. The EVsNC group showed improvement on day seven and day ten compared to the EVsanti‐miR‐25 group. EVsNC group showed significant improvement in the tight rope test compared to the PBS control group. EVsNC groups also showed significant better tight rope performance compared to EVsanti‐miR‐25 on day ten and fourteen. (e‐f) The neuronal density in ADMSC‐EVsNC and ADMSC‐EVsanti‐miR‐25 was measured on day fourteen as indicated by NeuN staining within the ischemic lesion site (n = 10 per group). The quantitative analysis of neuronal density is shown in (f). Scale bars, 50 μm. The two‐tailed independent Student's t‐test was used in. One‐way ANOVA followed by the Tukey's post‐hoc‐test was used except for F, data are shown as mean ± SD. Data are statistically different from each other with *P < 0.05, **P < 0.01, and ***P < 0.001
FIGURE 8
FIGURE 8
A schematic diagram showing the role of miR‐25‐3p derived from ADMSC‐EVs in a preclinical stroke model. ADMSCs release EVs enriched with miR‐25‐3p, which are uptaken by neurons. In neurons, miR‐25‐3p induces degradation of the mRNA of p53, resulting in the downregulation of the p53 protein level and subsequent reduction of BNIP3. The inhibition of BNIP3, in turn, further reduces the levels of autophagy which exerts the neuroprotective effect

References

    1. Abels, E. R. , & Breakefield, X. O. (2016). Introduction to extracellular vesicles: Biogenesis, RNA cargo selection, content, release, and uptake. Cellular and Molecular Neurobiology, 36(3), 301–312. - PMC - PubMed
    1. Ahmadian Kia, N. , Bahrami, A. R. , Ebrahimi, M. , Matin, M. M. , Neshati, Z. , Almohaddesin, M. R. , … Bidkhori, H. R. (2011). Comparative analysis of chemokine receptor's expression in mesenchymal stem cells derived from human bone marrow and adipose tissue. Journal of Molecular Neuroscience, 44(3), 178–185. - PubMed
    1. Althaus, J. , Bernaudin, M. , Petit, E. , Toutain, J. , Touzani, O. , & Rami, A. (2006). Expression of the gene encoding the pro‐apoptotic BNIP3 protein and stimulation of hypoxia‐inducible factor‐1alpha (HIF‐1alpha) protein following focal cerebral ischemia in rats. Neurochemistry International, 48(8), 687–695. - PubMed
    1. Bang, O. Y. , & Kim, E. H. (2019). Mesenchymal stem cell‐derived extracellular vesicle therapy for stroke: Challenges and progress. Frontiers in Neurology, 10, 211. - PMC - PubMed
    1. Baraniak, P. R. , & Mcdevitt, T. C. (2010). Stem cell paracrine actions and tissue regeneration. Regenerative Medicine, 5(1), 121–143. - PMC - PubMed

Publication types