

doi: 10.1016/j.kisu.2020.09.001.
Epub 2020 Dec 1.
China Kidney Disease Network (CK-NET) 2016 Annual Data Report
Affiliations
- PMID: 33304640
- PMCID: PMC7716083
- DOI: 10.1016/j.kisu.2020.09.001
Item in Clipboard
China Kidney Disease Network (CK-NET) 2016 Annual Data Report
Kidney Int Suppl (2011).
2020 Dec.
No abstract available
Figures
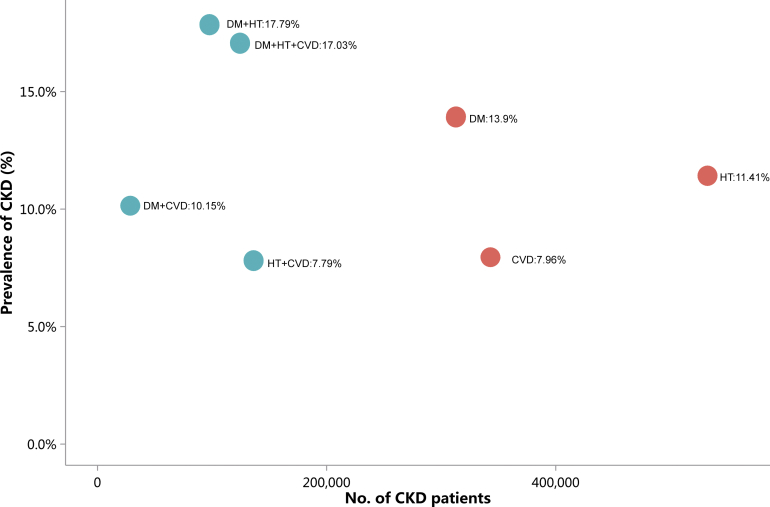
Prevalence of CKD among different types of underlying disease. CKD, chronic kidney disease; CVD, cardiovascular disease; DM, diabetes mellitus; HT, hypertension.
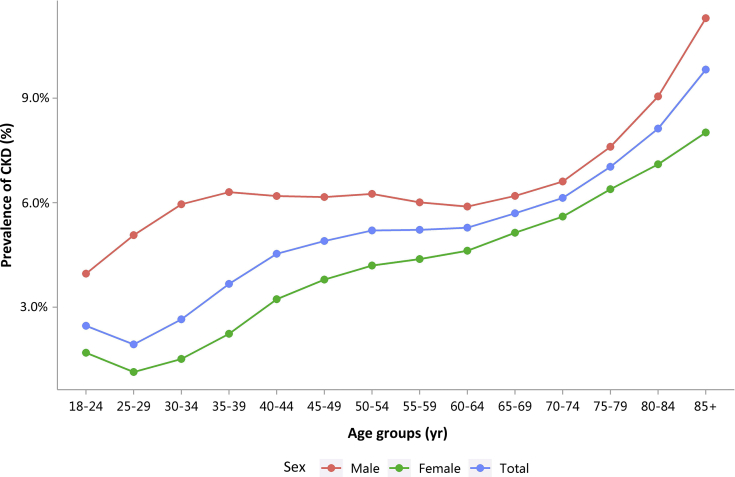
Patients with CKD, stratified by sex and age. CKD, chronic kidney disease.
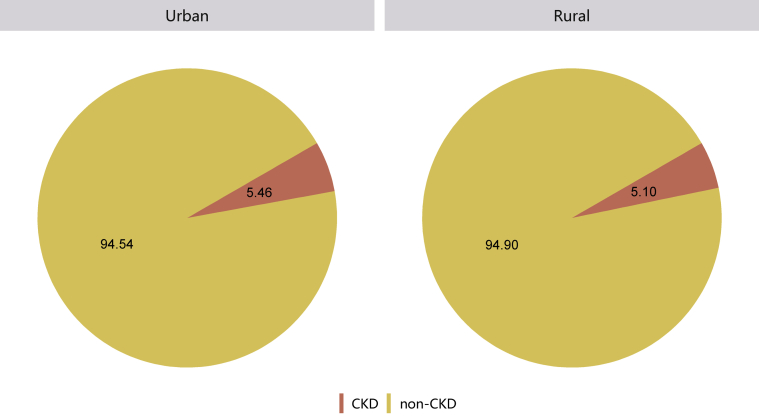
Patients with CKD, stratified by urban versus rural area (percent values). CKD, chronic kidney disease.
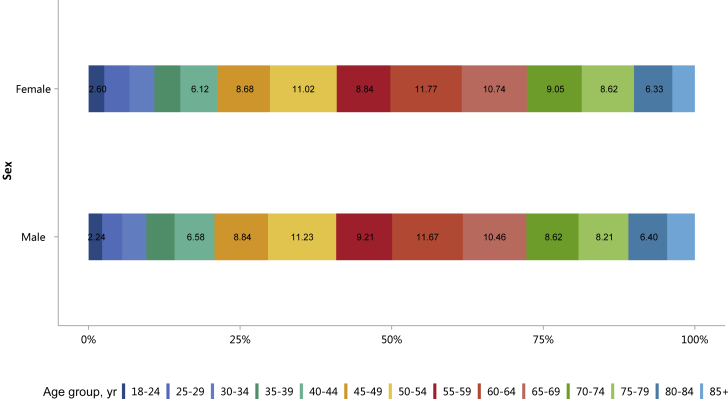
Age distribution of patients with CKD, stratified by sex. CKD, chronic kidney disease.
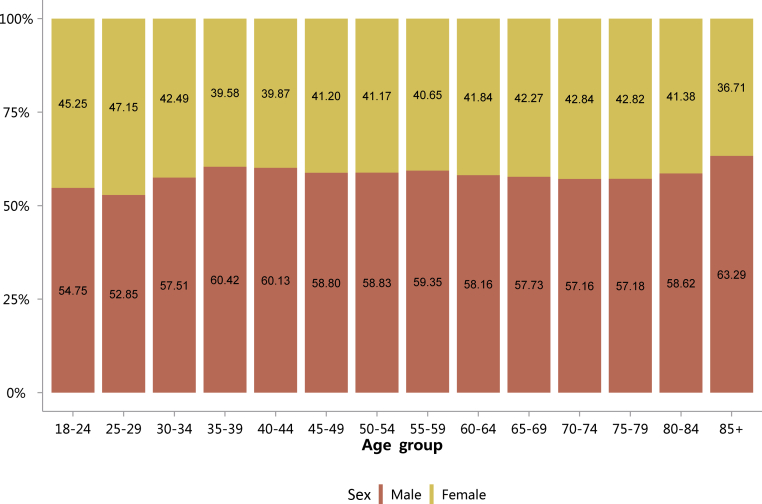
Sex distribution of patients with CKD, stratified by age. Digits in columns represent percent values. CKD, chronic kidney disease.
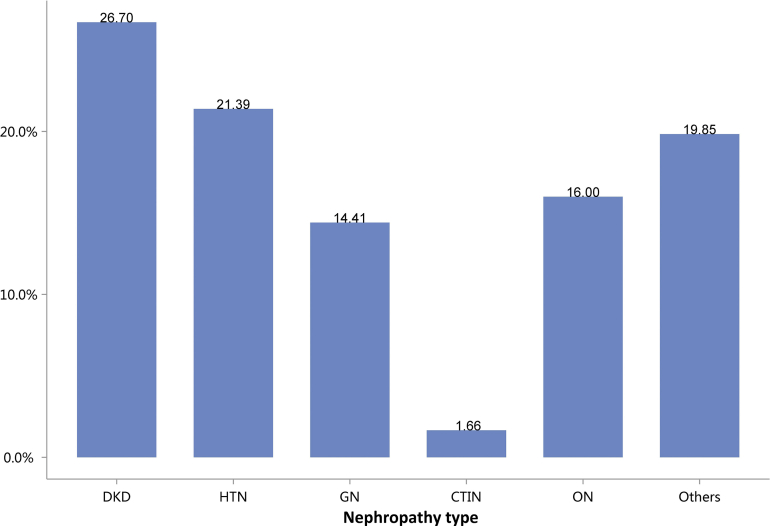
Cause distribution of patients with CKD. Digits above columns represent percent values. CKD, chronic kidney disease; CTIN, chronic tubulointerstitial nephropathy; DKD, diabetic kidney disease; GN, glomerulonephritis; HTN, hypertensive nephropathy; ON, obstructive nephropathy; Others, CKD due to other reasons.
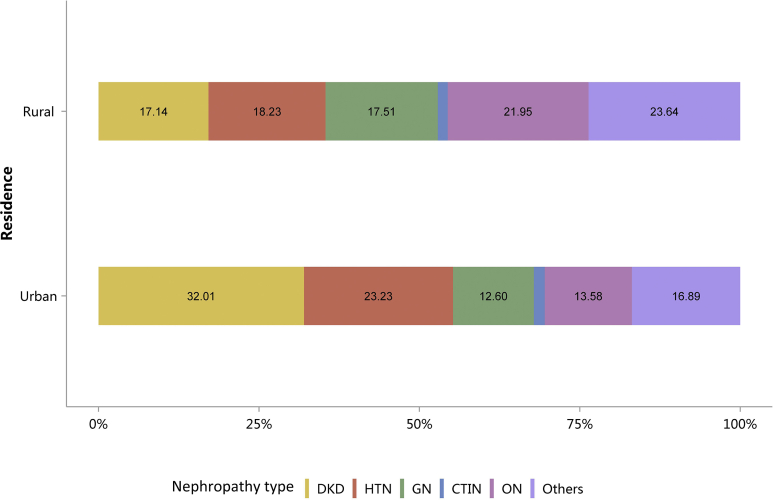
Cause of patients with CKD, stratified by urban versus rural area. Digits above columns represent percent values. CKD, chronic kidney disease; CTIN, chronic tubulointerstitial nephropathy; DKD, diabetic kidney disease; GN, glomerulonephritis; HTN, hypertensive nephropathy; ON, obstructive nephropathy; Others, CKD due to other reasons.
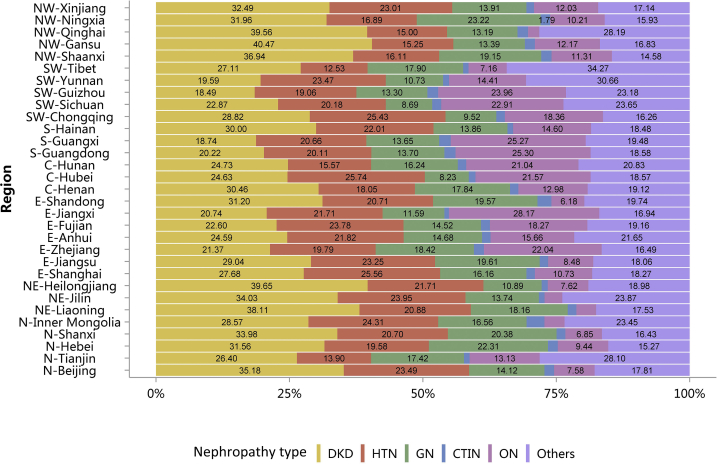
Cause of patients with CKD, stratified by geographic region. C, Central China; CKD, chronic kidney disease; CTIN, chronic tubulointerstitial nephropathy; DKD, diabetic kidney disease; E, East China; GN, glomerulonephritis; HTN, hypertensive nephropathy; N, North China; NE, Northeast China; NW, Northwest China; ON, obstructive nephropathy; Others, CKD due to other reasons; S, South China; SW, Southwest China.
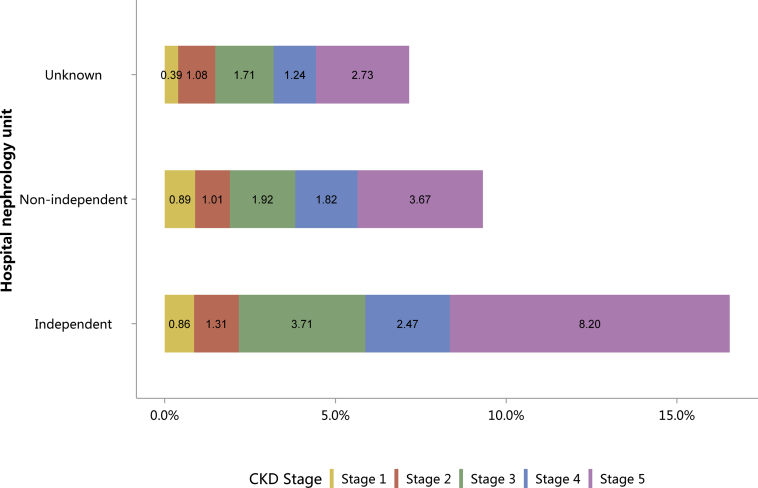
Staging of CKD, stratified by hospital nephrology unit. CKD, chronic kidney disease.
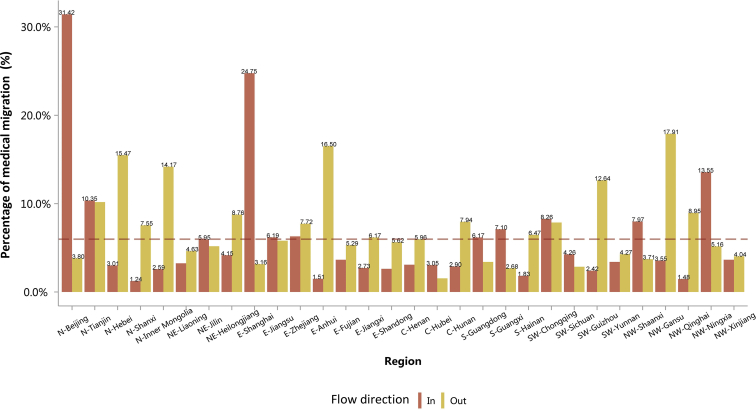
The travel pattern of patients with CKD. Reference line represents the overall percentage of flow of CKD (5.98%). C, Central China; CKD, chronic kidney disease; E, East China; N, North China; NE, Northeast China; NW, Northwest China; S, South China; SW, Southwest China.
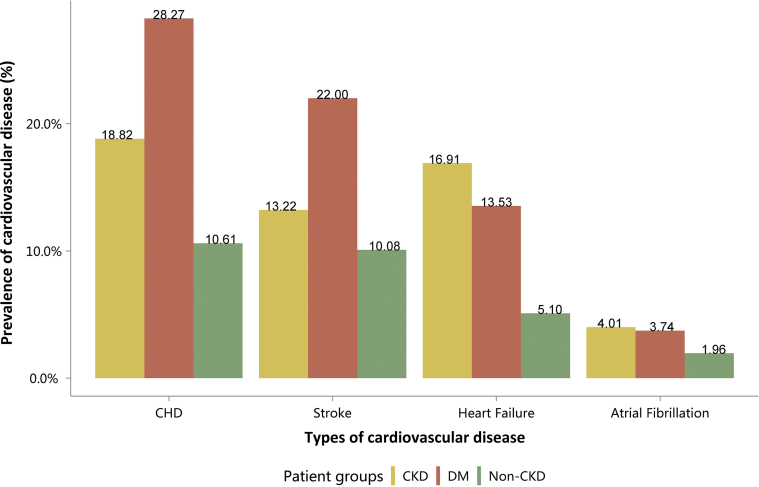
Prevalence of CVD, stratified by patient group. CHD, coronary heart disease; CKD, chronic kidney disease; CVD, cardiovascular disease; DM, diabetes mellitus.
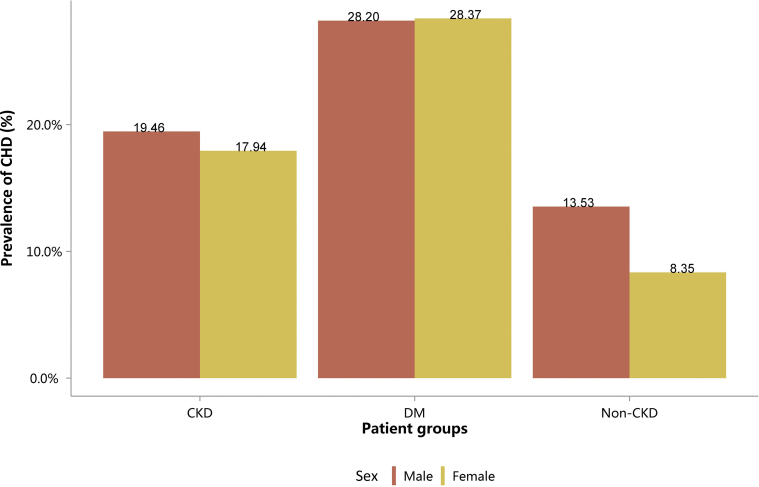
Prevalence of CHD, stratified by sex. CHD, coronary heart disease; CKD, chronic kidney disease; DM, diabetes mellitus.
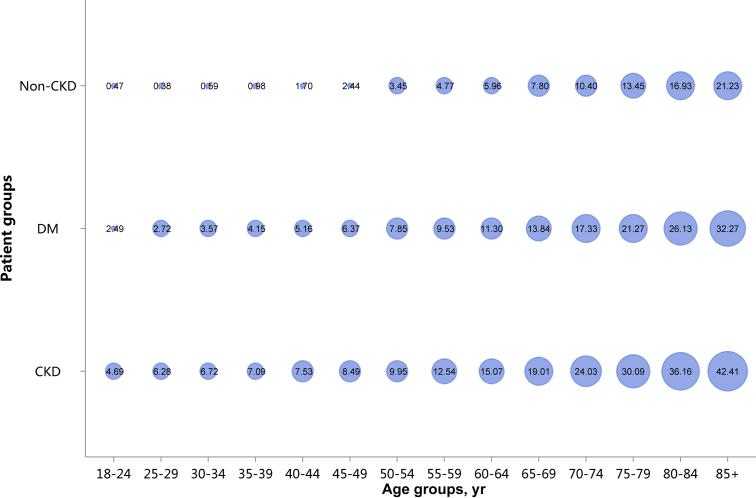
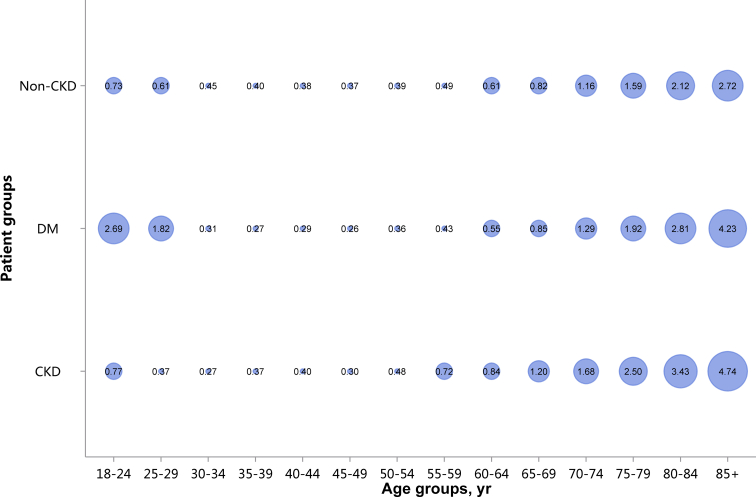
Prevalence of CHD, stratified by age. Point size refers to the percentage of CHD. CHD, coronary heart disease; CKD, chronic kidney disease; DM, diabetes mellitus.
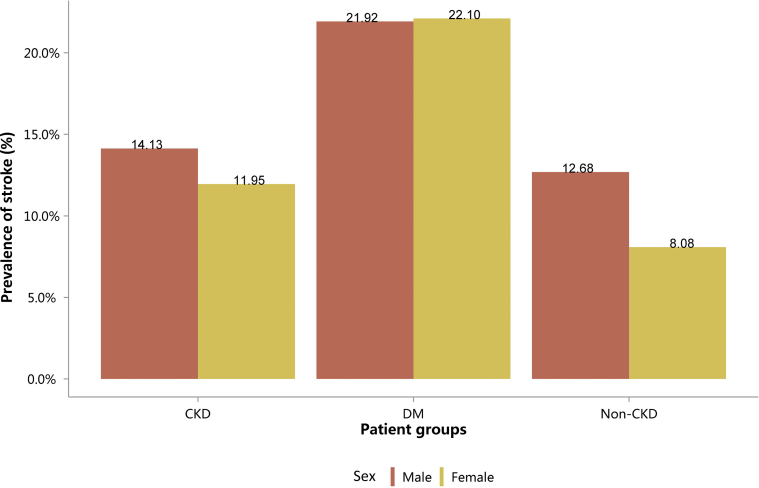
Prevalence of stroke, stratified by sex. CKD, chronic kidney disease; DM, diabetes mellitus.
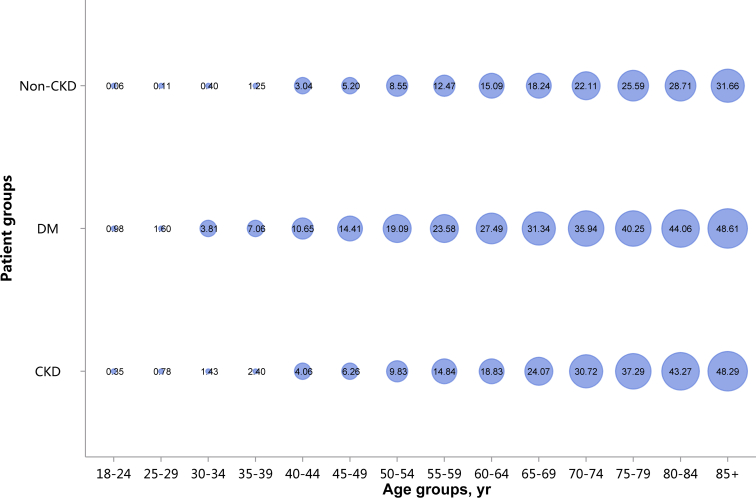
Prevalence of stroke, stratified by age. Point size refers to the percentage of stroke. CKD, chronic kidney disease; DM, diabetes mellitus.
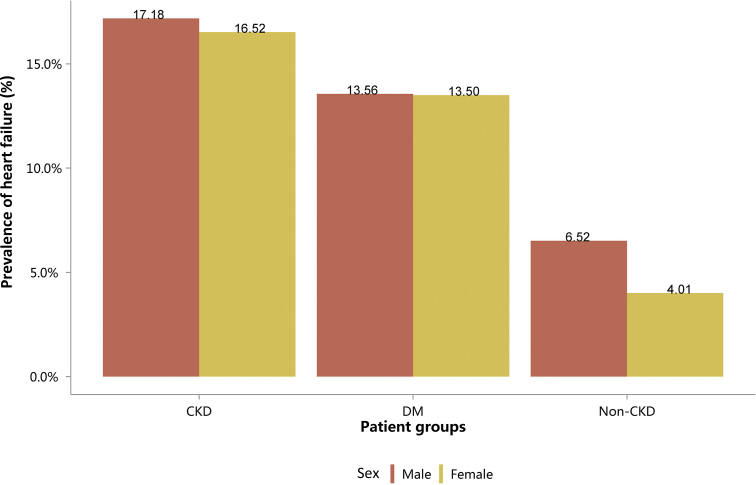
Prevalence of heart failure, stratified by sex. CKD, chronic kidney disease; DM, diabetes mellitus.
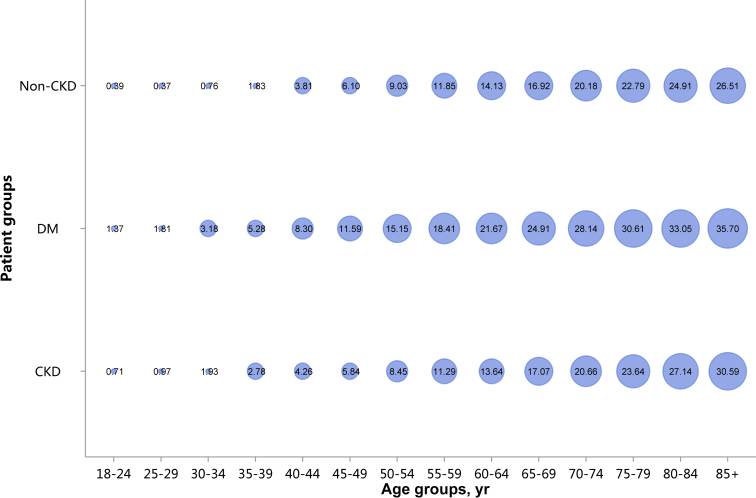
Prevalence of heart failure, stratified by age. Point size refers to the percentage of heart failure. CKD, chronic kidney disease; DM, diabetes mellitus.
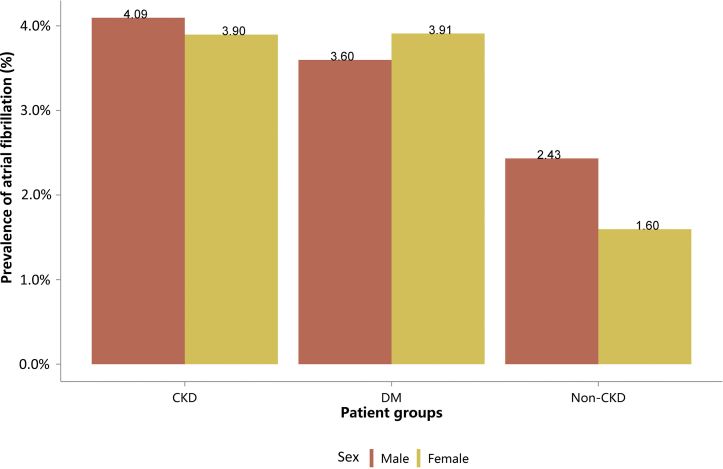
Prevalence of atrial fibrillation, stratified by sex. CKD, chronic kidney disease; DM, diabetes mellitus.
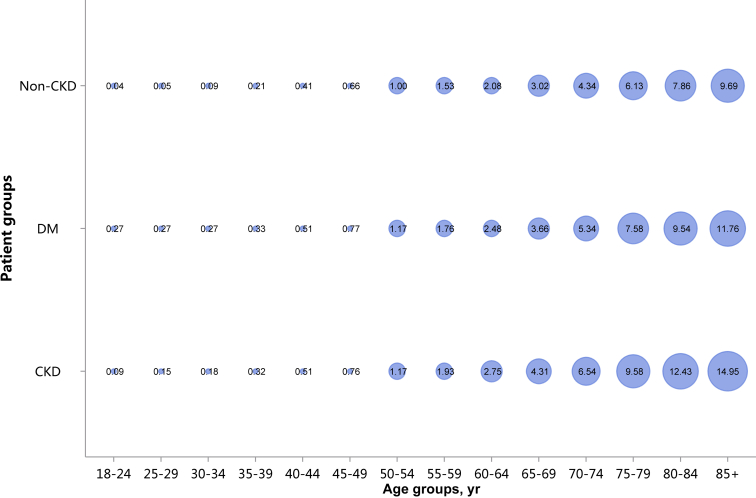
Prevalence of atrial fibrillation, stratified by age. Point size refers to the percentage of atrial fibrillation. CKD, chronic kidney disease; DM, diabetes mellitus.
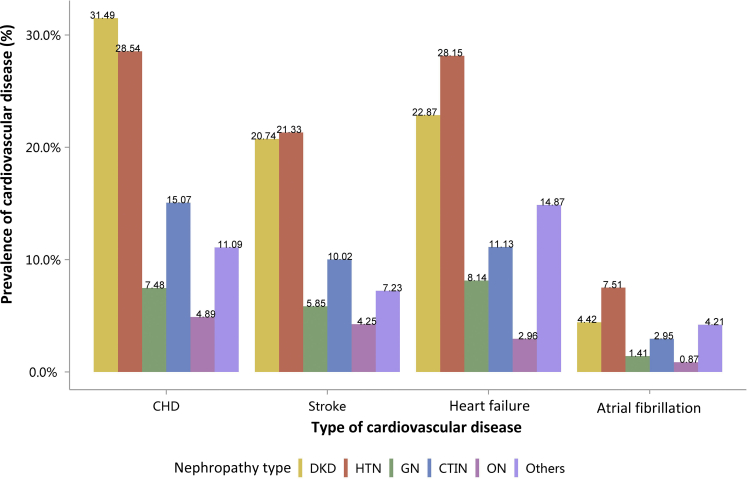
Prevalence of CVD among patients with CKD. CHD, coronary heart disease; CKD, chronic kidney disease; CTIN, chronic tubulointerstitial nephropathy; CVD, cardiovascular disease; DKD, diabetic kidney disease; GN, glomerulonephritis; HTN, hypertensive nephropathy; ON, obstructive nephropathy; Others, CKD due to other reasons.
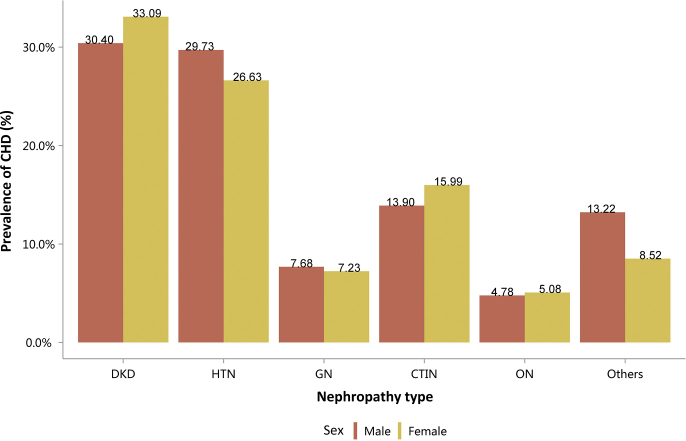
Prevalence of CHD among patients with CKD, stratified by nephropathy type and sex. CHD, coronary heart disease; CKD, chronic kidney disease; CTIN, chronic tubulointerstitial nephropathy; DKD, diabetic kidney disease; GN, glomerulonephritis; HTN, hypertensive nephropathy; ON, obstructive nephropathy; Others, CKD due to other reasons.
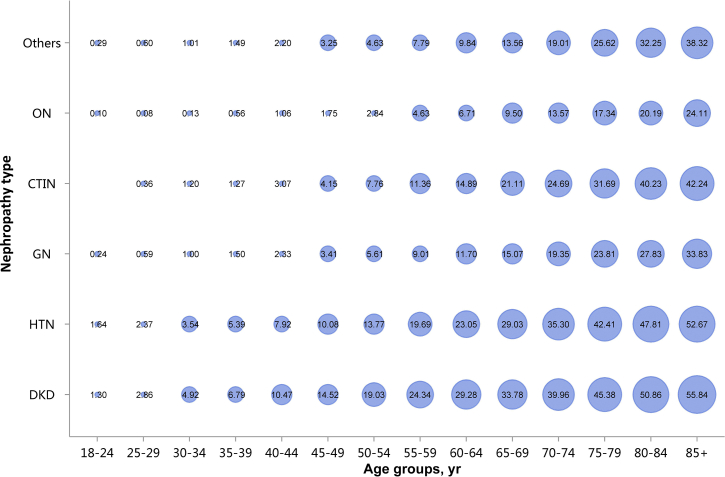
Prevalence of CHD among patients with CKD, stratified by nephropathy type and age. Point size refers to the percentage of CHD. CHD, coronary heart disease; CKD, chronic kidney disease; CTIN, chronic tubulointerstitial nephropathy; DKD, diabetic kidney disease; GN, glomerulonephritis; HTN, hypertensive nephropathy; ON, obstructive nephropathy; Others, CKD due to other reasons.
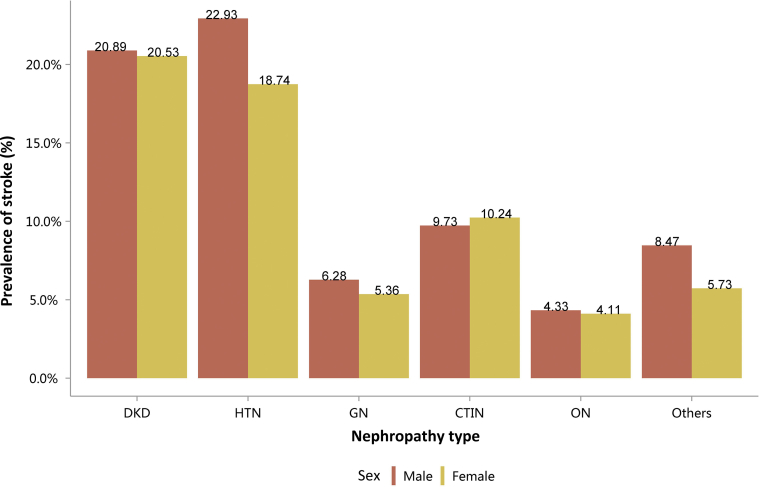
Prevalence of stroke among patients with CKD, stratified by nephropathy type and sex. CKD, chronic kidney disease; CTIN, chronic tubulointerstitial nephropathy; DKD, diabetic kidney disease; GN, glomerulonephritis; HTN, hypertensive nephropathy; ON, obstructive nephropathy; Others, CKD due to other reasons.
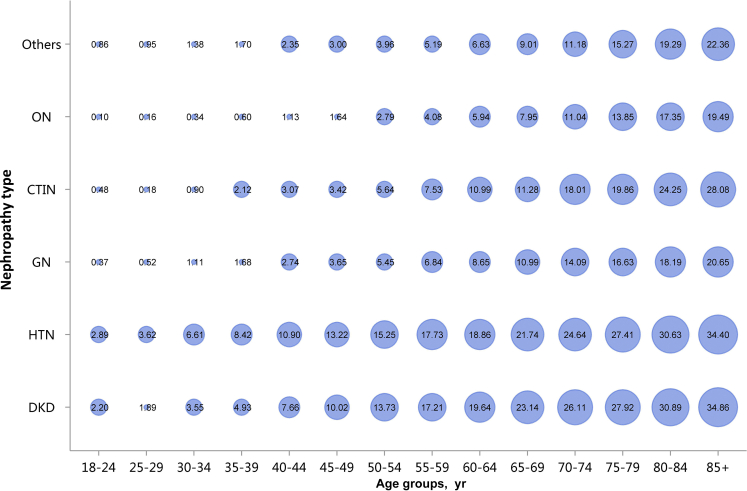
Prevalence of stroke among patients with CKD, stratified by nephropathy type and age. Point size refers to the percentage of stroke. CKD, chronic kidney disease; CTIN, chronic tubulointerstitial nephropathy; DKD, diabetic kidney disease; GN, glomerulonephritis; HTN, hypertensive nephropathy; ON, obstructive nephropathy; Others, CKD due to other reasons.
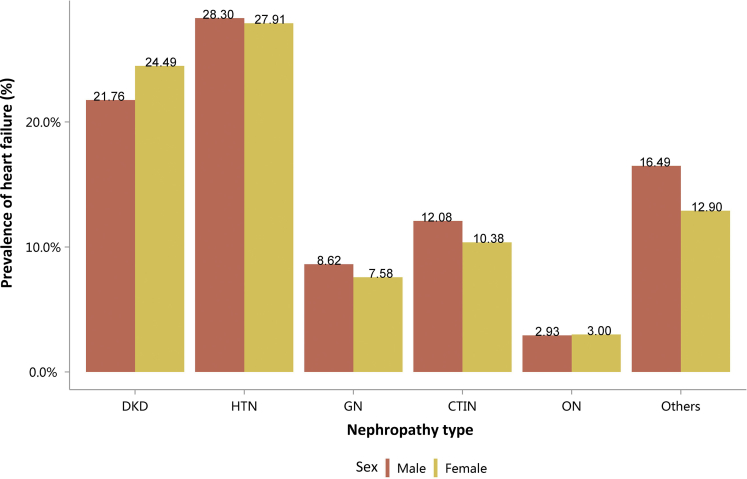
Prevalence of heart failure among patients with CKD, stratified by nephropathy type and sex. CKD, chronic kidney disease; CTIN, chronic tubulointerstitial nephropathy; DKD, diabetic kidney disease; GN, glomerulonephritis; HTN, hypertensive nephropathy; ON, obstructive nephropathy; Others, CKD due to other reasons.
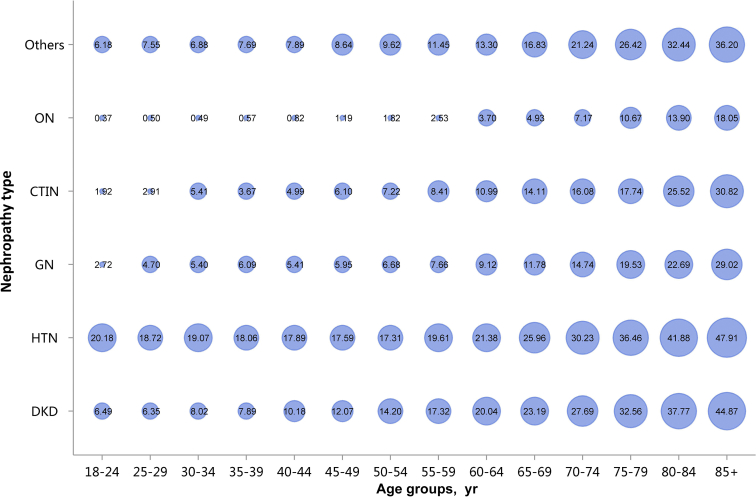
Prevalence of heart failure among patients with CKD, stratified by nephropathy type and age. Point size refers to the percentage of heart failure. CKD, chronic kidney disease; CTIN, chronic tubulointerstitial nephropathy; DKD, diabetic kidney disease; GN, glomerulonephritis; HTN, hypertensive nephropathy; ON, obstructive nephropathy; Others, CKD due to other reasons.
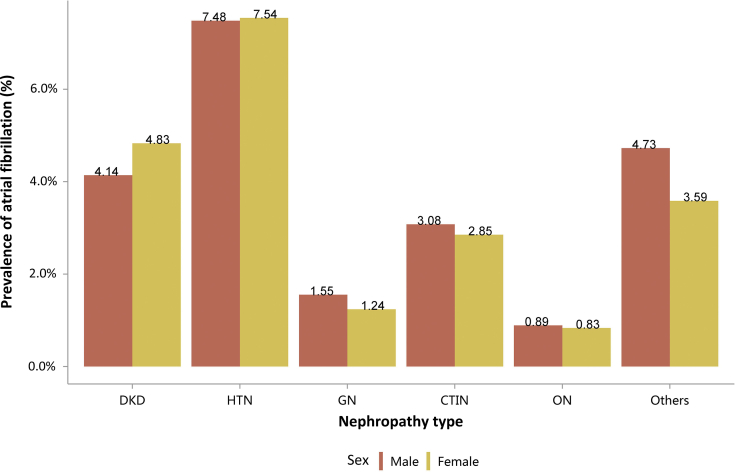
Prevalence of atrial fibrillation among patients with CKD, stratified by nephropathy type and sex. CKD, chronic kidney disease; CTIN, chronic tubulointerstitial nephropathy; DKD, diabetic kidney disease; GN, glomerulonephritis; HTN, hypertensive nephropathy; ON, obstructive nephropathy; Others, CKD due to other reasons.
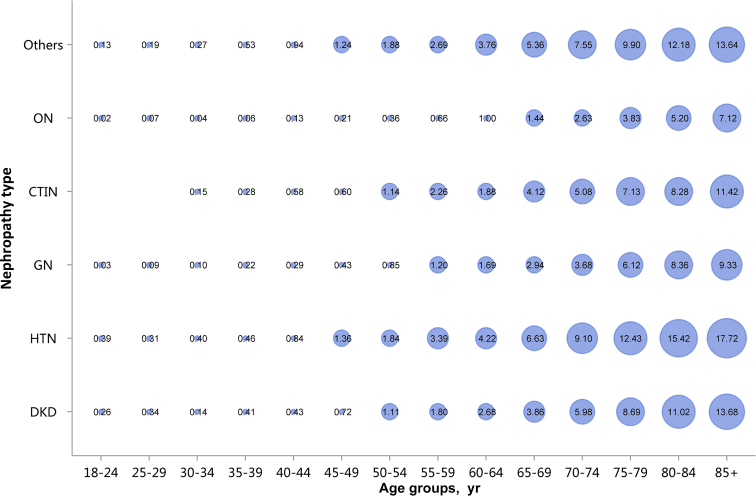
Prevalence of atrial fibrillation among patients with CKD, stratified by nephropathy type and age. Point size refers to the percentage of atrial fibrillation. CKD, chronic kidney disease; CTIN, chronic tubulointerstitial nephropathy; DKD, diabetic kidney disease; GN, glomerulonephritis; HTN, hypertensive nephropathy; ON, obstructive nephropathy; Others, CKD due to other reasons.
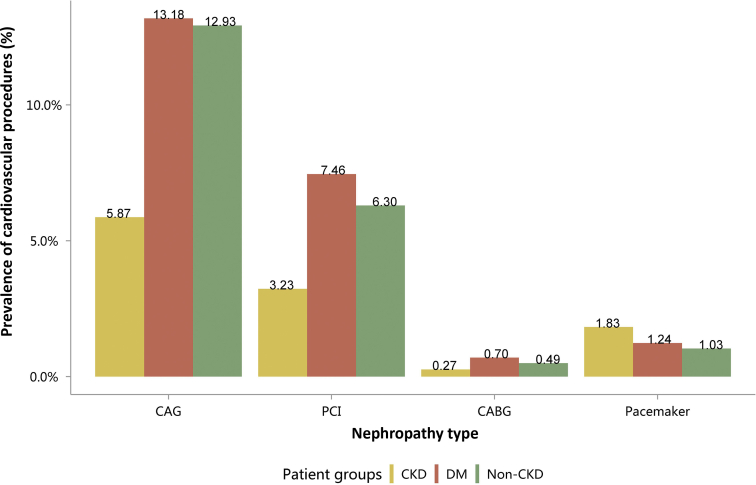
Cardiovascular procedures stratified by patient group. CABG, coronary artery bypass grafting; CAG, coronarography; CKD, chronic kidney disease; DM, diabetes mellitus; PCI, percutaneous coronary intervention.
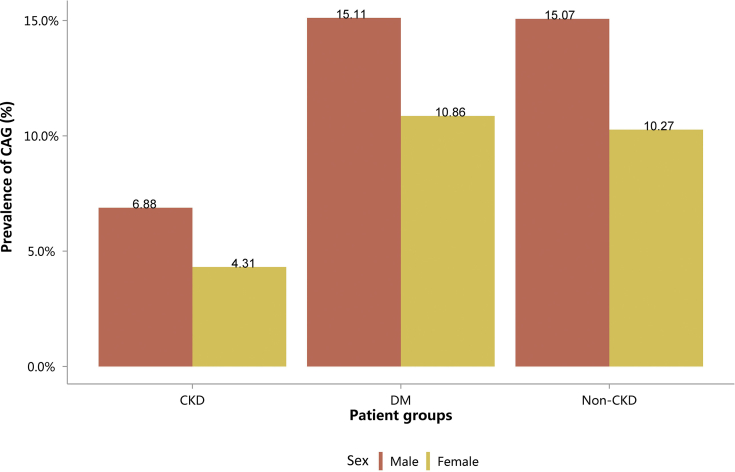
Cardiovascular procedure: CAG, stratified by sex. CAG, coronarography; CKD, chronic kidney disease; DM, diabetes mellitus.
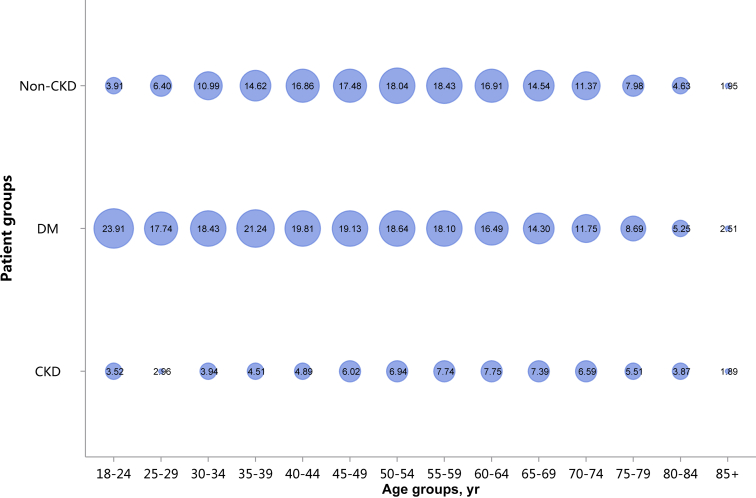
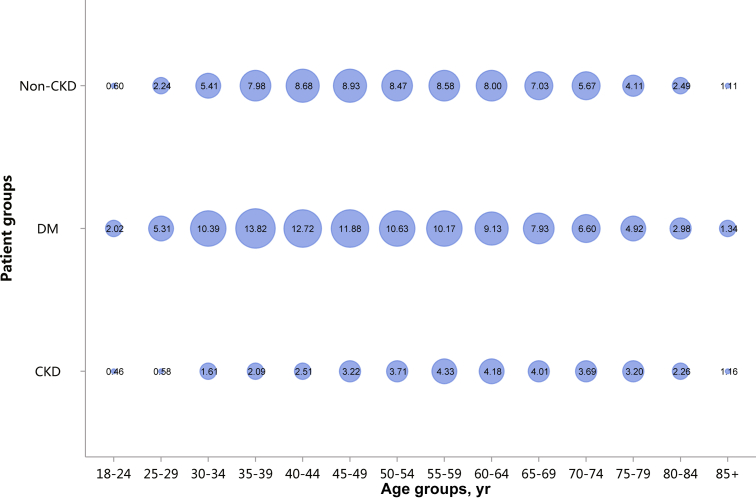
Cardiovascular procedure: CAG, stratified by age. CAG, coronarography; CKD, chronic kidney disease; DM, diabetes mellitus. Point size refers to the percentage of CAG.
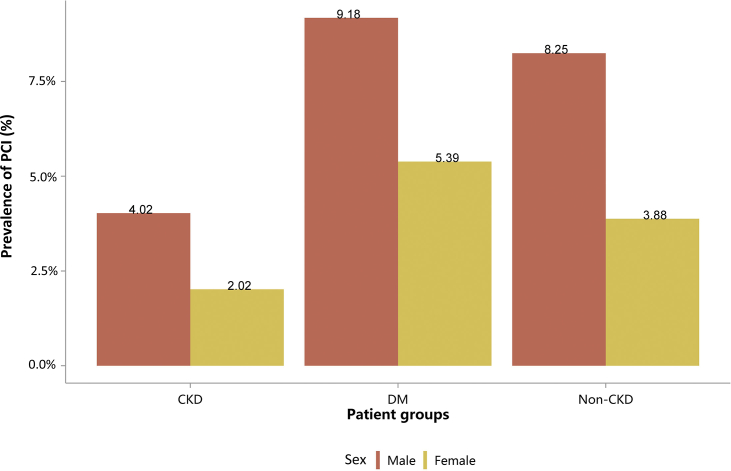
Cardiovascular procedure: PCI, stratified by sex. CKD, chronic kidney disease; DM, diabetes mellitus; PCI, percutaneous coronary intervention.
Cardiovascular procedure: PCI, stratified by age. CKD, chronic kidney disease; DM, diabetes mellitus; PCI, percutaneous coronary intervention. Point size refers to the percentage of PCI.
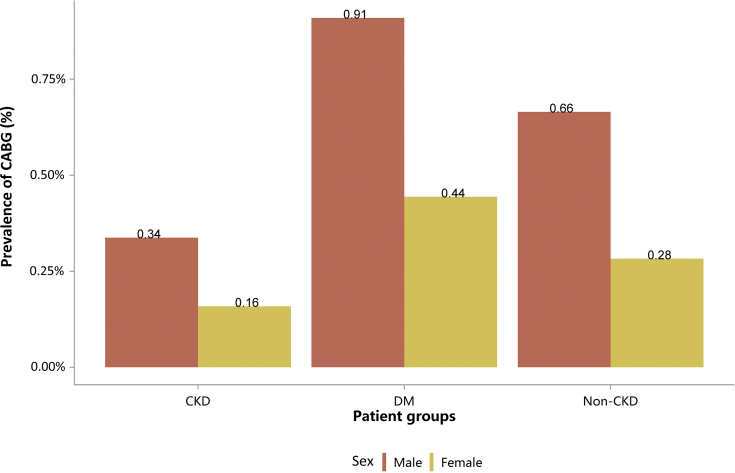
Cardiovascular procedure: CABG, stratified by sex. CABG, coronary artery bypass grafting; CKD, chronic kidney disease; DM, diabetes mellitus.
Cardiovascular procedure: CABG, stratified by age. CABG, coronary artery bypass grafting; CKD, chronic kidney disease; DM, diabetes mellitus. Point size refers to the percentage of CABG.
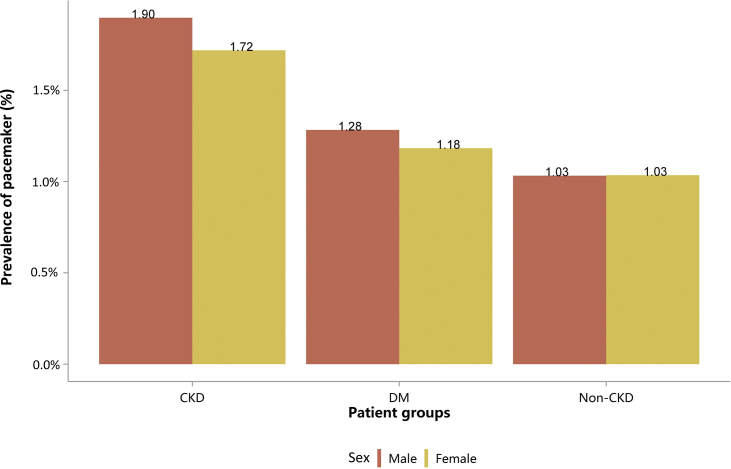
Cardiovascular procedure: pacemaker, stratified by sex. CKD, chronic kidney disease; DM, diabetes mellitus.
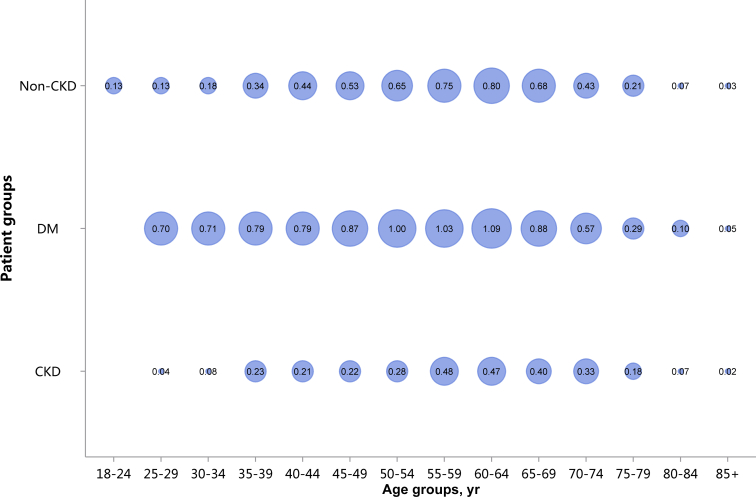
Cardiovascular procedure: pacemaker, stratified by age. Point size refers to the percentage of pacemaker. CKD, chronic kidney disease; DM, diabetes mellitus.
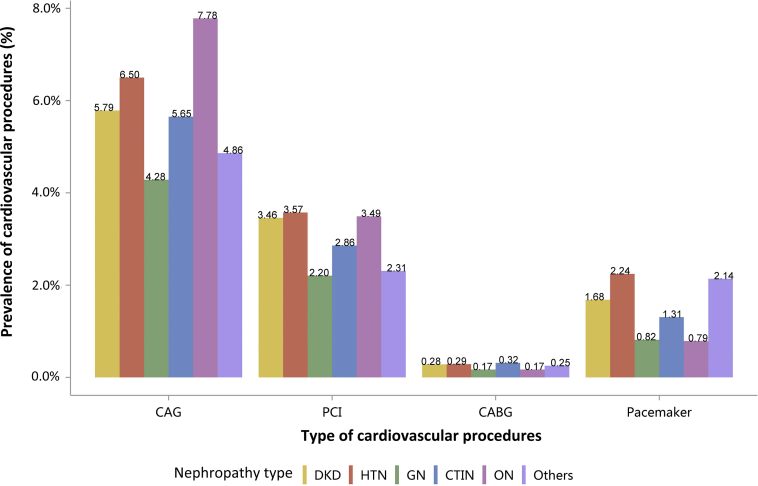
Cardiovascular procedures among patients with CKD. CABG, coronary artery bypass grafting; CAG, coronarography; CKD, chronic kidney disease; CTIN, chronic tubulointerstitial nephropathy; DKD, diabetic kidney disease; GN, glomerulonephritis; HTN, hypertensive nephropathy; ON, obstructive nephropathy; Others, CKD due to other reasons; PCI, percutaneous coronary intervention.
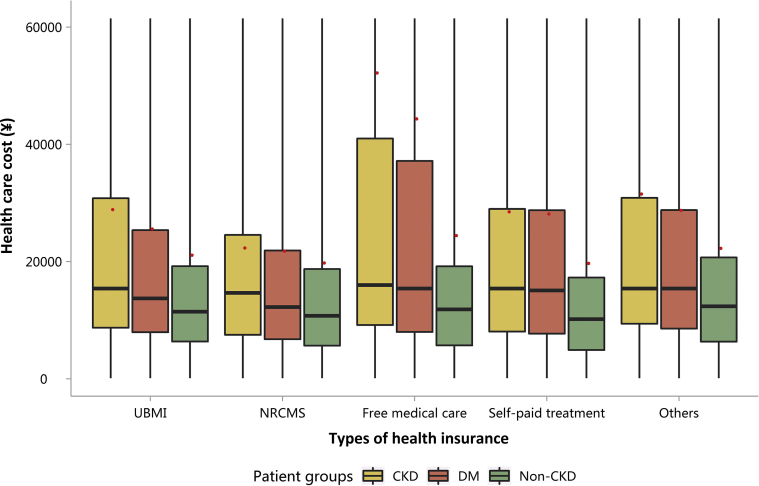
Costs stratified by types of health insurance. The box plot shows the distribution of hospitalization costs for different types of health insurance. Limited to 1.5 * third quartile. Red points refer to cost per person per year. CKD, chronic kidney disease; DM, diabetes mellitus; NRCMS, new rural co-operative medical care; UBMI, urban basic medical insurance.
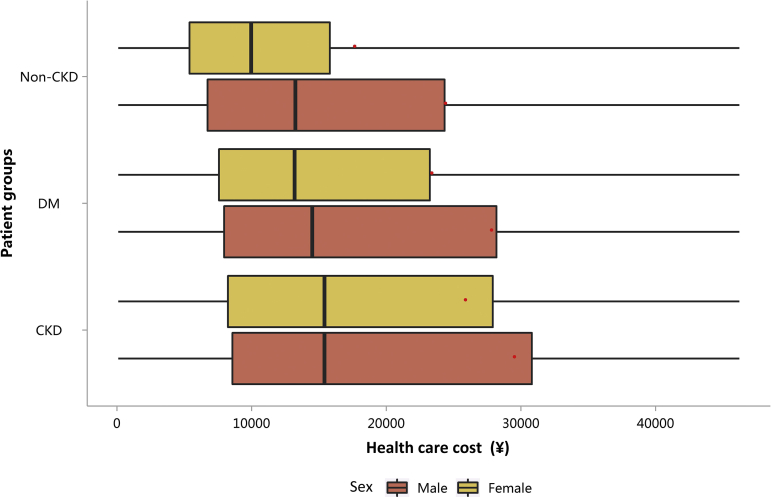
Costs stratified by sex. The box plot shows the distribution of hospitalization costs by sex. Limited to 1.5 * third quartile. Red points refer to cost per person per year. CKD, chronic kidney disease; DM, diabetes mellitus.
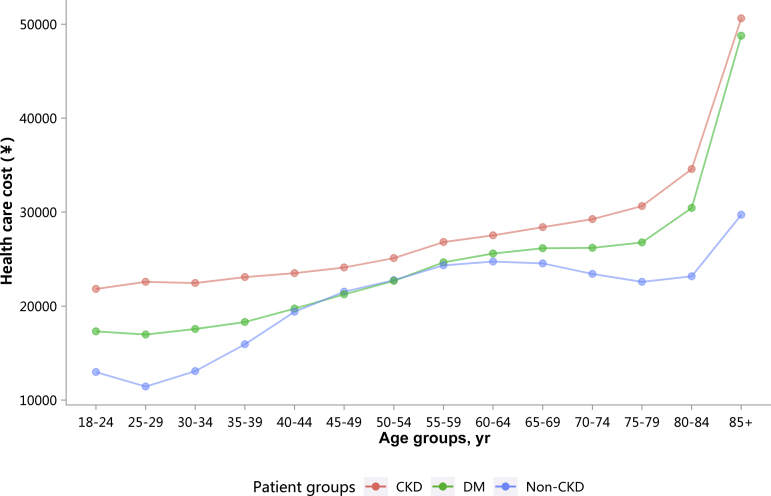
Costs stratified by age group (mean). CKD, chronic kidney disease; DM, diabetes mellitus.
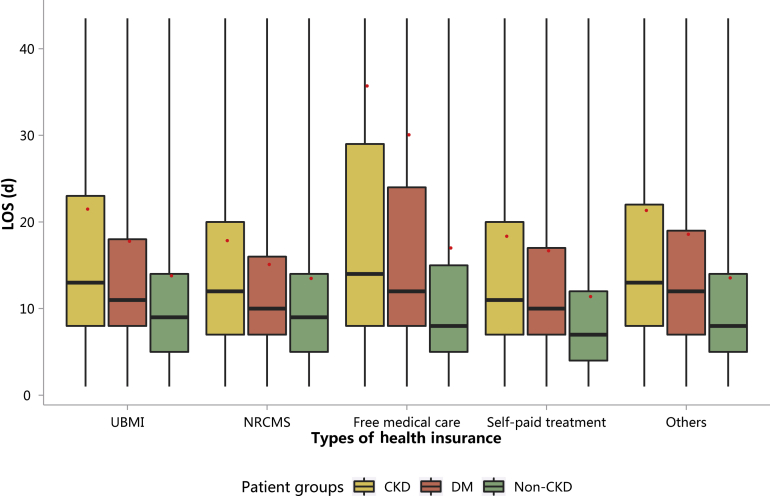
Length of hospital stay stratified by types of health insurance. Limited to 1.5 * third quartile. Red points refer to LOS per person per year. CKD, chronic kidney disease; DM, diabetes mellitus; LOS, length of hospital stay; NRCMS, new rural co-operative medical care; UBMI, urban basic medical insurance.
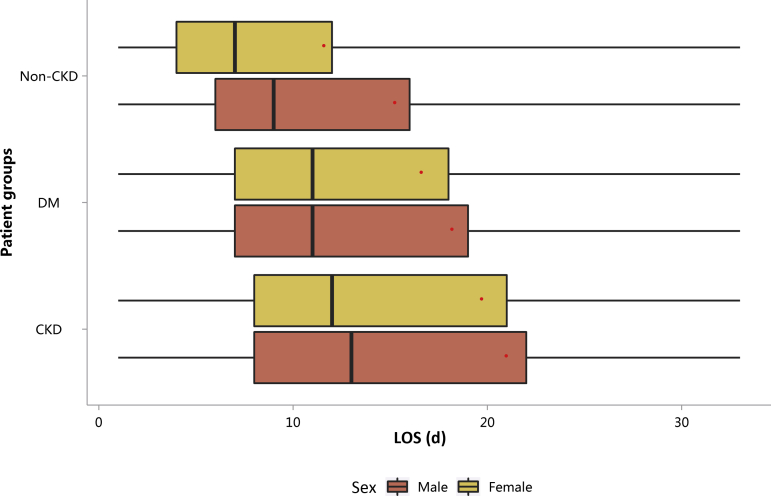
Length of hospital stay stratified by sex. Limited to 1.5 * third quartile. Red points refer to LOS per person per year. CKD, chronic kidney disease; DM, diabetes mellitus; LOS, length of hospital stay.
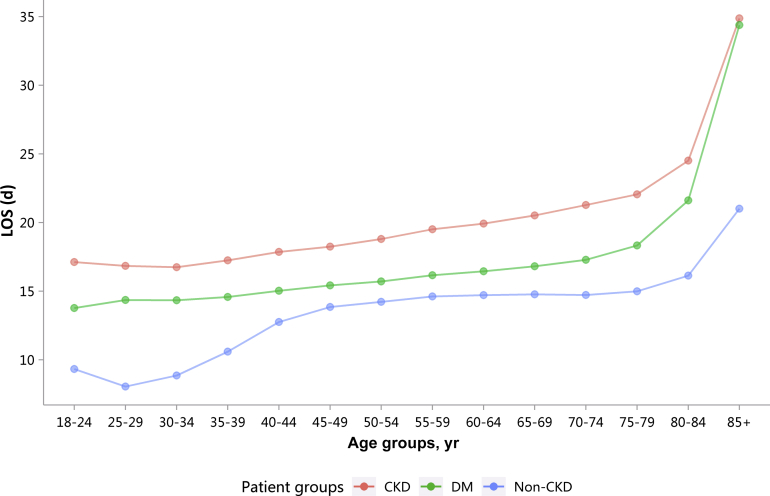
Length of hospital stay stratified by age group (mean). CKD, chronic kidney disease; DM, diabetes mellitus; LOS, length of hospital stay.
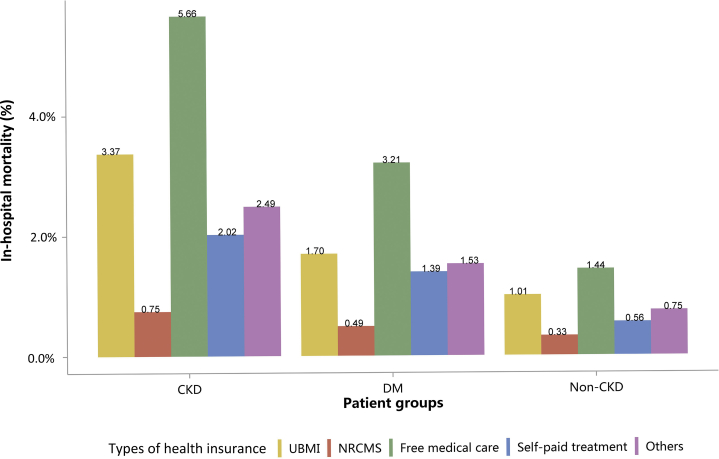
In-hospital mortality stratified by different types of insurance. CKD, chronic kidney disease; DM, diabetes mellitus; NRCMS, new rural co-operative medical care; UBMI, urban basic medical insurance.
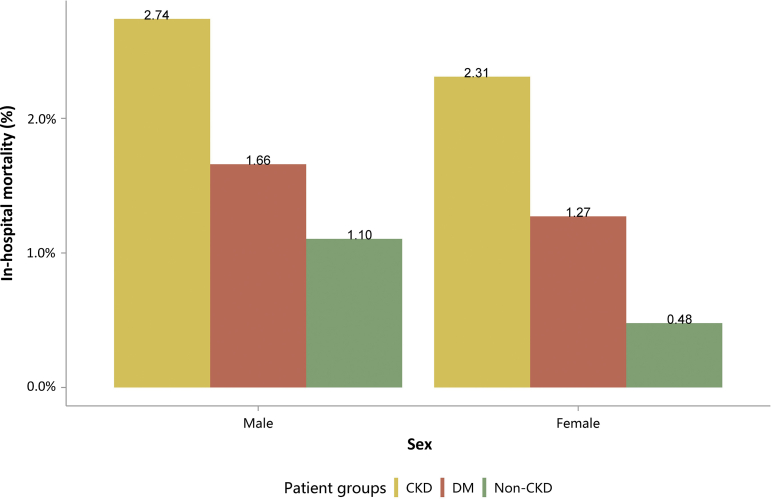
In-hospital mortality stratified by sex. CKD, chronic kidney disease; DM, diabetes mellitus.
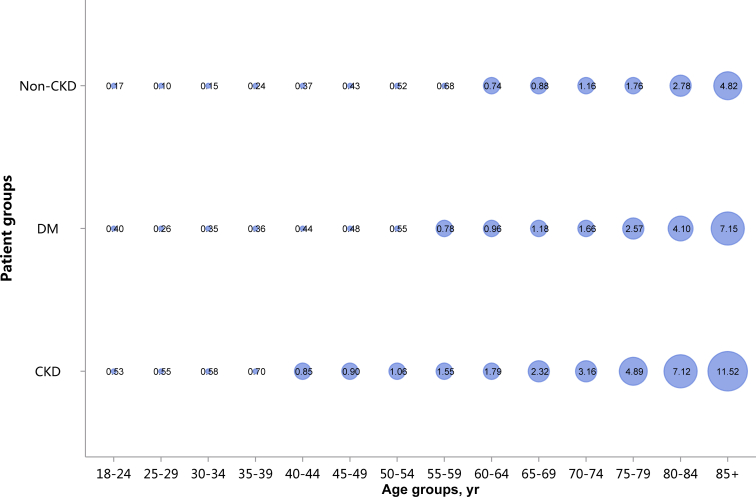
In-hospital mortality stratified by age group. Point size refers to mortality rate. CKD, chronic kidney disease; DM, diabetes mellitus.
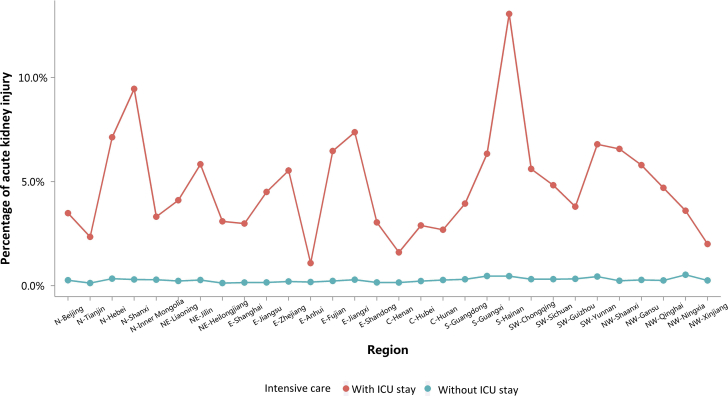
Percentage of AKI with and without ICU stay, stratified by geographic region. AKI, acute kidney injury; C, Central of China; E, East of China; ICU, intensive care unit; N, North of China; NE, Northeast of China; NW, Northwest of China; S, South of China; SW, Southwest of China.
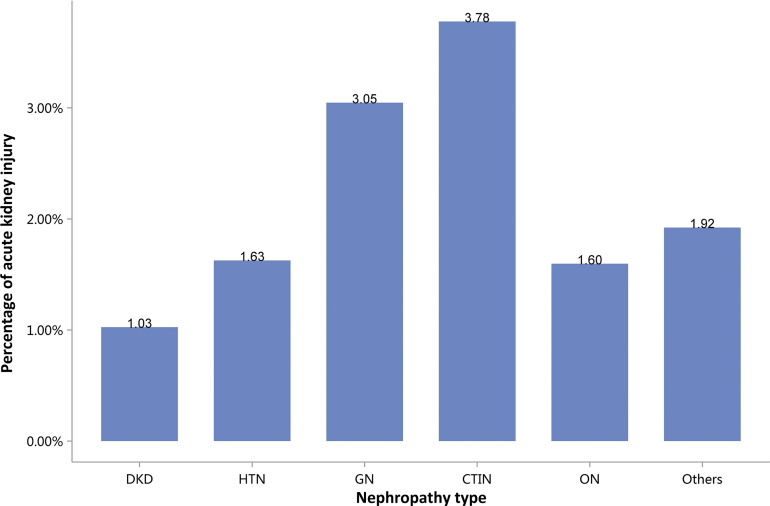
Percentage of AKI among patients with CKD. AKI, acute kidney injury; CKD, chronic kidney disease; CTIN, chronic tubulointerstitial nephropathy; DKD, diabetic kidney disease; GN, glomerulonephritis; HTN, hypertensive nephropathy; ON, obstructive nephropathy; Others, CKD due to other reasons.
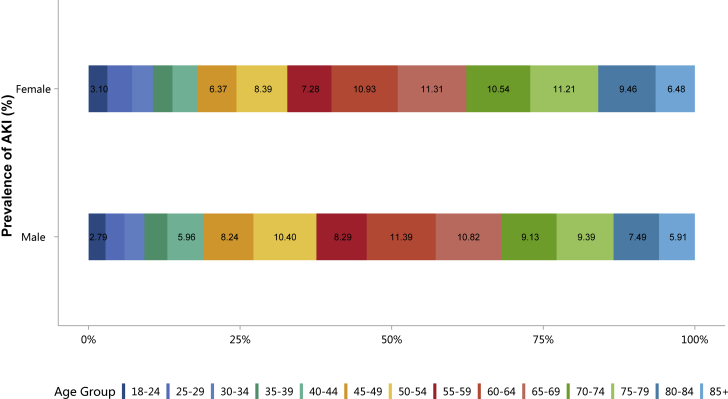
Age distribution of AKI patients, stratified by sex. AKI, acute kidney injury.
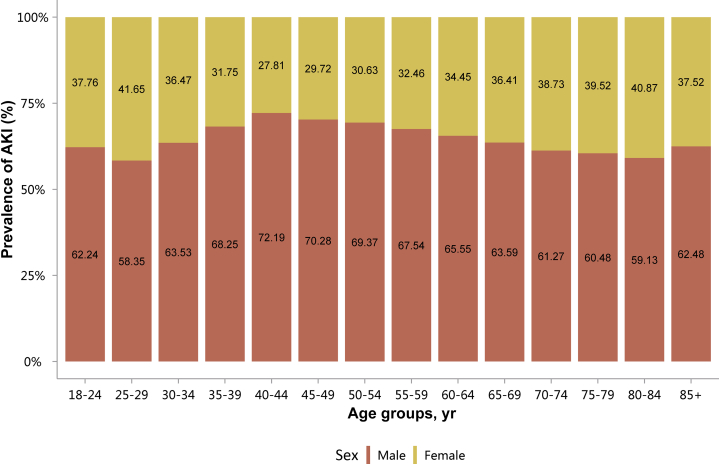
Sex distribution of AKI patients, stratified by age. AKI, acute kidney injury.
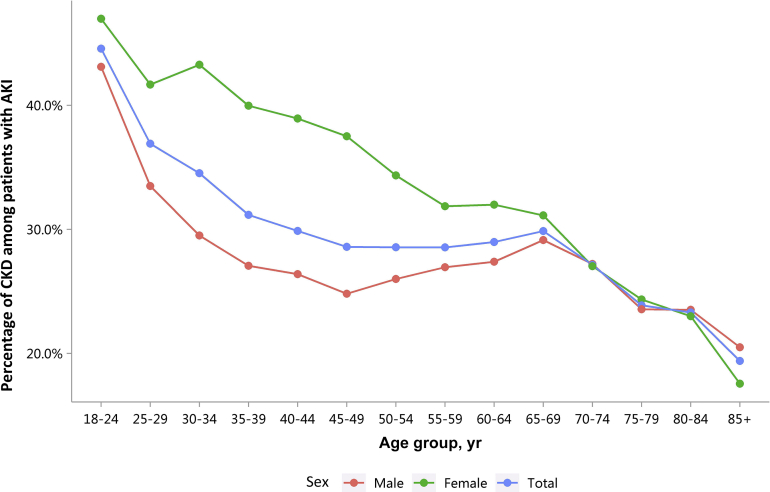
Percentage of CKD among patients with AKI, stratified by sex and age. AKI, acute kidney injury; CKD, chronic kidney disease.
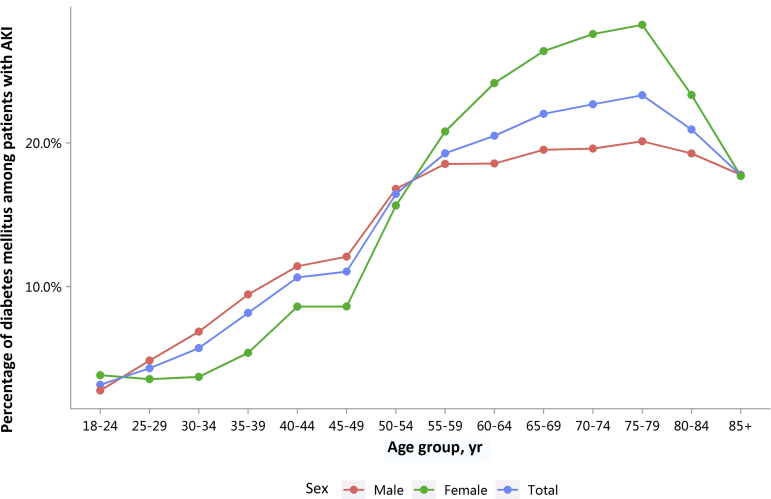
Percentage of diabetes mellitus among patients with AKI, stratified by sex and age. AKI, acute kidney injury.
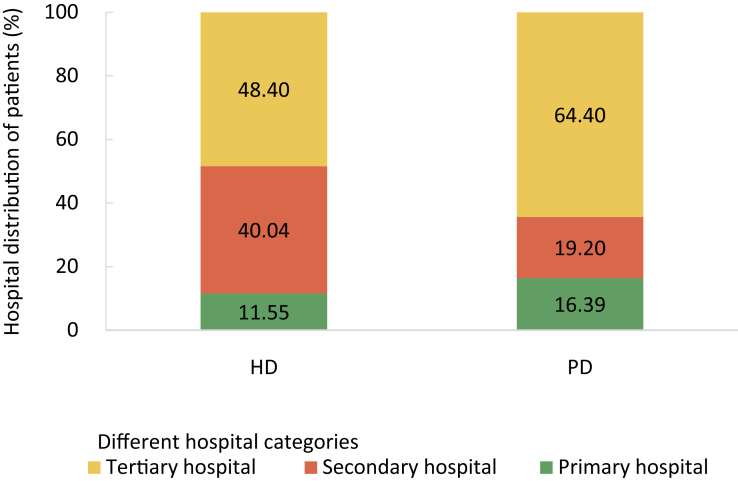
Distribution of HD and PD patients among different hospital levels. HD, hemodialysis; PD, peritoneal dialysis.
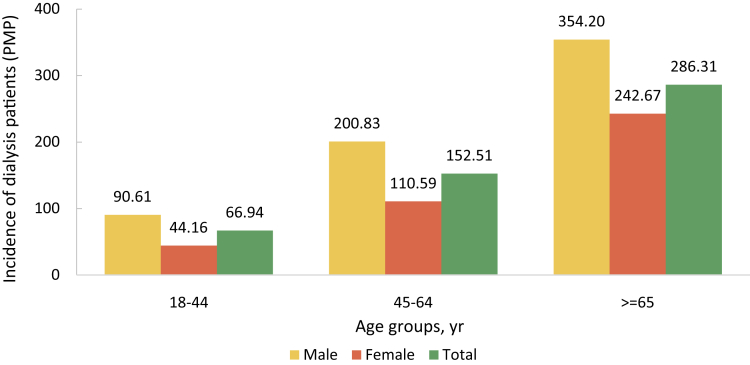
Incidence of dialysis patients, stratified by age and sex. PMP, per million population.
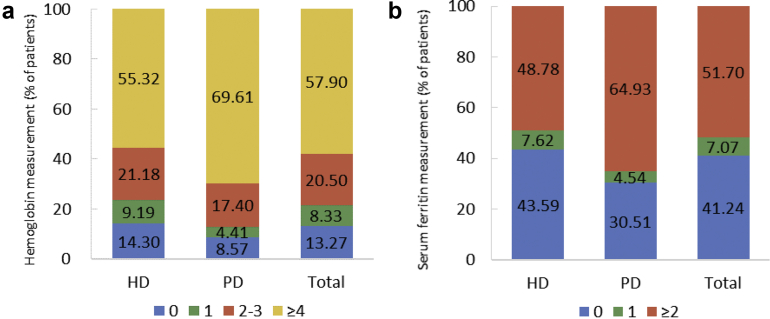
Percentage of dialysis patients who underwent 1 or more measurements of (a) hemoglobin and (b) serum ferritin in 2016. HD, hemodialysis; PD, peritoneal dialysis.
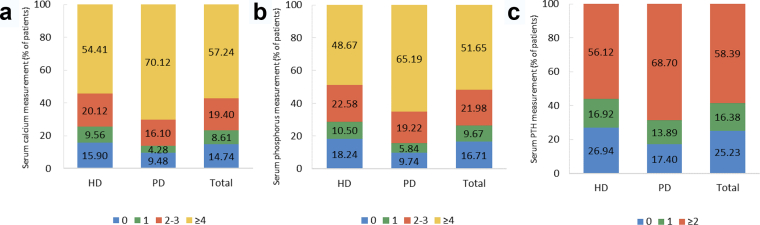
Percentage of dialysis patients who underwent 1 or more measurements of (a) serum calcium, (b) serum phosphorus, and (c) serum parathyroid hormone in 2016. HD, hemodialysis; PD, peritoneal dialysis; PTH, parathyroid hormone.
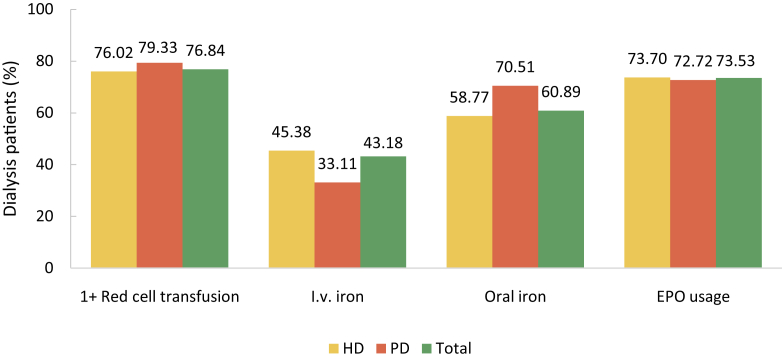
Percentage of dialysis patients receiving anemia-related treatment. EPO, erythropoietin; HD, hemodialysis; PD, peritoneal dialysis.
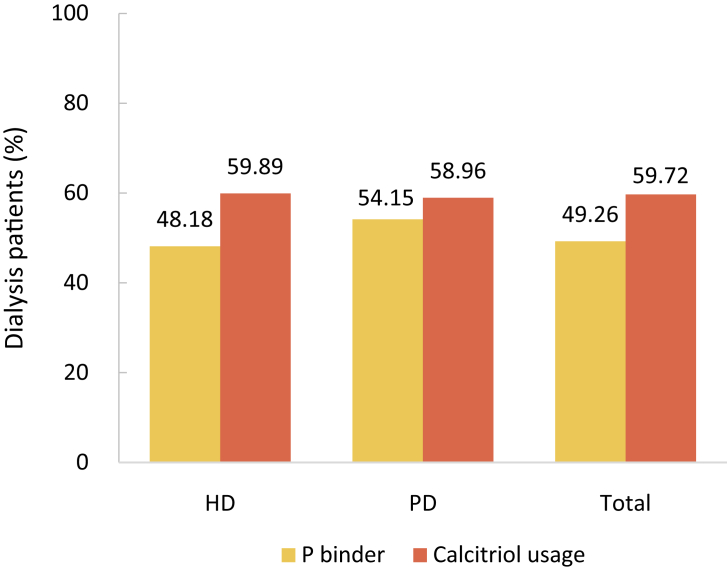
Percentage of dialysis patients receiving MBD-related treatment. HD, hemodialysis; MBD, mineral and bone disorder; PD, peritoneal dialysis.
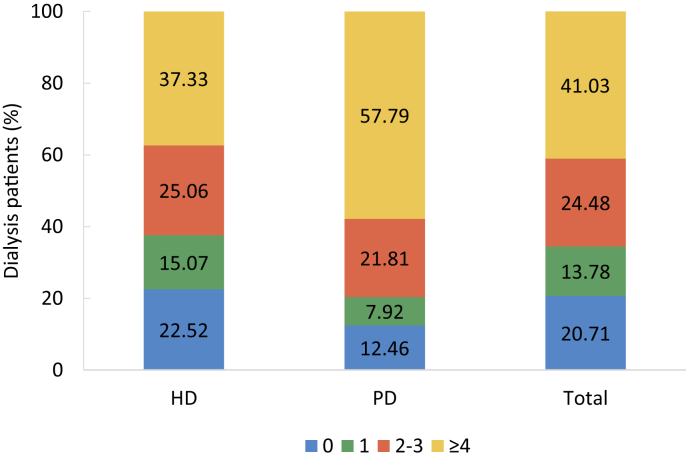
Percentage of dialysis patients who underwent blood albumin testing. HD, hemodialysis; PD, peritoneal dialysis.
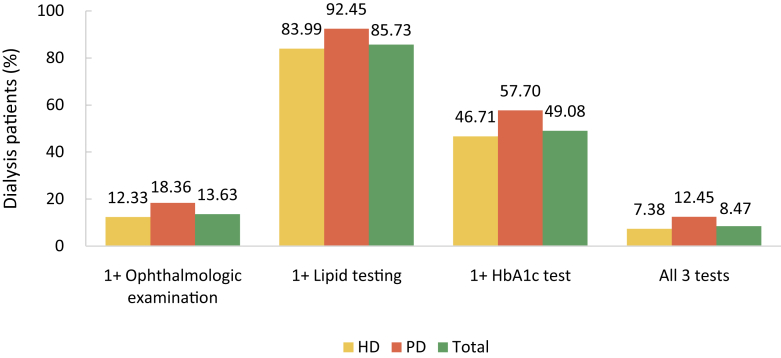
Diabetes-related examinations among dialysis patients with diabetes. HD, hemodialysis; PD, peritoneal dialysis.
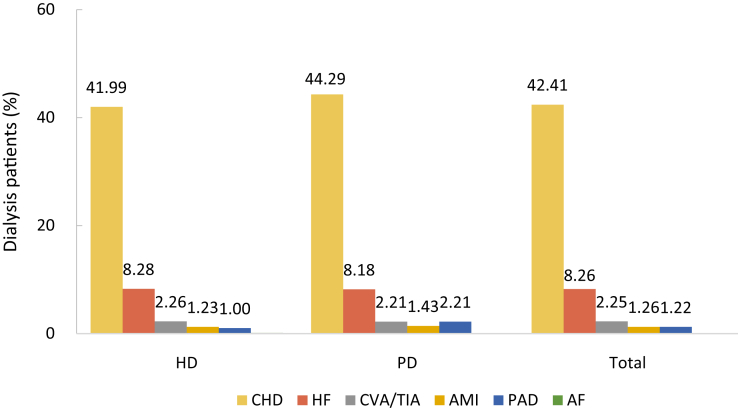
Percentages of different types of CVD among dialysis patients, by modality. AF, atrial fibrillation; AMI, acute myocardial infarction; CHD, coronary heart disease; CVA/TIA, cerebrovascular accident/transient ischemic attack; CVD, cardiovascular disease; HD, hemodialysis; HF, heart failure; PAD, peripheral arterial disease; PD, peritoneal dialysis.
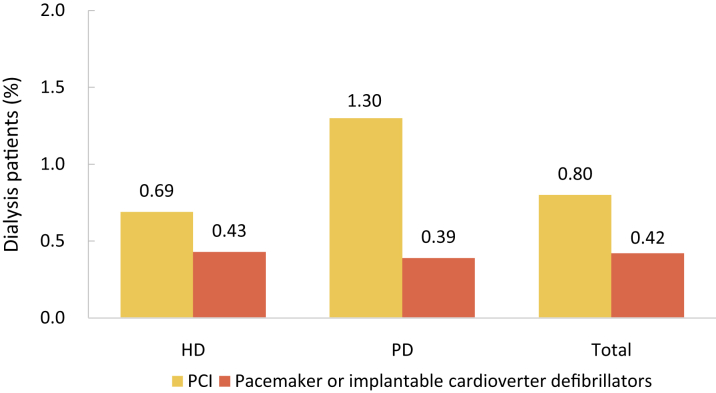
Percentages of dialysis patients receiving cardiovascular procedures, by modality. HD, hemodialysis; PCI, percutaneous coronary intervention; PD, peritoneal dialysis.
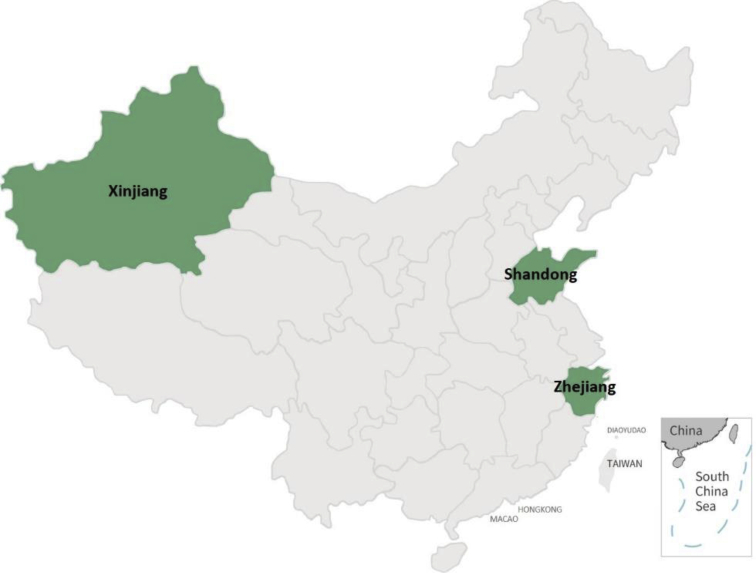
Geographical location of Shandong, Zhejiang, and Xinjiang provinces in China. Shandong and Zhejiang are in the east of China, and Xinjiang is in the northwest of China.
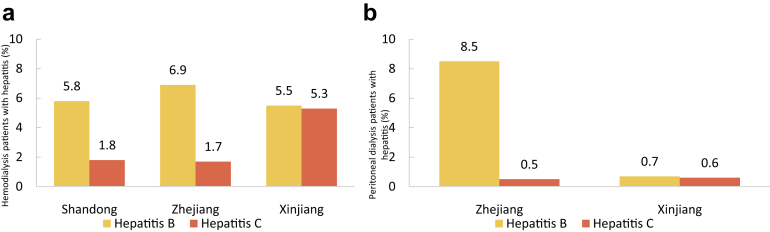
Hepatitis B/C virus infection in (a) HD and (b) PD patients in Shandong, Zhejiang, and Xinjiang in China (%). Data on PD in Shandong Province were not provided. HD, hemodialysis; PD, peritoneal dialysis.
References
-
- Zhang L., Wang F., Wang L. Prevalence of chronic kidney disease in China: a cross-sectional survey. Lancet (London, England) 2012;379:815–822. - PubMed
-
- Liu Z.H. Nephrology in china. Nat Rev Nephrol. 2013;9:523–528. - PubMed
-
- Yang C., Kong G., Wang L. Big data in nephrology: Are we ready for the change? Nephrology (Carlton) 2019;24:1097–1102. - PubMed
LinkOut - more resources
Full Text Sources
Research Materials
