. 2020 Nov;10(11):2171-2182.
doi: 10.1016/j.apsb.2020.09.004. Epub 2020 Sep 15.

Precise delivery of obeticholic acid via nanoapproach for triggering natural killer T cell-mediated liver cancer immunotherapy

Affiliations

Precise delivery of obeticholic acid via nanoapproach for triggering natural killer T cell-mediated liver cancer immunotherapy

Guofeng Ji et al. Acta Pharm Sin B. 2020 Nov.

Abstract

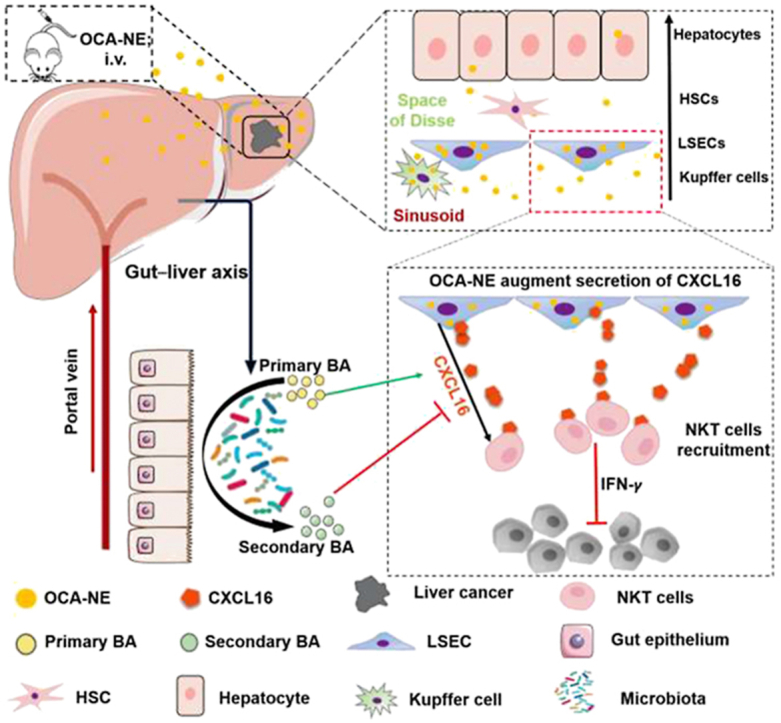
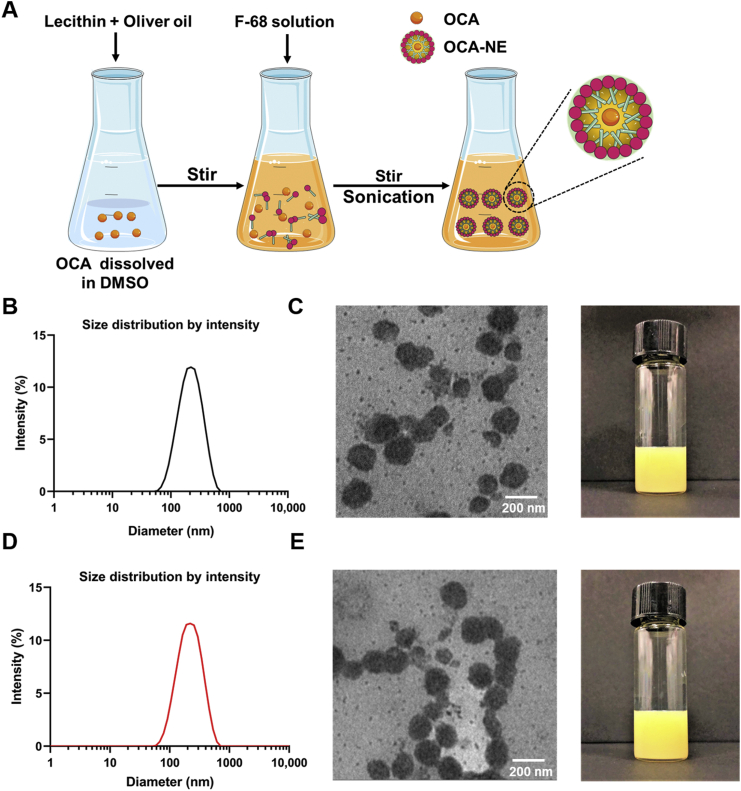
Primary bile acids were reported to augment secretion of chemokine (C‒X‒C motif) ligand 16 (CXCL16) from liver sinusoidal endothelial cells (LSECs) and trigger natural killer T (NKT) cell-based immunotherapy for liver cancer. However, abundant expression of receptors for primary bile acids across the gastrointestinal tract overwhelms the possibility of using agonists against these receptors for liver cancer control. Taking advantage of the intrinsic property of LSECs in capturing circulating nanoparticles in the circulation, we proposed a strategy using nanoemulsion-loaded obeticholic acid (OCA), a clinically approved selective farnesoid X receptor (FXR) agonist, for precisely manipulating LSECs for triggering NKT cell-mediated liver cancer immunotherapy. The OCA-nanoemulsion (OCA-NE) was prepared via ultrasonic emulsification method, with a diameter of 184 nm and good stability. In vivo biodistribution studies confirmed that the injected OCA-NE mainly accumulated in the liver and especially in LSECs and Kupffer cells. As a result, OCA-NE treatment significantly suppressed hepatic tumor growth in a murine orthotopic H22 tumor model, which performed much better than oral medication of free OCA. Immunologic analysis revealed that the OCA-NE resulted in augmented secretion of CXCL16 and IFN-γ, as well as increased NKT cell populations inside the tumor. Overall, our research provides a new evidence for the antitumor effect of receptors for primary bile acids, and should inspire using nanotechnology for precisely manipulating LSECs for liver cancer therapy.

Keywords: ALT, alanine aminotransferase; AST, aspartate aminotransferase; BUN, blood urea nitrogen; CDCA, chenodeoxycholic acid; Cr, creatinine; FXR, farnesoid X receptor; Farnesoid X receptor; H&E, hematoxylin and eosin; HCC, hepatocellular carcinoma; HPLC, high-performance liquid chromatography; HSCs, hepatic stellate cells; IFN-γ, interferon-γ; IVIS, in vivo imaging system; LSECs, liver sinusoidal endothelial cells; Liver cancer; Liver sinusoidal endothelial cells; NE, nanoemulsion; NKT cells, natural killer T cells; Nanoemulsion; OCA, obeticholic acid; Obeticholic acid; PBC, primary biliary cholangitis; TACE, transarterial chemoembolisation; TSR, tumor suppression rate.


Figures

Image 1
Graphical abstract
Scheme 1
Scheme 1
Mechanism of OCA-NE in precisely manipulating LSECs and NKT cells for liver cancer immunotherapy. The injected OCA-NE accumulates in mouse liver and especially in the LSEC cells, promoting secretion of CXCL16 and recruitment of NKT cells to the tumor, which further inhibit liver tumor growth through secretion of IFN-γ.
Figure 1
Figure 1
Preparation and characterization of OCA-NE. (A) Schematic illustration of preparation of OCA-NE via an ultrasonic emulsification method. (B) and (C) Hydrodynamic diameters as measured by DLS and representative TEM image and photo of OCA-NE. scale bar = 200 nm. (D) and (E) Hydrodynamic diameters as measured by DLS and representative TEM image and photo of OCA-NE after storage for 1 month; scale bar = 200 nm.
Figure 2
Figure 2
In vitro cell viability of mouse 3T3 fibroblasts (A) and H22 cells (B) incubated with free OCA and OCA-NE for 24 and 48 h. Data represent mean ± SD (n = 4 for 3T3 fibroblasts, n = 3 for H22 cells).
Figure 3
Figure 3
Plasma concentration–time profiles in SD rats treated with free OCA (p.o.) and OCA-NE (i.v.) at a dose of 20 mg/kg. Data are mean ± SD (n = 4).
Figure 4
Figure 4
In vivo and cellular distribution study of DiD-NE in BALB/c mice. (A) Schematic illustration of the distribution experiment design. The vital organs were perfused and collected at 4 and 24 h for IVIS after i.v. injections of DiD-NE. The livers collected at 4h were also analyzed with flow cytometry to investigate the relative NE uptake by major liver cells. (B) Representative fluorescence images of vital organs captured at 4 and 24 h after i.v. injections of DiD-NE. (C) Fluorescence intensity of vital organs at 4 and 24 h. Data were presented as the mean ± SEM (n = 3). (D) Percentage of cells that internalized NE (DiD+) within hepatocytes, endothelial cells, Kupffer cells, and other cells at 4 h after injection. Data were presented as the mean ± SEM (n = 8); ∗∗∗∗P < 0.0001.
Figure 5
Figure 5
Tumor inhibition study of OCA-NE in orthotopic H22 mice model. (A) Treatment scheme. Mice were sacrificed on day 17 after indicated treatments. d represent for day. (B) Representative photos of livers after receiving PBS (i.v.), NE (i.v.), OCA (p.o.) and OCA-NE (i.v.) treatment. The livers were harvested at the end of experiment. The tumors were outlined with black dotted line. H represent hepatocytes, T represent tumor cells. (C) Tumor weight, liver weight and tumor/liver weight ratios after different treatments over time. Data are shown as mean ± SEM (n = 7 for NE, OCA and OCA-NE group; n = 8 for PBS group). nsP>0.05, P < 0.05, P < 0.01, (D) Representative H&E images of tumor sections of different group. The scale bar represents 50 μm. The tumors were outlined with white dotted line. (E)Tumor weight variations of each treatment group over time. Data represent mean ± SEM (n = 6). (F)Serum levels of aspartate aminotransferase (AST), alanine aminotransferase (ALT), blood urea nitrogen (BUN) and creatinine (CRE) in mice after treatment and normal mice. Data are shown as mean ± SEM (n = 3 for normal group, n = 4 for NE, OCA and OA-NE group). nsP>0.05, P < 0.05, P < 0.01, P < 0.001.
Figure 6
Figure 6
Immune analysis of serum and liver tumor after various treatments. (A) CXCL16 and IFN-γ concentrations in serum. Data are shown as mean ± SEM (n = 5). (B) CXCL16 and IFN-γ concentrations in tumors. Data are shown as mean ± SEM (n = 8). (C) and (D) Proportions of tumor-infiltrating NKT cells, NK cells, CD4+ T cells, CD8+ T cells and B cells. Data are shown as mean ± SEM, (n = 7 for NE; n = 8 for PBS, OCA and OCA-NE group). (D) Proportions of tumor-infiltrating macrophages. Data are shown as mean ± SEM, (n = 7). nsP>0.05, P < 0.05, P < 0.01, P < 0.001.

References

    1. Bray F., Ferlay J., Soerjomataram I., Siegel R.L., Torre L.A., Jemal A. Global cancer statistics 2018: GLOBOCAN estimates of incidence and mortality worldwide for 36 cancers in 185 countries. CA Cancer J Clin. 2018;68:394–424. - PubMed
    1. Chen W.Q., Li H., Sun K.X., Zheng R.S., Zhang S.W., Zeng H.M. Report of cancer incidence and mortality in China, 2014. Chin J Oncol. 2018;40:5–13. - PubMed
    1. Chen W.Q., Sun K.X., Zheng R.S., Zeng H.M., Zhang S.W., Xia C.F. Cancer incidence and mortality in China, 2014. Chin J Oncol. 2018;30:1–12. - PMC - PubMed
    1. Torre L.A., Bray F., Siegel R.L., Ferlay J., Lortet-Tieulent J., Jemal A. Global cancer statistics, 2012. CA Cancer J Clin. 2015;65:87–108. - PubMed
    1. Song T.J., Ip E.W., Fong Y. Hepatocellular carcinoma: current surgical management. Gastroenterology. 2004;127:S248–S260. - PubMed