. 2020 Nov 10:8:553733.
doi: 10.3389/fcell.2020.553733. eCollection 2020.

Overcoming of Radioresistance in Non-small Cell Lung Cancer by microRNA-320a Through HIF1α-Suppression Mediated Methylation of PTEN

Affiliations

Overcoming of Radioresistance in Non-small Cell Lung Cancer by microRNA-320a Through HIF1α-Suppression Mediated Methylation of PTEN

Li-Ming Xu et al. Front Cell Dev Biol. .

Abstract

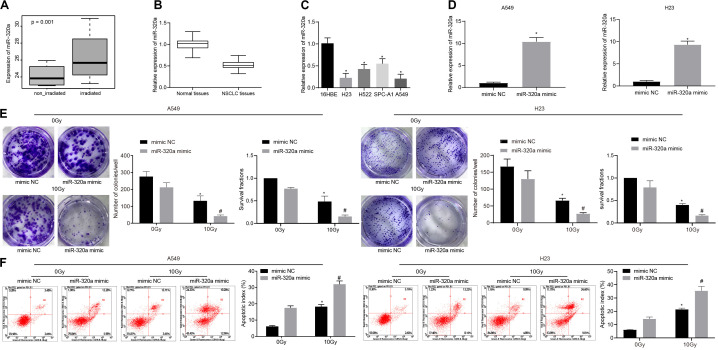
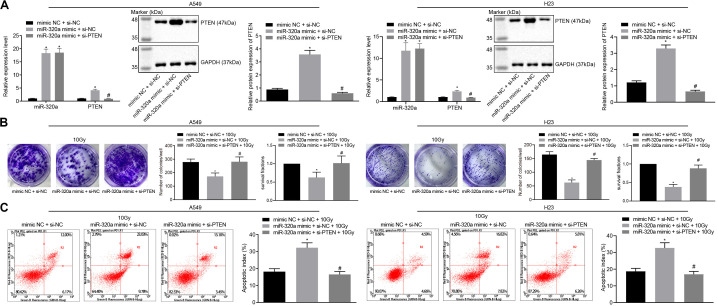
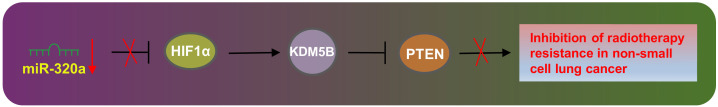
Background: Radioresistance is a major challenge in the use of radiotherapy for the treatment of lung cancer while microRNAs (miRs) have been reported to participate in multiple essential cellular processes including radiosensitization. This study was conducted with the main objective of investigating the potential role of miR-320a in radioresistance of non-small cell lung cancer (NSCLC) via the possible mechanism related to HIF1α, KDM5B, and PTEN.

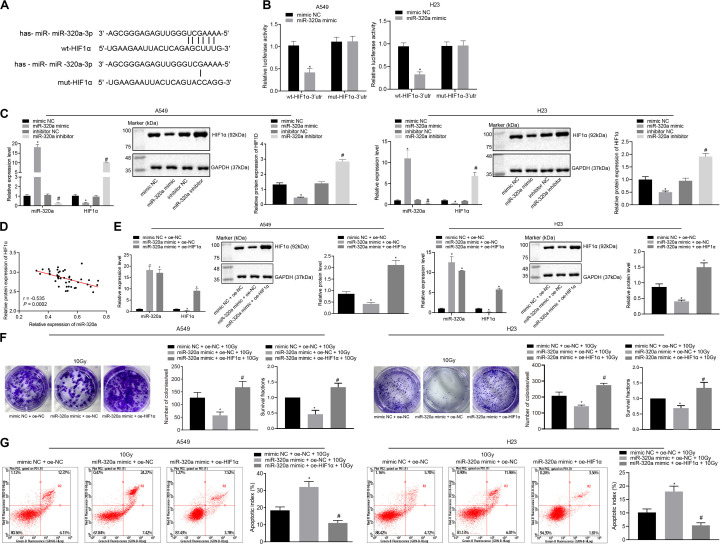
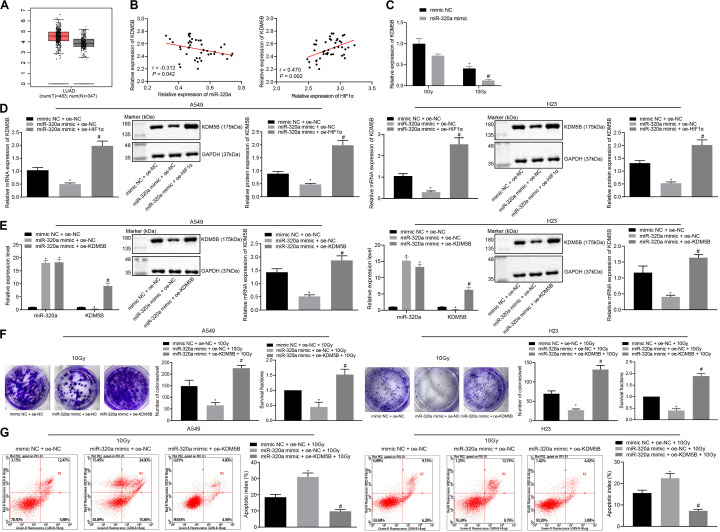
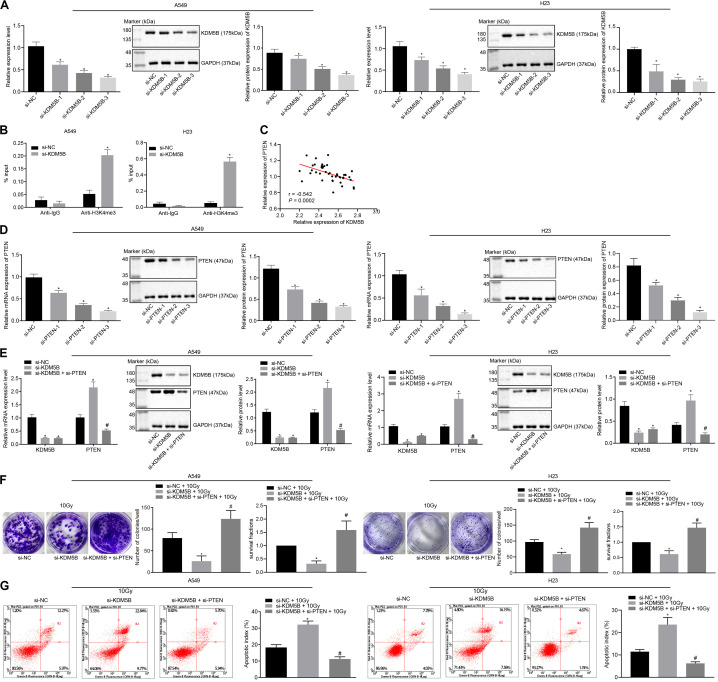
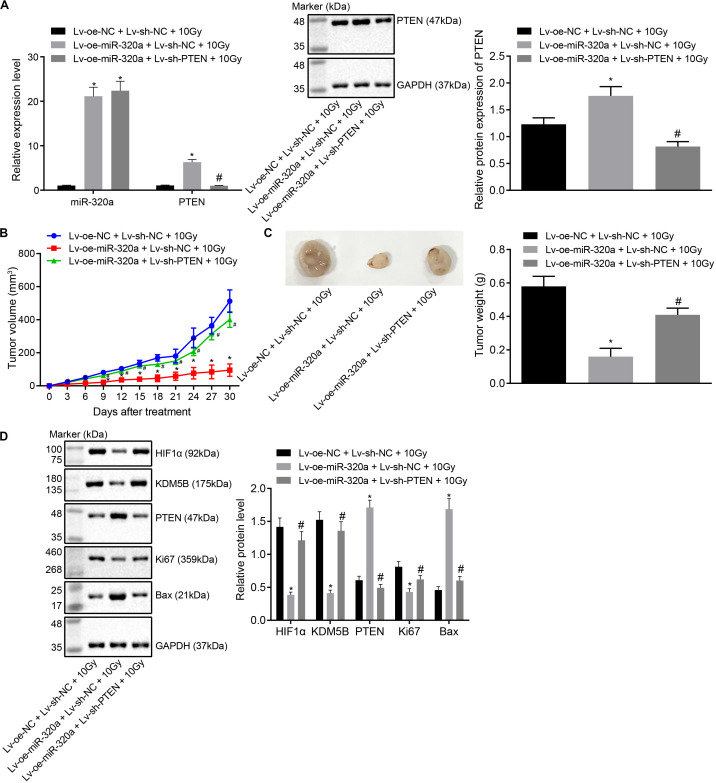
Methods: Firstly, NSCLC radiosensitivity-related microarray dataset GSE112374 was obtained. Then, the expression of miR-320a, HIF1α, KDM5B, and PTEN was detected in the collected clinical NSCLC samples, followed by Pearson's correlation analysis. Subsequently, ChIP assay was conducted to determine the content of the PTEN promoter fragment enriched by the IgG antibody and H3K4me3 antibody. Finally, a series of in vitro and in vivo assays were performed in order to evaluate the effects of miR-320a on radioresistance of NSCLC with the involvement of HIF1α, KDM5B, and PTEN.

Results: The microarray dataset GSE112374 presented with a high expression of miR-320a in NSCLC radiosensitivity samples, which was further confirmed in our clinical samples with the use of reverse transcription-quantitative polymerase chain reaction. Moreover, miR-320a negatively targeted HIF1α, inhibiting radioresistance of NSCLC. Interestingly, miR-320a suppressed the expression of KDM5B, and KDM5B was found to enhance the radioresistance of NSCLC through the downregulation of PTEN expression. The inhibition of miR-320a in radioresistance of NSCLC was also reproduced by in vivo assay.

Conclusion: Taken together, our findings were suggestive of the inhibitory effect of miR-320a on radioresistance of NSCLC through HIF1α-suppression mediated methylation of PTEN.

Keywords: HIF1α; KDM5B; PTEN; microRNA-320a; non-small cell lung cancer; radioresistance.


Figures

FIGURE 1
FIGURE 1
miR-320a promoted the radiosensitivity of NSCLC. (A) The differential analysis of human NSCLC radiosensitivity microarray data GSE112374 in the GEO database. (B) Quantitative analysis of the expression of miR-320a in human NSCLC tissues and adjacent tissues. *p < 0.05 compared with adjacent tissue. (C) Quantitative analysis of the expression of miR-320a in NSCLC cell lines (A549, H23, H522, and SPC-A1) and human bronchial epithelial cells (16HBE). *p < 0.05 compared with 16HBE cell. (D) Quantitative analysis of the transfection efficiency of miR-320a in A549 and H23 cells. *p < 0.05 compared with cells treated with mimic NC. (E) Clonogenic survival analysis of the number of colony formation and SFs in A549 and H23 cells at 24 h after irradiation treatment. (F) Flow cytometry detection of the apoptosis index in A549 and H23 cells at 24 h after irradiation treatment (Apoptotic rate = sum of Q2 + Q4 data). *p < 0.05 compared with cells after 0 Gy X-ray treatment. #p < 0.05 compared with cells after 10 Gy X-ray treatment. The results were measurement data, which were expressed as the mean ± standard deviation n = 43. Comparisons between two groups were conducted using paired t-test (B), and comparisons between multiple groups analyzed by one-way ANOVA (C) with Tukey’s post hoc test. Comparisons between the two groups were conducted using an unpaired t-test (D–F). The experiment was independently repeated three times.
FIGURE 2
FIGURE 2
miR-320a suppressed the radioresistance of NSCLC through inhibition of HIF1α. (A) Microarray analysis of the relationship between HIF1α and miR-320a. (B) Dual-luciferase reporter gene assay for verifying the relationship between HIF1α and miR-320a. *p < 0.05 compared with cells stimulated with mimic NC. (C) The effect of miR-320a on the expression of HIF1α in A549 and H23 cells was measured by RT-qPCR and western blot analysis. *p < 0.05 compared with cells stimulated with mimic NC. (D) Pearson correlation analysis of the expression of miR-320a and HIF1α in 43 cases of NSCLC. (E) The transfection efficiency of A549 and H23 cells detected by RT-qPCR and western blot analysis. *p < 0.05 compared with cells stimulated with mimic NC. (F) The number of colony formation and SFs of A549 and H23 cells detected by clonogenic survival analysis at 24 h after irradiation treatment. (G) The apoptosis index of A549 and H23 cells detected by flow cytometry at 24 h after irradiation treatment (Apoptotic rate = sum of Q2 + Q4 data). *p < 0.05 compared with cells stimulated with mimic NC + oe-NC + 10 Gy. #p < 0.05 compared with cells stimulated with miR-320a mimic + oe-NC + 10 Gy. The results were measurement data, which were expressed as the mean ± standard deviation n = 43. Comparisons between the two groups were conducted using an unpaired t-test (B,C) and comparisons between multiple groups analyzed by one-way ANOVA (E–G) with Tukey’s post hoc test. The experiment was independently repeated three times.
FIGURE 3
FIGURE 3
miR-320a suppressed the radioresistance of NSCLC by down-regulation of HIF1α and KDM5B. (A) The differential expression of histone demethylase KDM5B in all cancers in the TCGA database. (B) Pearson correlation analysis of the expression of miR-320a and HIF1α as well as HIF1α and KDM5B in 43 cases of NSCLC. (C) The expression of KDM5B in A549 and H23 cells measured by RT-qPCR *p < 0.05 compared with cells stimulated with mimic NC + 0 Gy. #p < 0.05 compared with cells stimulated with miR-320a mimic + 0 Gy. (D) The effect of a miR-320a-HIF1α axis on the expression of KDM5B in A549 and H23 cells measured by RT-qPCR and western blot analysis. *p < 0.05 compared with cells stimulated with mimic NC + oe-NC. #p < 0.05 compared with cells stimulated with miR-320a mimic + oe-NC. (E) The transfection efficiency in A549 and H23 cells detected by RT-qPCR and western blot analysis. *p < 0.05 compared with cells stimulated with mimic NC + oe-NC. #p < 0.05 compared with cells stimulated with miR-320a mimic + oe-NC. (F) The number of colony formation and SFs of A549 and H23 cells detected by clonogenic survival analysis at 24 h after irradiation treatment. *p < 0.05 compared with cells stimulated with mimic NC + oe-NC + 10Gy. #p < 0.05 compared with cells stimulated with miR-320a mimic + oe-NC + 10Gy. (G) The apoptosis index of A549 and H23 cells were detected by flow cytometry at 24 h after irradiation treatment (Apoptotic rate = sum of Q2 + Q4 data). *p < 0.05 compared with cells stimulated with mimic NC + oe-NC + 10 Gy. #p < 0.05 compared with cells stimulated with miR-320a mimic + oe-NC + 10Gy. The results were measurement data, which were expressed as the mean ± standard deviation. n = 43. Comparisons between the two groups were conducted using unpaired t-test. Comparisons between multiple groups were analyzed by one-way ANOVA with Tukey’s post hoc test. The experiment was independently repeated three times.
FIGURE 4
FIGURE 4
KDM5B enhanced the radioresistance of NSCLC through suppression of PTEN. (A) The silencing efficiency of KDM5B in A549 and H23 cells measured by RT-qPCR and western blot analysis (Cells were collected 24 h after siRNA transfection). *p < 0.05 compared with cells stimulated with si-NC. (B) The content of PTEN promoter fragment enriched by IgG antibody and H3K4me3 antibody in A549 and H23 cells measured using ChIP assay. *p < 0.05 compared with cells stimulated with anti-IgG. (C) Pearson correlation analysis of the expression of KDM5B and PTEN in 43 cases of NSCLC. (D) The silencing efficiency of PTEN in A549 and H23 cells measured by RT-qPCR and western blot analysis. *p < 0.05 compared with cells stimulated with si-NC. (E) The transfection efficiency of PTEN and KDM5B in A549 and H23 cells detected by RT-qPCR and western blot analysis. *p < 0.05 compared with cells stimulated with si-NC. #p < 0.05 compared with cells stimulated with si-KDM5B. (F) The number of colony formation and SFs of A549 and H23 cells detected by clonogenic survival analysis at 24 h after irradiation treatment. *p < 0.05 compared with cells stimulated with si-NC + 10 Gy. #p < 0.05 compared with cells stimulated with si-KDM5B + 10 Gy. (G) The apoptosis index of A549 and H23 cells detected by flow cytometry at 24 h after irradiation treatment (Apoptotic rate = sum of Q2 + Q4 data). *p < 0.05 compared with cells stimulated with si-NC + 10 Gy. #p < 0.05 compared with cells stimulated with si-KDM5B + 10 Gy. The results were measurement data, which were expressed as the mean ± standard deviation n = 43. Comparisons between multiple groups were analyzed by one-way ANOVA (A,D) with Tukey’s post hoc test. Comparisons between the two groups were conducted using an unpaired t-test (B,E–G).
FIGURE 5
FIGURE 5
miR-320a/HIF1α/KDM5B/PTEN axis involved in the radioresistance of NSCLC cells. (A) The transfection efficiency in A549 and H23 cells detected by RT-qPCR and western blot analysis. *p < 0.05 compared with cells stimulated with mimic NC + si-NC. #p < 0.05 compared to cells stimulated with miR-320a mimic + si-NC. (B) The number of colony formation and SFs of A549 and H23 cells detected by clonogenic survival analysis at 24 h after irradiation treatment. *p < 0.05 compared with cells stimulated with mimic NC + si-NC + 10 Gy. #p < 0.05 compared with cells stimulated with miR-320a mimic + si-NC + 10 Gy. (C) The apoptosis index of A549 and H23 cells detected by flow cytometry at 24 h after irradiation treatment (Apoptotic rate = sum of Q2 + Q4 data). *p < 0.05 compared with cells stimulated with mimic NC + si-NC + 10 Gy. #p < 0.05 compared with cells stimulated with miR-320a mimic + si-NC + 10 Gy. The results were measurement data, which were expressed as the mean ± standard deviation n = 43. Comparisons between the two groups were conducted using an unpaired t-test. Comparisons between multiple groups were analyzed by one-way ANOVA with Tukey’s post hoc test. The experiment was independently repeated three times.
FIGURE 6
FIGURE 6
miR-320a inhibited the radioresistance of NSCLC in mouse xenografts. (A) The reliability of the stably infected cells confirmed by RT-qPCR and western blot analysis. (B) The changes in the volume of xenografts after injection. (C) The changes in weight of xenografts after injection. (D) Western blot analysis of the expression of HIF1α, KDM5B, PTEN, Ki67 and Bax in the nude mice xenografts. *p < 0.05 compared with mice treated with Lv-oe-NC + Lv-sh-NC + 10 Gy. #p < 0.05 compared with mice treated with Lv-oe-miR-320a + Lv-sh-PTEN + 10 Gy. Mice were treated with Lv-oe-miR-320a + Lv-sh-NC + 10 Gy, Lv-oe-miR-320a + Lv-sh-PTEN + 10 Gy, and Lv-oe-NC + Lv-sh-NC + 10 Gy. The results were measurement data, which were expressed as the mean ± standard deviation n = 10. Comparisons between the two groups were conducted using an unpaired t-test. Comparisons between multiple groups were analyzed by one-way ANOVA with Tukey’s post hoc test. Repeated-measures analysis of variance was used for data comparison between groups at different time points and Bonferroni was performed for post hoc test.
FIGURE 7
FIGURE 7
The underlying mechanism concerning miR-320a in NSCLC was explored. Elevated miR-320a inhibited expression of HIF1α and KDM5B. Besides, KDM5B could enhance the radioresistance of NSCLC via inhibition of PTEN. Further, up-regulated miR-320a inhibited radioresistance of NSCLC by promoting methylation of PTEN through repressing HIF1α.

Similar articles

Cited by

References

    1. Ayuk S. M., Abrahamse H., Houreld N. N. (2016). The role of photobiomodulation on gene expression of cell adhesion molecules in diabetic wounded fibroblasts in vitro. J. Photochem. Photobiol. B 161 368–374. 10.1016/j.jphotobiol.2016.05.027 - DOI - PubMed
    1. Bayo J., Tran T. A., Wang L., Pena-Llopis S., Das A. K., Martinez E. D. (2018). Jumonji inhibitors overcome radioresistance in cancer through changes in H3K4 methylation at double-strand breaks. Cell Rep. 25 1040.e5–1050.e5. 10.1016/j.celrep.2018.09.081 - DOI - PMC - PubMed
    1. Chen S., Wang H., Ng W. L., Curran W. J., Wang Y. (2011). Radiosensitizing effects of ectopic miR-101 on non-small-cell lung cancer cells depend on the endogenous miR-101 level. Int. J. Radiat. Oncol. Biol. Phys. 81 1524–1529. 10.1016/j.ijrobp.2011.05.031 - DOI - PubMed
    1. Dawe D. E., Christiansen D., Swaminath A., Ellis P. M., Rothney J., Rabbani R., et al. (2016). Chemoradiotherapy versus radiotherapy alone in elderly patients with stage III non-small cell lung cancer: a systematic review and meta-analysis. Lung. Cancer 99 180–185. 10.1016/j.lungcan.2016.07.016 - DOI - PubMed
    1. Digesu C. S., Weiss K. D., Colson Y. L. (2018). Near-Infrared sentinel lymph node identification in non-small cell lung cancer. JAMA Surg. 153 487–488. 10.1001/jamasurg.2017.5928 - DOI - PMC - PubMed