. 2020 Oct 10;5(12):2183-2194.
doi: 10.1016/j.ekir.2020.09.047. eCollection 2020 Dec.

Comparison of Longitudinal Membrane Function in Peritoneal Dialysis Patients According to Dialysis Fluid Biocompatibility

Affiliations

Comparison of Longitudinal Membrane Function in Peritoneal Dialysis Patients According to Dialysis Fluid Biocompatibility

A T N van Diepen et al. Kidney Int Rep. .

Abstract

Introduction: Preservation of peritoneal function is essential in long-term peritoneal dialysis. Biocompatible dialysis solutions might prevent or postpone the membrane alteration resulting in ultrafiltration failure and consecutive morbidity and mortality.

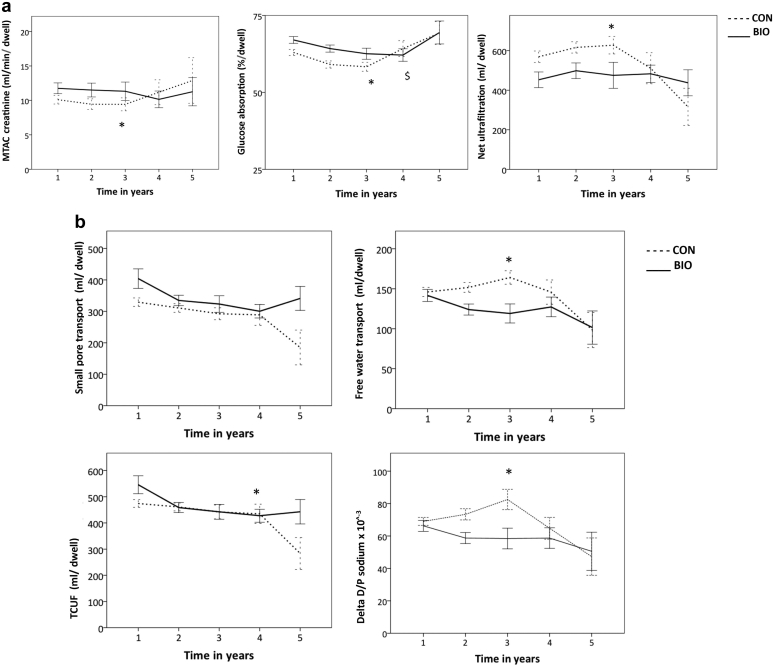
Methods: We conducted an observational cohort study in which we made a longitudinal comparison between the course of peritoneal solute and fluid transport during treatment with conventional and biocompatible solutions. Therefore, prospectively collected peritoneal transport data from the yearly standard peritoneal permeability analysis were analyzed in 251 incident patients treated between 1994 and censoring in 2016. Fluid transport included small pore and free water transport. Solute transport was assessed by creatinine mass transfer area coefficient and glucose absorption. Linear mixed models including change point analyses were performed. Interaction with peritonitis was examined.

Results: One hundred thirty-five patients received conventional and 116 biocompatible solutions. Sixty-seven percent (conventional) and 64% (biocompatible) of these underwent minimally three transport measurements. Initially, biocompatible fluids showed higher small solute transport and lower ultrafiltration than conventional fluids up to 3 years. Thereafter, conventional fluids showed an increase in small solute transport (+2.7 ml/min per year; 95% confidence interval [CI]: 0.9 to 4.5) and a decrease of free water transport (-28.0 ml/min per year; 95% CI: -60.4 to 4.4). These were minor or absent in biocompatible treatment. Peritonitis induced a decrease of transcapillary ultrafiltration after 2 years on dialysis with conventional solutions (-291 ml/min per year; 95% CI: -550 to -32) while this was absent in biocompatible treatment.

Conclusion: Despite a higher initial solute transport with biocompatible solutions, these have less influence on functional long-term peritoneal alterations than conventional solutions.

Keywords: dialysis solution; long-term renal replacement therapy; peritoneal dialysis; peritoneal transport; peritonitis.


Figures

None
Graphical abstract
Figure 1
Figure 1
Flowchart representing patient selection. ∗Reasons for exclusion include missing baseline standardized potential permeability analysis (SPA), follow-up SPA, or data on peritonitis. CON, treated with conventional solutions; BIO, treated with more biocompatible solutions; P+, with peritonitis during follow-up; P−, without peritonitis during follow-up.
Figure 2
Figure 2
(a,b) Peritoneal transport parameters over time (mean ± SEM) in patients treated with conventional (CON) or more biocompatible (BIO) dialysis solutions. Based on the model best describing the course of the peritoneal transport parameter presented in this figure, a change point is marked (if applicable). An asterisk (∗) indicates that a change point in the model describing the course of CON is required; a dollar sign ($) indicates that a change point in model describing the course of BIO is required. The comparison of the best fitting models per parameter and treatment group is presented in Table 3. MTAC, mass transfer coefficient; SPA, standardized peritoneal permeability analysis.
Figure 3
Figure 3
(a,b) The interaction of peritonitis with the course of peritoneal transport over time in patients treated with conventional (CON) or more biocompatible (BIO) dialysis solutions (mean ± SEM). Based on the model best describing the course of the peritoneal transport parameter presented, a change point is marked (if applicable). An asterisk (∗) indicates a that change point in the model describing the course of CON is required; a dollar sign ($) indicates that a change point in model describing the course of BIO is required. The comparison of the best-fitting models per parameter and treatment group stratified by the occurrence of peritonitis is presented in Table 4. P+, with peritonitis during follow-up; P−, without peritonitis during follow-up; MTAC, mass transfer coefficient; SPA, standardized peritoneal permeability analysis; TCUF, transcapillary ultrafiltration.
Figure 3
Figure 3
(a,b) The interaction of peritonitis with the course of peritoneal transport over time in patients treated with conventional (CON) or more biocompatible (BIO) dialysis solutions (mean ± SEM). Based on the model best describing the course of the peritoneal transport parameter presented, a change point is marked (if applicable). An asterisk (∗) indicates a that change point in the model describing the course of CON is required; a dollar sign ($) indicates that a change point in model describing the course of BIO is required. The comparison of the best-fitting models per parameter and treatment group stratified by the occurrence of peritonitis is presented in Table 4. P+, with peritonitis during follow-up; P−, without peritonitis during follow-up; MTAC, mass transfer coefficient; SPA, standardized peritoneal permeability analysis; TCUF, transcapillary ultrafiltration.

References

    1. Davies S.J., Philips L., Nash P.F. Peritoneal glucose exposure and changes in membrane solute transport with time on peritoneal dialysis. J Am Soc Nephrol. 2001;12:1046–1051. - PubMed
    1. Bartosova M., Schaefer B., Vondrak K. Peritoneal dialysis vintage and glucose exposure but not peritonitis episodes drive peritoneal membrane transformation during the first years on PD. Front Physiol. 2019;10:356. - PMC - PubMed
    1. Coester A.M., Smit W., Struijk D.G. Longitudinal analysis of fluid transport and their determinants in PD patients. Perit Dial Int. 2014;34:195–203. - PMC - PubMed
    1. Wieslander A.P., Nordin M.K., Kjellstrand P.T. Toxicity of peritoneal dialysis fluids on cultured fibroblasts, L-929. Kidney Int. 1991;40:77–79. - PubMed
    1. Lieberek T., Topley N., Jorres A. Peritoneal dialysis fluid inhibition of polymorphonuclear leucocyte respiratory burst activation is related to the lowering of intracellular pH. Nephron. 1993;65:260–265. - PubMed

LinkOut - more resources