. 2020 Nov 18;23(12):101820.
doi: 10.1016/j.isci.2020.101820. eCollection 2020 Dec 18.

AUTS2 Governs Cerebellar Development, Purkinje Cell Maturation, Motor Function and Social Communication

Affiliations

AUTS2 Governs Cerebellar Development, Purkinje Cell Maturation, Motor Function and Social Communication

Kunihiko Yamashiro et al. iScience. .

Abstract

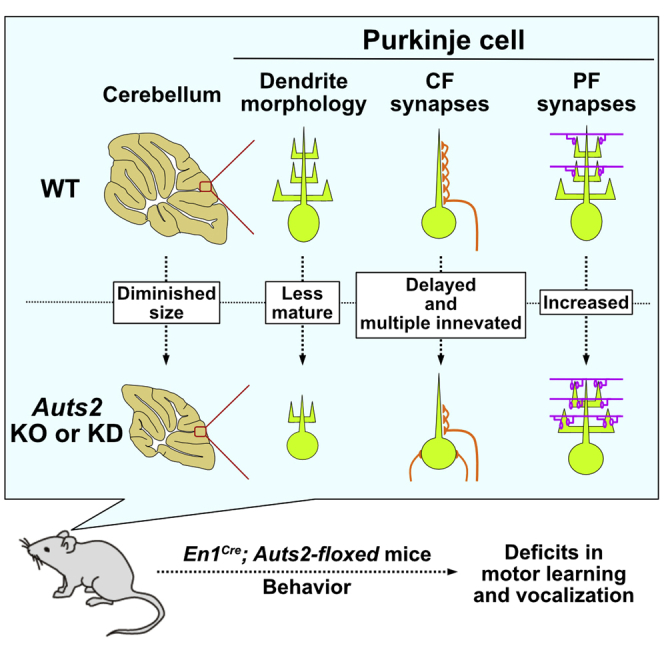
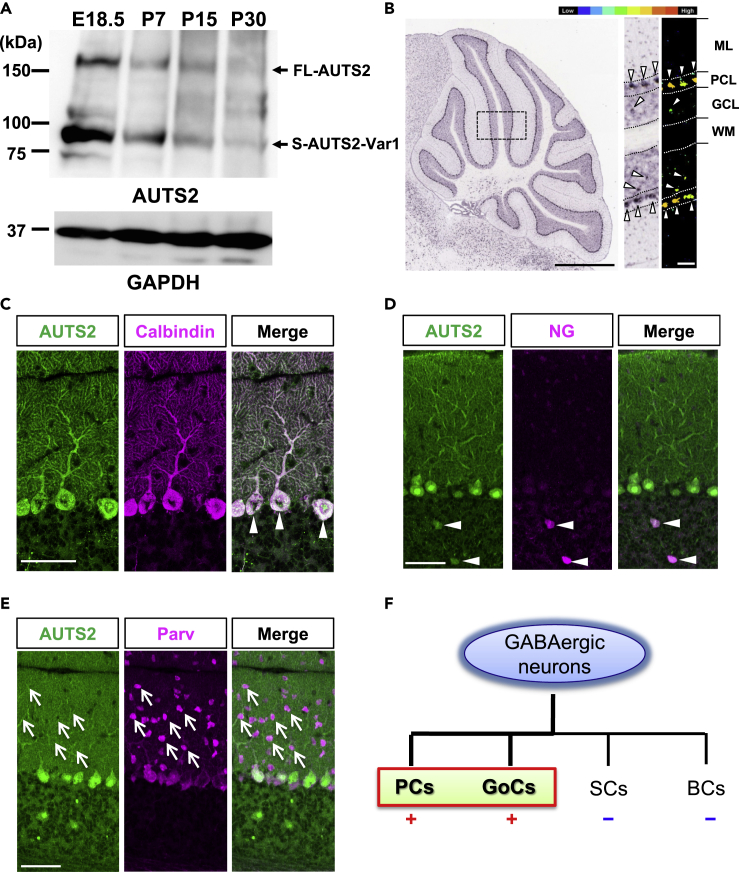
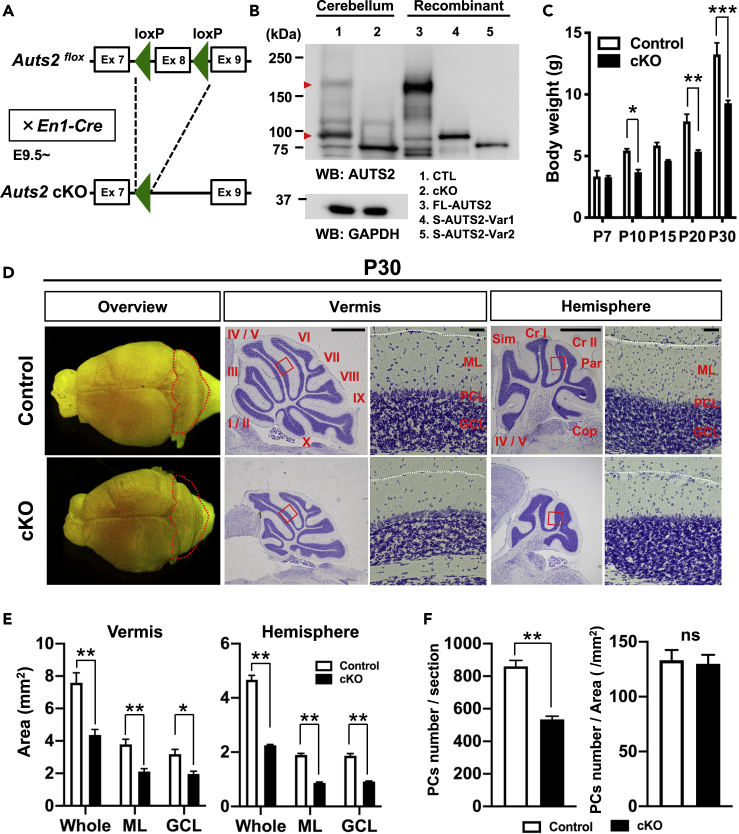
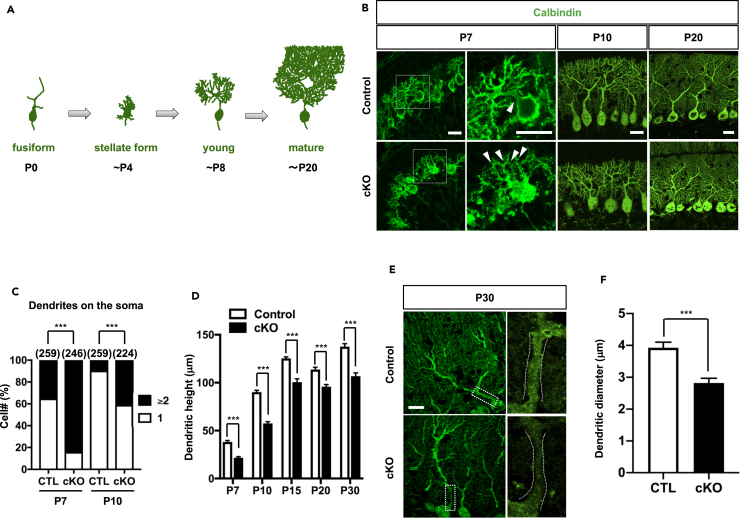
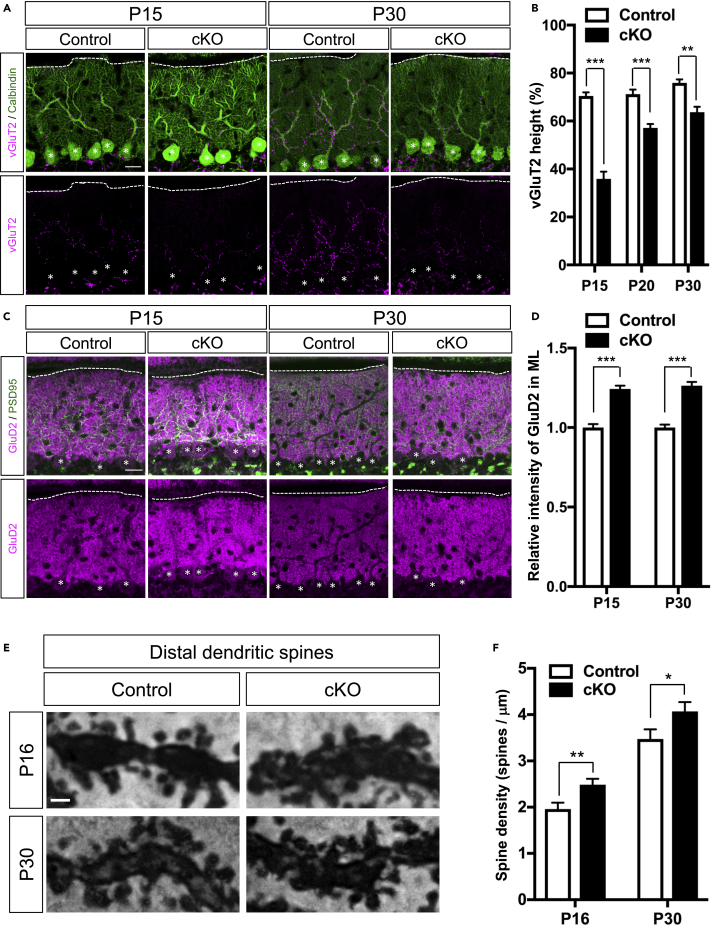
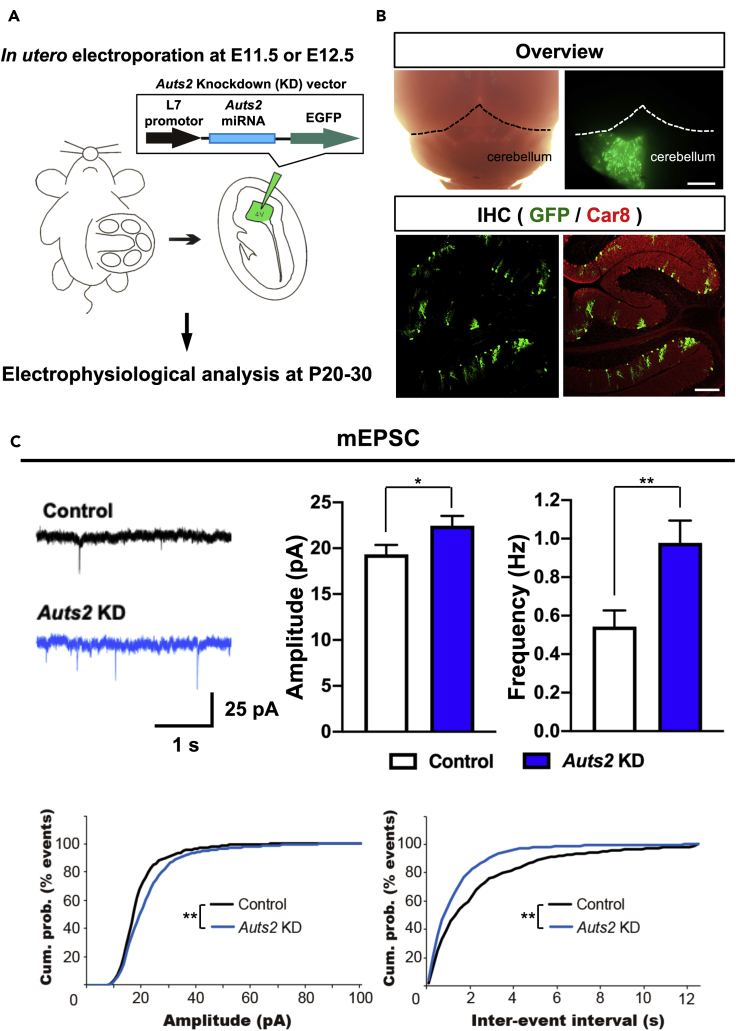
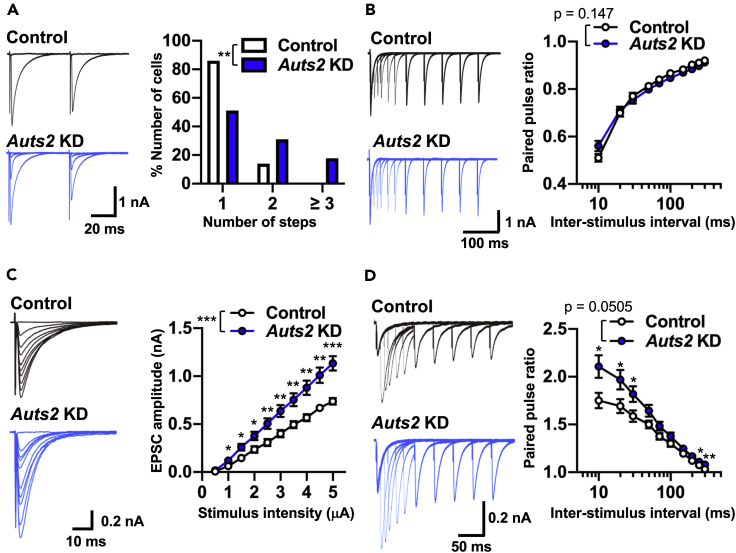
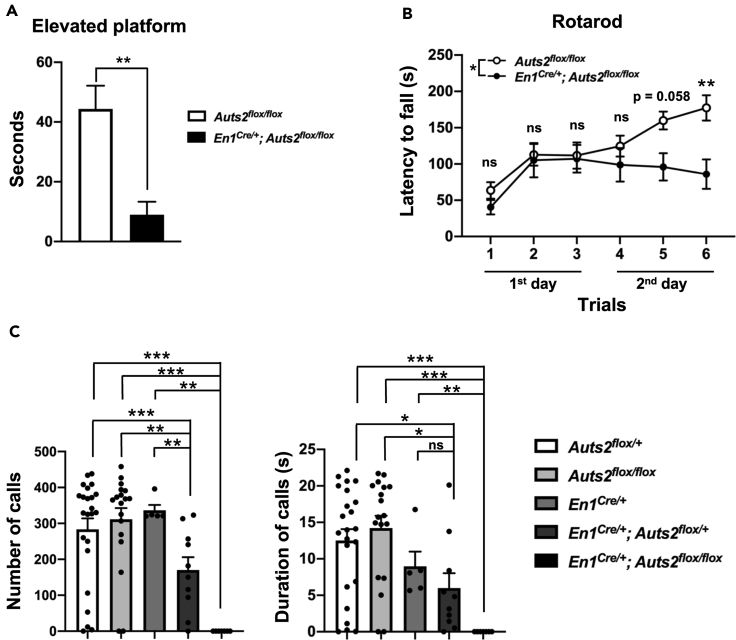
Autism susceptibility candidate 2 (AUTS2), a risk gene for autism spectrum disorders (ASDs), is implicated in telencephalon development. Because AUTS2 is also expressed in the cerebellum where defects have been linked to ASDs, we investigated AUTS2 functions in the cerebellum. AUTS2 is specifically localized in Purkinje cells (PCs) and Golgi cells during postnatal development. Auts2 conditional knockout (cKO) mice exhibited smaller and deformed cerebella containing immature-shaped PCs with reduced expression of Cacna1a. Auts2 cKO and knock-down experiments implicated AUTS2 participation in elimination and translocation of climbing fiber synapses and restriction of parallel fiber synapse numbers. Auts2 cKO mice exhibited behavioral impairments in motor learning and vocal communications. Because Cacna1a is known to regulate synapse development in PCs, it suggests that AUTS2 is required for PC maturation to elicit normal development of PC synapses and thus the impairment of AUTS2 may cause cerebellar dysfunction related to psychiatric illnesses such as ASDs.

Keywords: Cellular Neuroscience; Developmental Neuroscience; Molecular Neuroscience.


Conflict of interest statement

The authors declare no competing interests.

Figures

None
Graphical abstract
Figure 1
Figure 1
AUTS2 Expression in the Inhibitory Neurons in the Cerebellar Cortex (A) Expression of AUTS2 in the developing cerebellum. Arrows indicate the full-length (FL-AUTS2) or C-terminal short isoform variant 1 (S-AUTS2-Var1) of AUTS2 protein. (B) In situ hybridization for Auts2 in P56 cerebellum (adapted from the Allen Brain Atlas, experiment #79904156). Arrowheads indicate the expression of Auts2 mRNA. ML: Molecular layer, PCL: Purkinje cell layer, GCL: Granule cell layer, WM: White matter. Scale bar, 1 mm (left panel) and 100 μm (right panel). (C–E) Co-immunostaining of AUTS2 with inhibitory neuronal markers Calbindin (Purkinje cells), Neurogranin (NG; Golgi cells), and Parvalbumin (Parv; interneurons including stellate cells and basket cells at ML and Purkinje cells) in P25 cerebellar cortex. AUTS2 is expressed in Purkinje cells and Golgi cells (arrowheads in C and D), whereas there are no detectable signals in the molecular layer interneurons (arrows in E). Scale bars, 50 μm. (F) Summary diagram of AUTS2+ cells in inhibitory neurons in cerebellar cortex. PCs: Purkinje cells, GoCs: Golgi cells, SCs: stellate cells, BCs: basket cells. See also Figure S1.
Figure 2
Figure 2
Cerebellar Hypoplasia in Auts2 Conditional Knockout Mice (A) Schematics of the targeting strategy for Auts2 conditional knockout (Auts2 cKO) mice. Exon 8 of Auts2 gene was conditionally deleted by crossing Auts2-floxed mice with Engrailed-1Cre/+ (En1Cre/+) mice. (B) Immunoblot for AUTS2 proteins in cerebellar lysates from Auts2flox/flox (Control; CTL) and En1Cre/+;Auts2flox/flox homozygotic cKO mice at P0. Immunoblot of lysates from HEK293T cells expressing the recombinant full-length AUTS2 (FL-AUTS2) and the C-terminal AUTS2 short variants (S-AUTS2-Var1 and Var2) are also shown. Full-length AUTS2 as well as the S-AUTS2-Var1 were completely eliminated in Auts2 cKO homozygotic mutant cerebellum (red arrowheads), whereas the S-AUTS2-Var2 was alternatively increased. (C) Plot of body weights in control and Auts2 cKO mice from P7 to P30. n = 2–7 mice. (D) Whole-mount images and Nissl-stained parasagittal sections in control and Auts2 cKO mice at P30. The folia of vermis and hemisphere are indicated as roman numerals (I-X) and abbreviations (Sim: Simple lobule, Cr I and II: Crus I and II, Par: Paramedian lobule, Cop: Copula pyramidis). Higher magnification images of the boxed regions showing ML-PCL-GCL laminar structure. ML: Molecular layer, PCL: Purkinje cell layer, GCL: Granule cell layer. Scale bar, 1 mm and 50 μm. (E) Quantification of cerebellar areas including whole, molecular layer (ML), granule cell layer (GCL) in parasagittal sections of control and Auts2 cKO mice at P30. n = 6 slices from 3 mice. (F) The number of PCs was decreased in the cerebellar vermis of Auts2 cKO at P30 compared with the control, but the density of PCs was normal. n = 5 slices from 5 mice. Data are shown as mean ± SEM. ∗p < 0.05, ∗∗p < 0.01, ∗∗∗p < 0.001 by two-way ANOVA followed by Bonferroni's multiple comparisons test in (C), Mann-Whitney test in (E and F). See also Figures S2–S6.
Figure 3
Figure 3
Loss of Auts2 Induces Impaired Maturation of PCs (A) Schematics of PC morphology during the postnatal development. (B) Representative immunofluorescent images of Calbindin-positive PCs in lobule IV/V from P7 to P20 in control (upper panels) and Auts2 cKO mice (lower panels). Arrowheads indicate dendrites on the soma. Scale bars, 20 μm. (C) Proportion of the number of primary dendrites formed on single PC soma in lobule IV/V at P7 and P10 in control (CTL) and Auts2 cKO mice. n = 259 cells from 3 mice at P7 and P10 for control mice, and n = 246 cells from 3 mice at P7, n = 224 cells from 3 mice at P10 for Auts2 cKO mice. (D) Measurement of dendrite lengths of PCs in lobule IV/V toward the pia surface during postnatal development. n = 12–15 cells from 3 mice for control and Auts2 cKO mice. (E) Representative images of primary dendritic shafts of PCs in lobule IV/V labeled with Calbindin at P30 in control and Auts2 cKO mice. Scale bar, 20 μm. (F) Reduced PC primary dendrite thickness of lobule IV/V in Auts2 cKO mice. n = 12–14 cells from 3 mice. Data are shown as mean ± SEM. ∗p < 0.05, ∗∗p < 0.01, ∗∗∗p < 0.001 by Chi-squared test in (C), two-way ANOVA followed by Bonferroni's multiple comparisons test in (D), Mann-Whitney test in (F). See also Figure S7.
Figure 4
Figure 4
Delayed CF Translocation and Excessive PF Formation in Auts2 Conditional Knockout Mice (A) Double immunostaining with calbindin (green) and climbing fiber (CF) synaptic marker VGlut2 (magenta) on the cerebellar lobule IV/V of control and Auts2 cKO mice at P15 and P30. Scale bars, 20 μm. (B) Quantitative analysis of the ratio of VGlut2 height to the tip of PC dendrites of lobule IV/V in control and Auts2 cKO cerebellum during P15-30. n = 12–15 cells from 3 mice. (C) Representative images of co-immunostaining with PSD-95 (green) and parallel fiber (PF) postsynaptic marker GluD2 (magenta) of lobule IV/V in the molecular layer (ML) of control and Auts2 cKO mice at P15 and P30. Scale bars, 20 μm. (D) Increased immunofluorescence intensity levels of GluD2 in lobule IV/V of Auts2 cKO mice at P15 and P30. n = 72–108 areas from 3 mice. (E) Representative images of the dendritic spines on distal PC dendrites in the Golgi-stained cerebellar lobule IV/V of control and Auts2 cKO mice at P16 and P30. Scale bar, 1 μm. (F) The density of distal dendritic spines on PCs of lobule IV/V was increased in Auts2 cKO mice at P16 and P30. n = 18–27 branches, 3 mice. Data are shown as mean ± SEM. ∗p < 0.05, ∗∗p < 0.01, ∗∗∗p < 0.001 by two-way ANOVA followed by Bonferroni's multiple comparisons test in (B), Mann-Whitney test or unpaired Student's t-test in (D and F). Dotted lines and asterisks indicate the pial surface of the ML and PC soma, respectively. See also Figures S8–S11.
Figure 5
Figure 5
Knockdown of Auts2 in PCs Exhibits Enhanced Excitatory Synaptic Transmission (A) Schematic diagrams indicate the knockdown (KD) experiments of Auts2 with PC-specific expression vector. (B) Whole-mount and immunohistochemical images showing the successful introduction of Auts2-KD vector into PCs. EGFP-positive cells are co-labeled with a PC marker, Car8 (red). Scale bar; 1 mm (upper), 200 μm (lower). (C) Auts2-KD PCs enhance amplitude and frequency of mEPSC at P20-30. Panels show representative traces (upper left) and summary graphs of the mEPSC amplitude and frequency (upper right). Bottom, cumulative probability distributions of mEPSC amplitudes (left) and inter-event interval (right) in control and Auts2-KD PCs. n = 11 cells, 6 mice for control and n = 13 cells, 5 mice for Auts2 KD. Data are shown as mean ± SEM. ∗p < 0.05, ∗∗p < 0.01, by unpaired student t-test in bar plots, Kolmogorov-Smirnov test in cumulative frequency plots. See also Figures S12–S14.
Figure 6
Figure 6
Knockdown of Auts2 in PCs Impairs CF Synapse Elimination and PF Synaptic Transmission (A) Sample traces of CF-EPSCs (left) and frequency distributions of the number of CFs innervating each PC (right) for Auts2-KD (blue) and control (white) PCs during P21-P30. n = 37 cells, 3 mice for control and n = 33 cells, 3 mice for Auts2 KD. (B) Normal paired-pulse ratio of CF-EPSCs measured at increasing inter-stimulus intervals in control and Auts2-KD PCs at P20-30 (left, representative traces; right, summary plots). n = 13 cells, 3 mice for control and n = 26 cells, 3 mice for Auts2 KD. (C) Impaired input-output relationship of PF-EPSCs in Auts2-KD PCs at P20-30. (left, representative traces; right, summary plots). n = 14 cells, 6 mice for control and n = 17 cells, 6 mice for Auts2 KD. (D) Impaired paired-pulse ratio of PF-EPSCs in Auts2-KD PCs at P20-30 (left, representative traces; right, summary graph). n = 13 cells, 6 mice for control and n = 16 cells, 6 mice for Auts2 KD. Data are shown as mean ± SEM. ∗p < 0.05, ∗∗p < 0.01, ∗∗∗p < 0.001, by Mann-Whitney U test in A, two-way ANOVA with Tukey's post hoc analysis in B-D. See also Figure S15 and Table S1.
Figure 7
Figure 7
Motor Dysfunction and Impaired Vocal Communication in Auts2 cKO Mice (A) Auts2 cKO mice exhibit motor abnormality in elevated platform test. n = 8 mice. (B) Auts2 cKO mice show impaired motor learning in an accelerating rotarod test. n = 13 mice for control mice and 9 mice for Auts2 cKO mice. (C) USV recordings show the severe impairments of vocal communication in Auts2 cKO mice. n = 23 mice for Auts2flox/+ mice, 18 mice for Auts2flox/flox mice, 5 mice for En1Cre/+ mice, 10 mice for En1Cre/+; Auts2flox/+ mice, 7 mice for En1Cre/+; Auts2flox/flox mice. Data are shown as mean ± SEM. ∗p < 0.05, ∗∗p < 0.01, ∗∗∗p < 0.001 by Mann-Whitney test in (A and C), two-way ANOVA followed by Bonferroni's multiple comparisons test in (B).

References

    1. Aiba A., Kano M., Chen C., Stanton M.E., Fox G.D., Herrup K., Zwingman T.A., Tonegawa S. Deficient cerebellar long-term depression and impaired motor learning in mGluR1 mutant mice. Cell. 1994;79:377–388. - PubMed
    1. Altman J. Postnatal development of the cerebellar cortex in the rat. II. Phases in the maturation of Purkinje cells and of the molecular layer. J. Comp. Neurol. 1972;145:399–463. - PubMed
    1. Altman J., Bayer S.A. Prenatal development of the cerebellar system in the rat. II. Cytogenesis and histogenesis of the inferior olive, pontine gray, and the precerebellar reticular nuclei. J. Comp. Neurol. 1978;179:49–75. - PubMed
    1. Alvarez-Saavedra M., De Repentigny Y., Lagali P.S., Raghu Ram E.V., Yan K., Hashem E., Ivanochko D., Huh M.S., Yang D., Mears A.J. Snf2h-mediated chromatin organization and histone H1 dynamics govern cerebellar morphogenesis and neural maturation. Nat. Commun. 2014;5:4181. - PMC - PubMed
    1. Amaral D.G., Schumann C.M., Nordahl C.W. Neuroanatomy of autism. Trends Neurosci. 2008;31:137–145. - PubMed

LinkOut - more resources