. 2020 Nov 20;23(12):101832.
doi: 10.1016/j.isci.2020.101832. eCollection 2020 Dec 18.

SHP2 Inhibition Influences Therapeutic Response to Tepotinib in Tumors with MET Alterations

Affiliations

SHP2 Inhibition Influences Therapeutic Response to Tepotinib in Tumors with MET Alterations

Linda Pudelko et al. iScience. .

Abstract

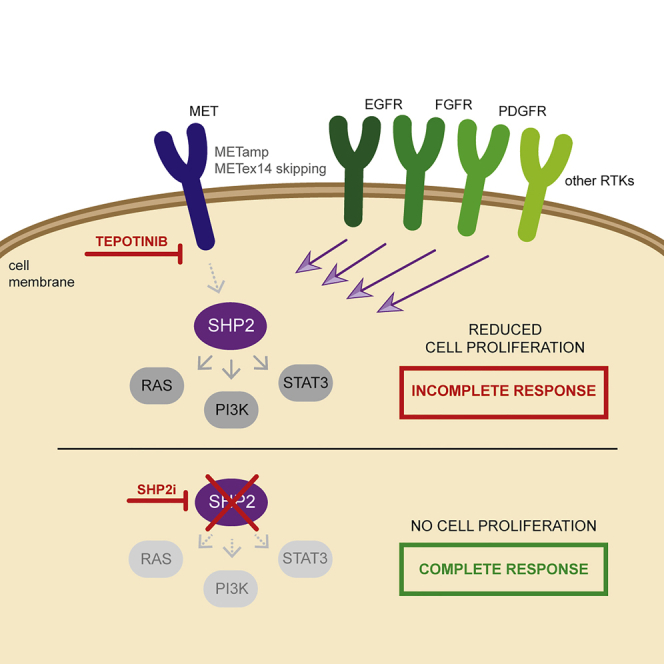
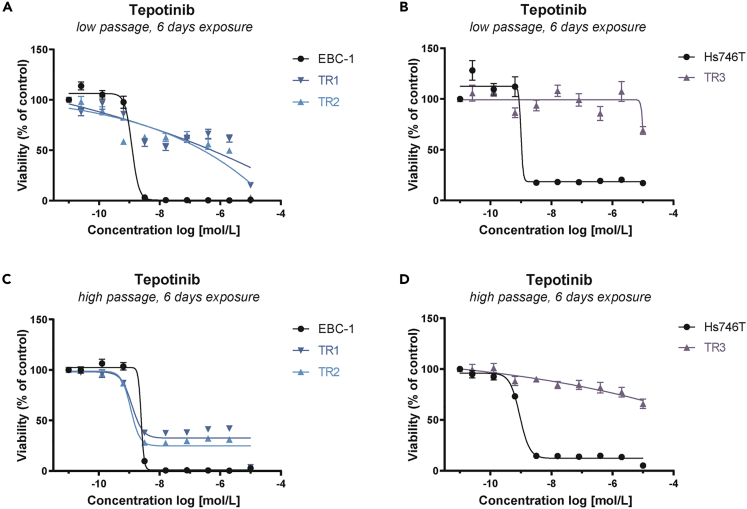
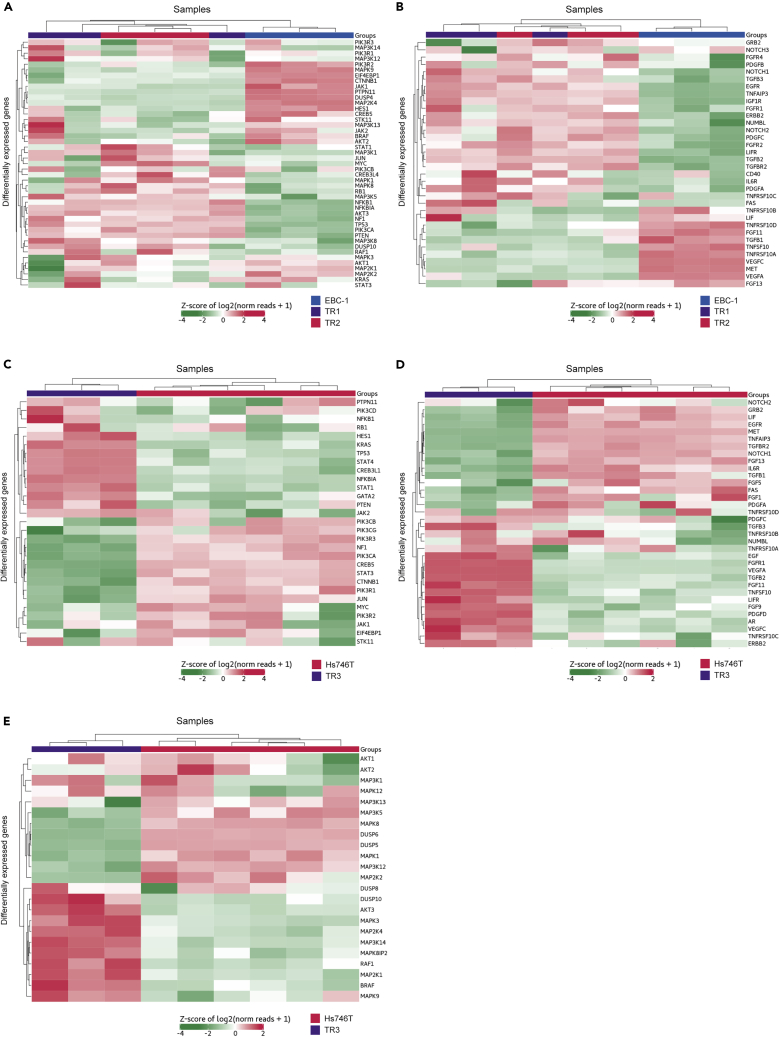
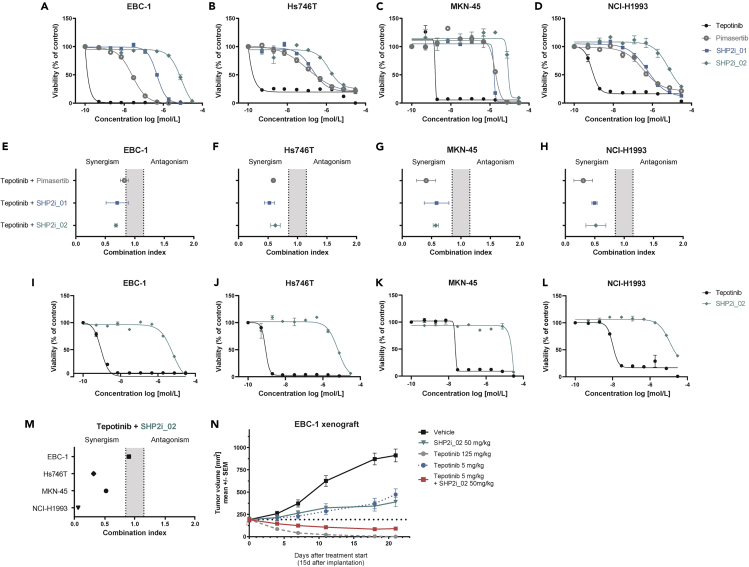
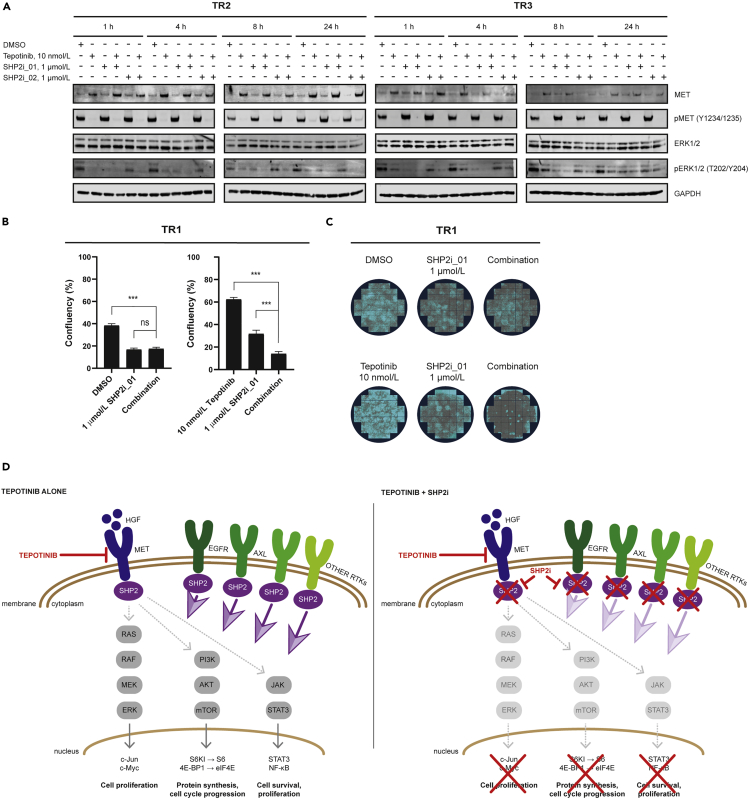
Tepotinib is an oral MET inhibitor approved for metastatic non-small cell lung cancer (NSCLC) harboring MET exon 14 (METex14) skipping mutations. Examining treatment-naive or tepotinib-resistant cells with MET amplification or METex14 skipping mutations identifies other receptor tyrosine kinases (RTKs) that co-exist in cells prior to tepotinib exposure and become more prominent upon tepotinib resistance. In a small cohort of patients with lung cancer with MET genetic alterations treated with tepotinib, gene copy number gains of other RTKs were found at baseline and affected treatment outcome. An Src homology 2 domain-containing phosphatase 2 (SHP2) inhibitor delayed the emergence of tepotinib resistance and synergized with tepotinib in treatment-naive and tepotinib-resistant cells as well as in xenograft models. Alternative signaling pathways potentially diminish the effect of tepotinib monotherapy, and the combination of tepotinib with an SHP2 inhibitor enables the control of tumor growth in cells with MET genetic alterations.

Keywords: Cancer; Treatment.


Conflict of interest statement

L.P., F.J., C.R., C.S., N.L., M.S., D.M., M.K., C.E., A.B., K.M.S., and N.K. are employees of Merck KGaA. A.B. and M.S. hold stocks in Merck KGaA. No other potential conflict of interest relevant to this article was reported.

Figures

None
Graphical abstract
Figure 1
Figure 1
Generation of EBC-1 and Hs746T Cells with Acquired Resistance to Tepotinib (A–D) Dose-response curves for tepotinib in parental tepotinib-sensitive (EBC-1, Hs746T) and tepotinib-resistant (TR1, TR2, TR3) cell lines with (A and B) low passage number (#5) and (C and D) high passage number (#12) upon exposure for 6 days. Data are expressed as the mean ± SEM percentage fluorescent values relative to the corresponding DMSO control. Each experiment was performed in technical replicates (n = 6). TR1, tepotinib-resistant EBC-1 cell line #1; TR2, tepotinib-resistant EBC-1 cell line #2; TR3, tepotinib-resistant Hs746T #1; SEM, standard error of the mean.
Figure 2
Figure 2
Differential Gene Expression Profiling of Tepotinib-Resistant Cell Lines Digital gene expression quantification was performed using NanoString nCounter applying NanoString nCounter PanCancer Pathways Panel Assay (NanoString Technologies). The indicated relative expression data represent normalized and unsupervised clustering of parental and tepotinib-resistant cell lines. Horizontal rows represent individual genes and vertical columns represent individual cell lines. The color scale at the bottom of each heatmap depicts the corresponding gene expression levels, red indicating elevated expression, green indicating reduced expression. The DEGs in TR1, TR2, and TR3 that exhibited a log2-fold change >1.0 or <-1.0 and p< 0.05 compared to the parental cell lines are shown. Heatmap clustering of selected genes representative for (A) oncogenic signaling pathways or (B) RTKs comparing expression in EBC-1 cells (blue bars) with TR1 (purple bars) and TR2 (red bars). Heatmap clustering of selected genes representative for (C and E) oncogenic signaling pathways or (D) RTKs comparing expression in Hs746T cells (red bars) with TR3 (purple bars). RTKs, receptor-tyrosine kinases; TR1, tepotinib-resistant EBC-1 cell line #1; TR2, tepotinib-resistant EBC-1 cell line #2; TR3, tepotinib-resistant Hs746T #1; DEGs, differentially expressed genes.
Figure 3
Figure 3
Acquired Resistance to Tepotinib Is Associated with the Activation of Multiple Oncogenic Signaling Nodes (A) Results of phospho-RTK array analysis in parental tepotinib-sensitive (EBC-1, Hs746T) and tepotinib-resistant (TR1, TR2, TR3) cell lines. The phosphorylation status of 49 RTKs was assessed in each cell line using the Proteome Profiler Human Phospho-RTK Array Kit. Reference spots in the corners (A1, A2, A23, A24, F1, F2) represent positive controls, and PBS spots (F23, F24) represent negative controls for determination of background values. (B) Phospho-kinase array analyses in parental tepotinib-sensitive (EBC-1, Hs746T) and tepotinib-resistant (TR1, TR2, TR3) cell lines. The phosphorylation status of 43 kinases and 2 related proteins was assessed in each cell line using the Proteome Profiler Human Phospho-Kinase Array Kit. Reference spots in the corners (A1, A2, A17, A18, G1, G2) represent positive controls, and PBS spots (G9, G10, G17, G18) represent negative controls. (C) Heatmap of phospho-RTK array data indicating the absolute integrated pixel density values. (D) Heatmap of phospho-kinase array data indicating the absolute integrated pixel density values. TR1, tepotinib-resistant EBC-1 cell line #1; TR2, tepotinib-resistant EBC-1 cell line #2; TR3, tepotinib-resistant Hs746T #1.
Figure 4
Figure 4
Molecular and Clinical Profile of Patients with NSCLC with METex14 Skipping Mutations or MET Amplification Treated with Tepotinib (A) Oncoprint describing the baseline clinical characteristics of each patient. (B) Waterfall plot of tumor burden change at best overall response in nine patients. Dashed lines represent the thresholds for partial response (−30%) and progressive disease (+20%). (C) Oncoprint representing the alterations detected in each patient. Individual samples are represented as columns and individual genes are represented as rows. Identified mechanisms of resistance are annotated with x. (D) The radiological tumor evolution in a patient with METex14 skipping mutation without co-occurring genetic alterations. Left: computed tomography (CT) scans at baseline indicate a lung lesion and pleural infiltration. Right: CT scans indicate an almost complete response after two cycles of tepotinib. M, male; F, female; d, days; L, line; PR, partial response; SD, stable disease; NE, non-evaluable; amp, amplification; VAF, variant allelic frequency; GCN, gene copy number.
Figure 5
Figure 5
MET and SHP2 Blockade Inhibit the Proliferation and Growth of Cells in Models Exhibiting MET Genetic Alterations (A–D) Dose-response curves for cells treated with tepotinib, SHP2i_01, SHP2i_02, or pimasertib for 6 days in 2D. Data are expressed as the mean ± SEM percentage fluorescent values relative to the corresponding DMSO control. (E–H) Cells grown in 2D were treated with a 6 x 6 combination matrix of tepotinib and SHP2i_01, SHP2i_02, or pimasertib for 6 days. The combination index (CI < 1) was determined using the Loewe combination method. (I–L) Dose-response curves for tepotinib, SHP2i_01, SHP2i_02, and pimasertib in MET-altered cell lines. (M) Cells grown in 3D were treated with a 6 x 6 combination matrix of tepotinib and SHP2i_02 for 6 days. The combination index (CI < 1) was analyzed using the Loewe combination method. (N) Antitumor activity of tepotinib and SHP2i_02 as monotherapy and combination therapy in EBC-1 xenografts. 10 mice were included in each treatment group. Each compound was applied once daily via oral gavage. Data are expressed as the mean ± SEM. d, days; SEM, standard error of the mean.
Figure 6
Figure 6
SHP2 Inhibition Delays the Emergence of Resistance to Tepotinib in MET-Amplified Cells (A) Western blot analysis of the effect of tepotinib treatment at the indicated concentrations for 24 h followed by culture in the absence of tepotinib for 1, 3 or 6 days. Beta actin served as a loading control. (B) Schematic depiction of the experimental treatment cycle ‘a’ and ‘b’. (C) Real-time proliferation of EBC-1 cells during exposure cycles to tepotinib and SPH2i_02 for 24 h followed by SPH2i_02 for 6 days, compared to tepotinib alone. (D) Real-time proliferation of EBC-1 cells during exposure cycles to tepotinib alone for 24 h followed by SPH2i_02 for 6 days, compared to tepotinib alone. (E) Real-time proliferation upon exposure of SPH2i_02 alone. For (C–E) real-time proliferation was determined based on weekly measurements of cell surface confluency using IncuCyte S3 system. d, days; h, hours.
Figure 7
Figure 7
SHP2 Inhibition Reverts Established Resistance to Tepotinib in MET-Altered Cells (A) Western blot analysis of the effect of tepotinib with or without SHP2i_01 or SHP2i_02 at the indicated concentrations and treatment times on phospho-MET and phospho-ERK1/2 levels in the tepotinib-resistant cell lines TR2 and TR3. GAPDH expression was monitored to control for equivalent loading of protein in each gel lane. (B and C) Clonogenic assays in tepotinib-resistant cell line TR1 to determine the effect of the combination of tepotinib with SHP2i_01. A total of 47 images were analyzed per well, and data are shown as the mean ± SEM. (D) Schematic of the effects of tepotinib as monotherapy or in combination with an SHP2 inhibitor. Inhibition of MET via tepotinib leads to suppression of the oncogenic MAPK, PI3K/AKT, and STAT3 signaling pathways. Resistance to tepotinib is associated with the upregulation of alternate RTKs such as EGFR and AXL, which activate SHP2 to reactivate MAPK, PI3K/AKT, and STAT3 signaling. Combined inhibition of MET and SHP2 prevents the emergence of resistance to tepotinib by inhibiting reactivation of MAPK, PI3K/AKT, and STAT3, thereby sustaining antitumor efficacy. TR1, tepotinib-resistant EBC-1 cell line #1; TR2, tepotinib-resistant EBC-1 cell line #2; TR3, tepotinib-resistant Hs746T #1; h, hours; RTK, receptor tyrosine kinase; SEM, standard error of the mean.

References

    1. Ahmed T.A., Adamopoulos C., Karoulia Z., Wu X., Sachidanandam R., Aaronson S.A., Poulikakos P.I. SHP2 drives adaptive resistance to ERK signaling inhibition in molecularly defined subsets of ERK-dependent tumors. Cell Rep. 2019;26:65–78.e5. - PMC - PubMed
    1. Awad M.M., Oxnard G.R., Jackman D.M., Savukoski D.O., Hall D., Shivdasani P., Heng J.C., Dahlberg S.E., Janne P.A., Verma S. MET exon 14 mutations in non-small-cell lung cancer are associated with advanced age and stage-dependent MET genomic amplification and c-met overexpression. J. Clin. Oncol. 2016;34:721–730. - PubMed
    1. Backes A., Zech B., Felber B., Klebl B., Muller G. Small-molecule inhibitors binding to protein kinase. Part II: the novel pharmacophore approach of type II and type III inhibition. Expert Opin. Drug Discov. 2008;3:1427–1449. - PubMed
    1. Collie G.W., Koh C.M., O'Neill D.J., Stubbs C.J., Khurana P., Eddershaw A., Snijder A., Mauritzson F., Barlind L., Dale I.L. Structural and molecular insight into resistance mechanisms of first generation cMET inhibitors. ACS Med. Chem. Lett. 2019;10:1322–1327. - PMC - PubMed
    1. Cruickshanks N., Zhang Y., Hine S., Gibert M., Yuan F., Oxford M., Grello C., Pahuski M., Dube C., Guessous F. Discovery and therapeutic exploitation of mechanisms of resistance to MET inhibitors in glioblastoma. Clin. Cancer Res. 2019;25:663–673. - PMC - PubMed

LinkOut - more resources