. 2020 Nov 20;23(12):101838.
doi: 10.1016/j.isci.2020.101838. eCollection 2020 Dec 18.

Generation of a Single-Cell RNAseq Atlas of Murine Salivary Gland Development

Affiliations

Generation of a Single-Cell RNAseq Atlas of Murine Salivary Gland Development

Belinda R Hauser et al. iScience. .

Abstract

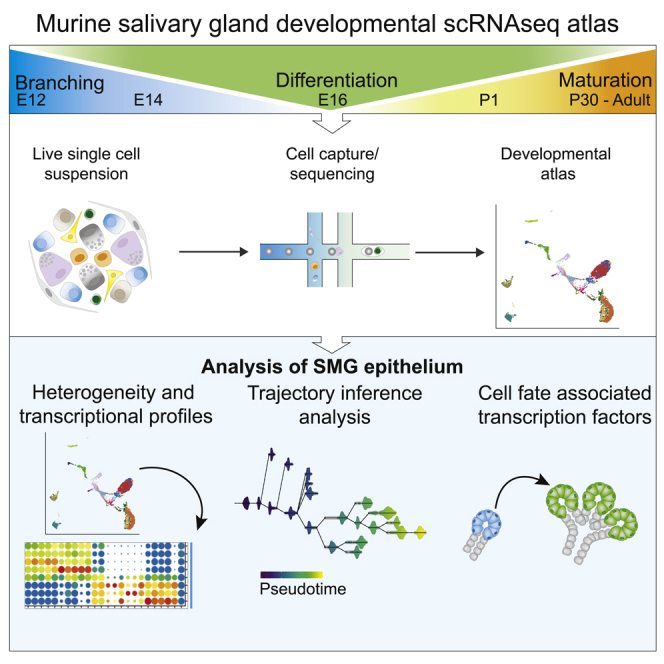
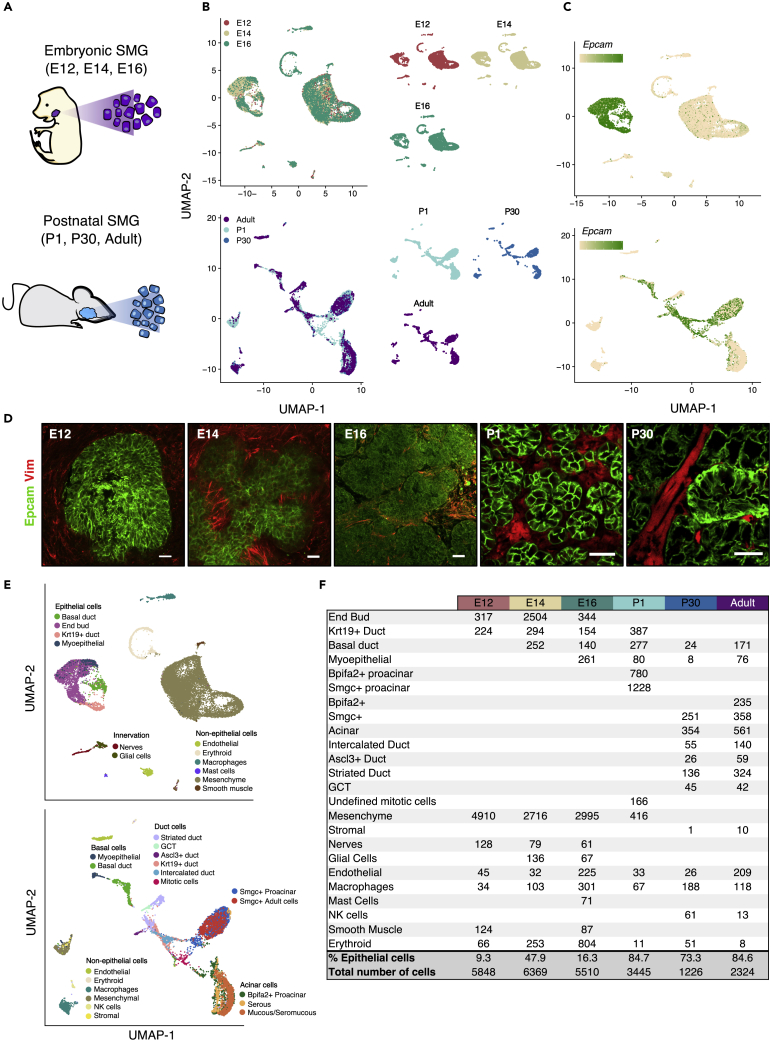
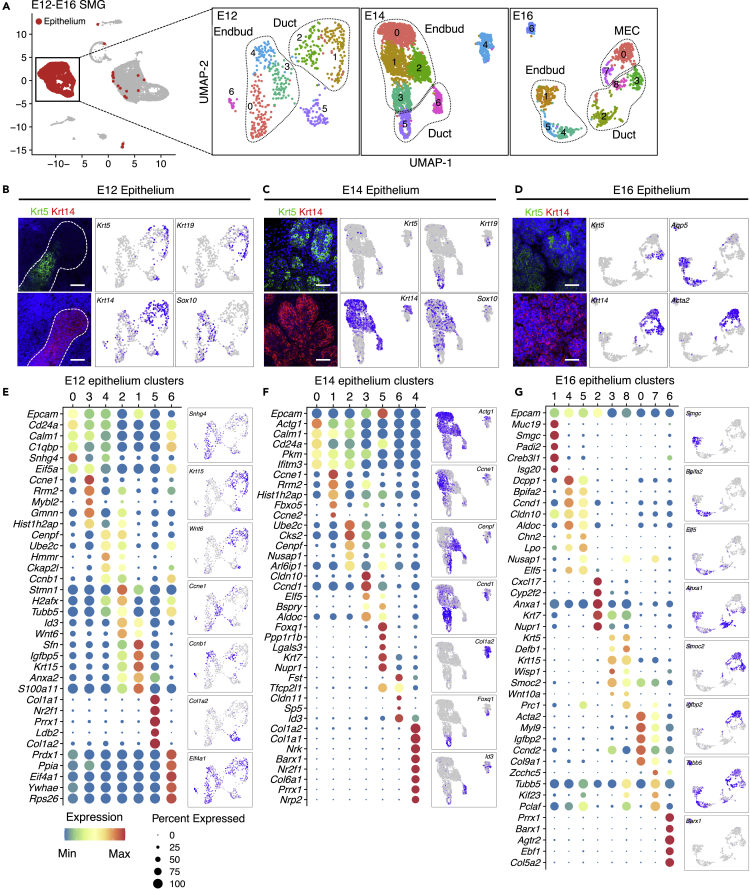
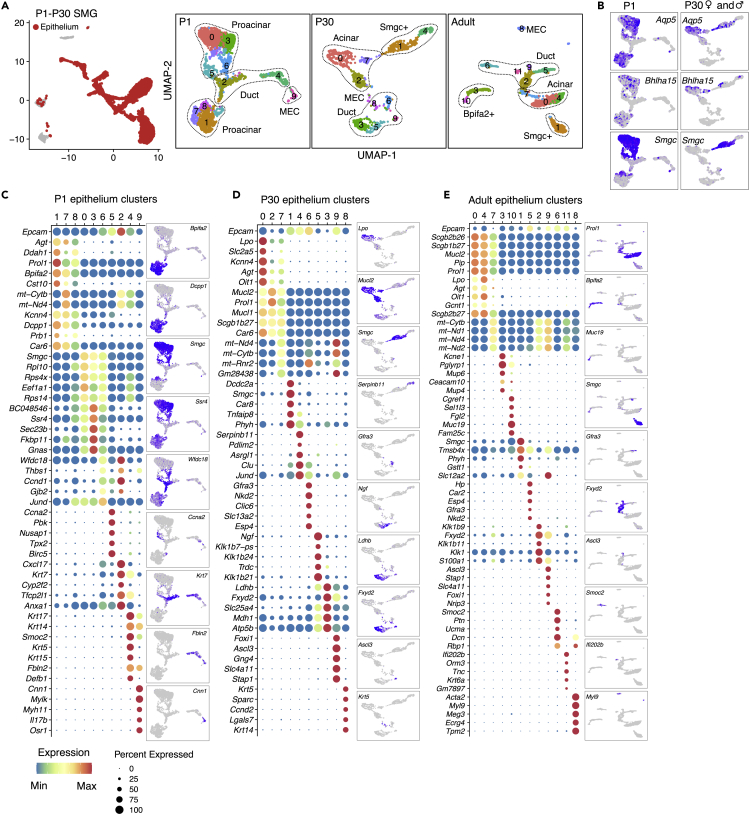
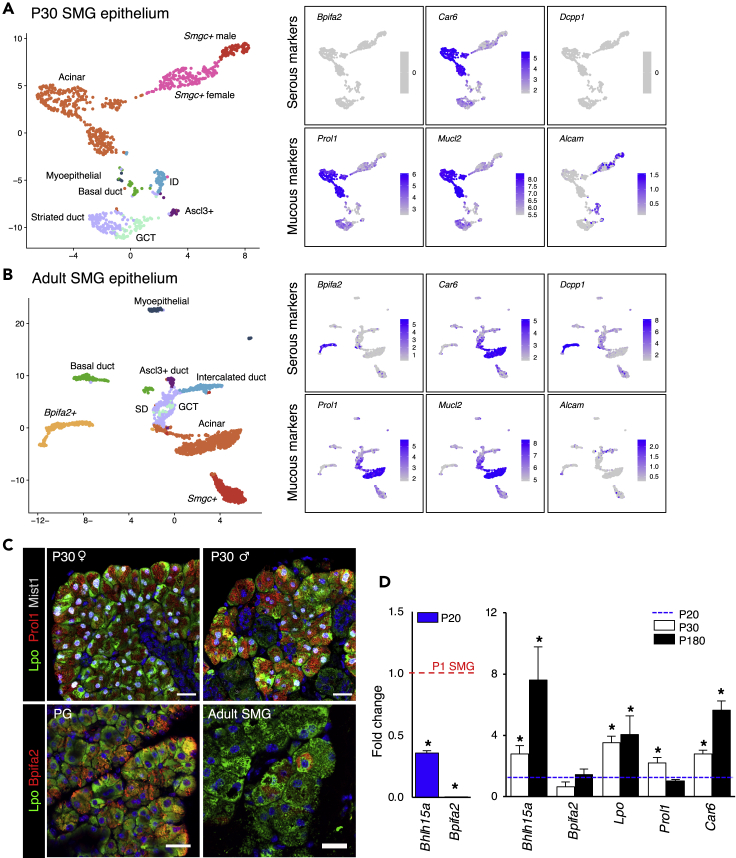
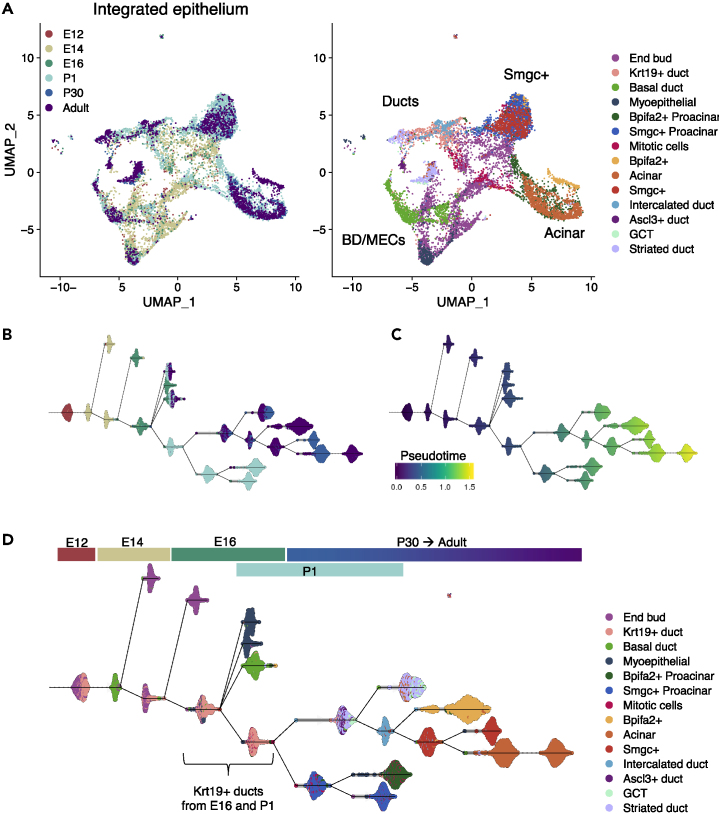
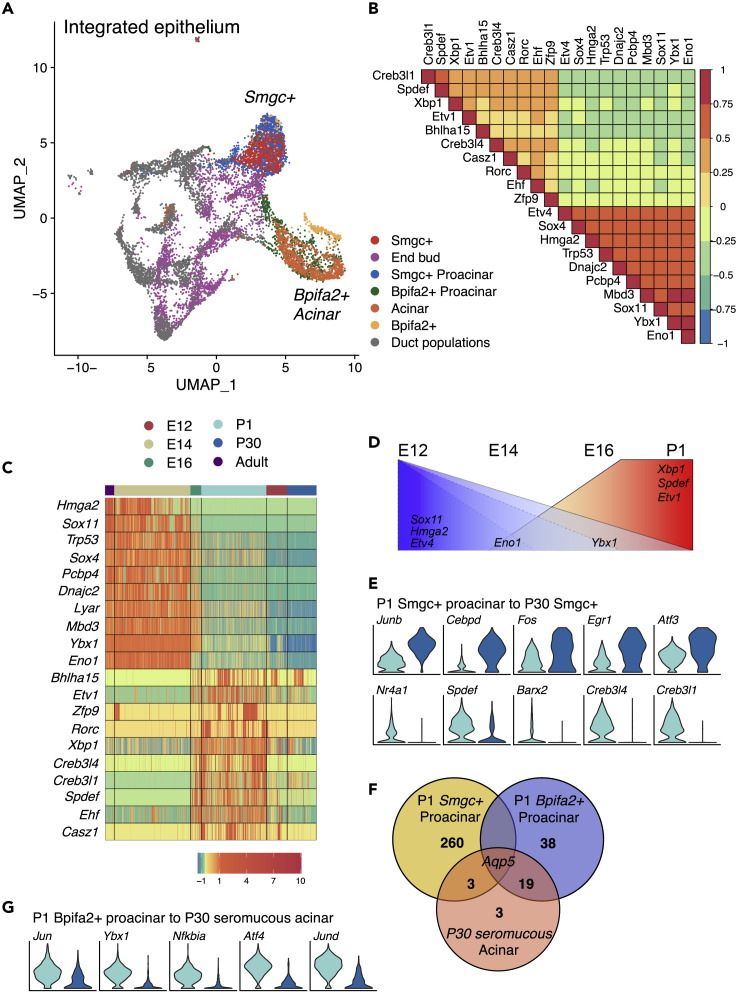
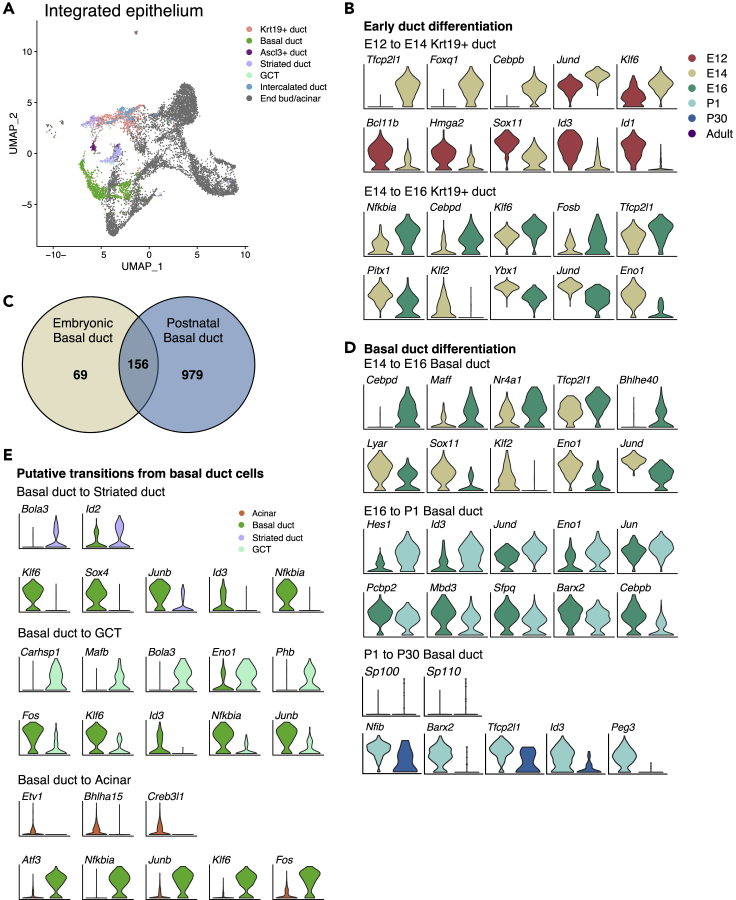
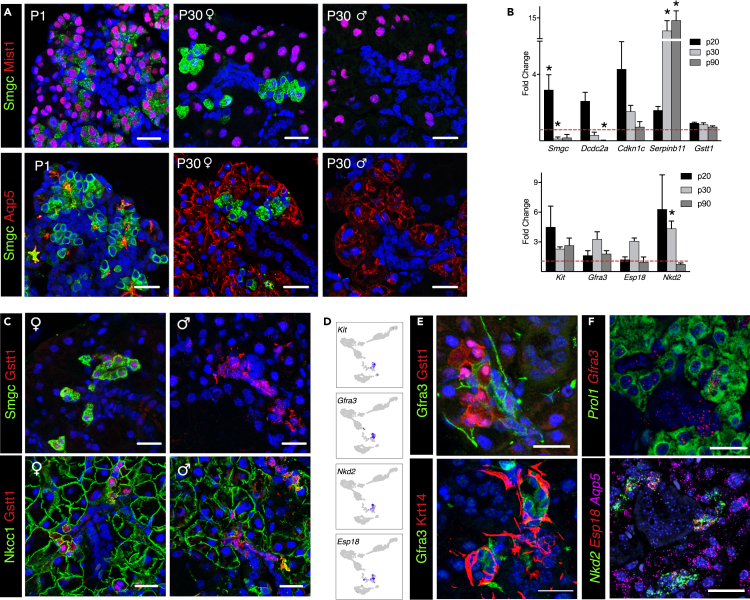
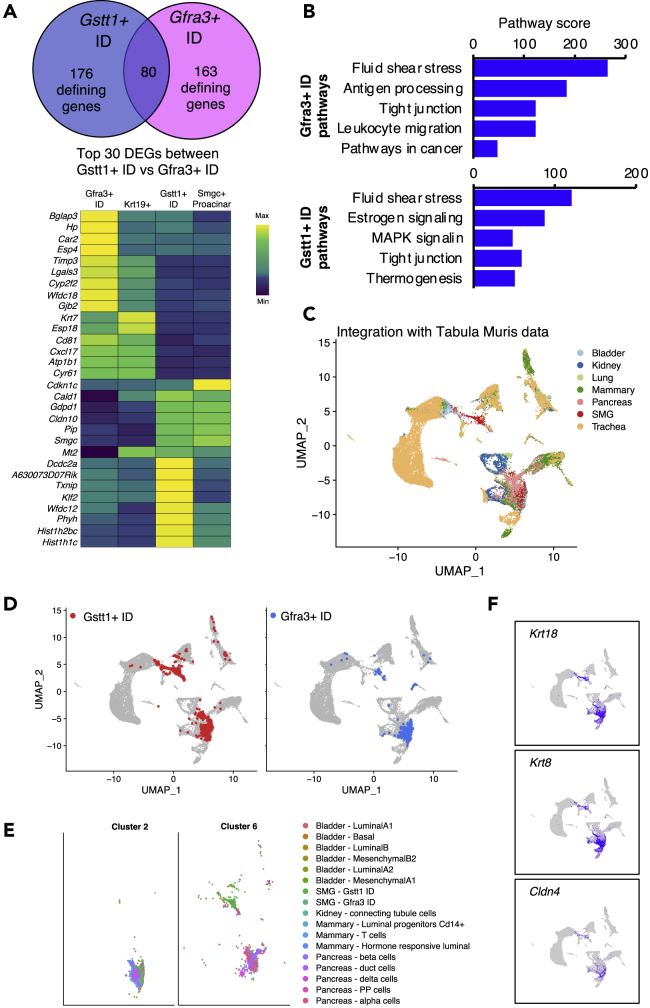
Understanding the dynamic transcriptional landscape throughout organ development will provide a template for regenerative therapies. Here, we generated a single-cell RNA sequencing atlas of murine submandibular glands identifying transcriptional profiles that revealed cellular heterogeneity during landmark developmental events: end bud formation, branching morphogenesis, cytodifferentiation, maturation, and homeostasis. Trajectory inference analysis suggests plasticity among acinar and duct populations. We identify transcription factors correlated with acinar differentiation including Spdef, Etv1, and Xbp1, and loss of Ybx1, Eno1, Sox11, and Atf4. Furthermore, we characterize two intercalated duct populations defined by either Gfra3 and Kit, or Gstt1. This atlas can be used to investigate specific cell functions and comparative studies predicting common mechanisms involved in development of branching organs.

Keywords: Biological Sciences; Developmental Biology; Systems Biology; Transcriptomics.


Conflict of interest statement

The authors declare no competing interests.

Figures

None
Graphical abstract
Figure 1
Figure 1
scRNAseq Analysis of Murine SMG Development (A and B) Single-cell suspensions from embryonic and postnatal SMG were used to build scRNAseq libraries. Data integration of embryonic and postnatal stages is shown in separate UMAPs colored by developmental stage. (C) UMAPs showing expression of Epcam. (D) Immunostaining of Epcam (green) and Vimentin (red). Scale bars, 20 μm. (E) Clusters were annotated based on expression of known markers. (F) Table showing cell numbers within each population from each stage.
Figure 2
Figure 2
SEURAT Analysis of Embryonic SMG Epithelium (A) From the embryonic integrated library, epithelial clusters from individual stages were separated and re-clustered with SEURAT. Individual UMAPs are shown, and labeled outlines indicate main cell types. (B–D) Representative images of Krt5 (green) and Krt14 (red) whole-mount staining of embryonic SMG and complimentary UMAPs. Additional UMAPs are shown for Sox10, Krt19, Aqp5, and Acta2. Scale bars, 50 μm. (E–G) Dot plots with scaled expression (color of the dot) and percentage of expression (size of the dot) of the top five genes for each cluster from Figure 2A. A representative gene from each group is shown in a UMAP.
Figure 3
Figure 3
SEURAT Analysis of Postnatal SMG Epithelium (A) From the postnatal integrated library, epithelial clusters from individual stages were separated and re-clustered with SEURAT. Individual UMAPs are shown, and labeled outlines indicate main cell types. (B) UMAPs of expression of Bhlha15, Aqp5, and Smgc in P1 and P30 SMG. (C–E) Dot plots with scaled expression (color of the dot) and percentage of expression (size of the dot) of the top five genes for each cluster from Figure 3A. A representative gene from each group is shown in a UMAP.
Figure 4
Figure 4
Expression of Serous and Mucous Genes in Acinar Cells (A and B) Epithelium from P30 and adult SMG colored and annotated by cell type with UMAPs showing expression of serous and mucous markers alongside. (C) Immunostaining of Lpo (green), Prol1 (red), and Mist1 (white) in P30 SMG (top panel) and Bpifa2 (Red) in adult PG and SMG (bottom panel). (D) Left qPCR graph shows decreased expression of Bhlha15 and Bpifa2 in P20 SMG normalized to P1 SMG. Graph on the right shows qPCR of selected serous and mucous genes in P30 and P180 female SMG normalized to P20. Data are represented as mean ± SEM and asterisks denote statistical significance (p < 0.05) compared with baseline (n = 3, two-tailed t test).
Figure 5
Figure 5
Trajectory Inference Analysis of SMG Epithelium (A) Integrated and re-clustered epithelial cells from all stages shown in UMAP. Left panel is colored by stage and right panel by cell type. (B and C) TI analysis using the PAGA-tree algorithm in Dynverse package. The determined pseudotemporal trajectory is colored by stage (B) and pseudotime score (C). (D) Distribution of specific cell types along the trajectory is indicated by color and labels.
Figure 6
Figure 6
Transcriptional Regulators of Acinar Differentiation (A) UMAP of integrated SMG epithelium highlighting end bud, proacinar, and acinar populations colored by cell type. (B) Analysis of TFs correlated with Bhlha15. Color scale represents correlation scores (p < 0.05). (C) Heatmap showing scaled expression of Bhlha15-correlated genes in end bud, proacinar, and acinar clusters. The colored bars represent developmental stages. (D) Schematic summarizing gene expression changes of selected genes throughout development. Blue area shows genes that decrease in expression, whereas red indicates genes that increase during acinar differentiation. (E) Violin plots of top differentially expressed TFs between P1 Smgc+ proacinar and P30 Smgc+ cells. Color scale consistent with Figure 6C. (F) Venn diagram of the comparison between defining genes for P1 proacinar populations and seromucous acinar cells at P30. (G) Violin plots of top differentially expressed TFs between P1 Bpifa2+ proacinar and P30 seromucous acinar cells. Color scale consistent with Figure 6C.
Figure 7
Figure 7
Transcriptional Regulators of Duct Differentiation (A) UMAP of integrated SMG epithelium highlighting duct populations colored by cell type. (B and D) Differential expression analysis between pairs of clusters from contiguous developmental stages as indicated by the color scheme and cell type labels. Top differentially expressed TFs (p < 0.05) are shown. TFs are sorted by fold change. (C) Venn diagram of the comparison between defining genes for basal duct in embryonic versus postnatal stages. (E) Differential expression analysis from BD to SD, GCTs, and acinar cells. Top differentially expressed TFs (p < 0.05) are shown.
Figure 8
Figure 8
Subpopulations of SMG ID Are Defined by Expression of Smgc, Gstt1, and Gfra3 (A) Immunofluorescence staining showing localization of Smgc (green) in P1 and P30 SMG. Proacinar and acinar cells are labeled with Mist1 and Aqp5 (red). (B) qPCR for genes enriched in Smgc+ (top panel) and Kit+ ID cells (bottom panel). Data are normalized to Rsp29 and age-matched female SMG (dotted line). Data are represented as mean ± SEM, and asterisks show statistical significance (p < 0.05) compared with age-matched female controls (n = 3; two-tailed t test). (C) Immunofluorescence staining showing expression of Gstt1 (red) in Smgc+ cells (green, top panel) and Nkcc1+ cells (green, lower panel) in P30 SMG from male and female mice. (D) UMAPs showing selected DEGs in Kit+ ID cells in P30 glands. (E) Immunofluorescence shows distinct ID populations with no overlap between Gfra3, Gstt1, and Krt14 protein. (F) In situ hybridization showing expression and localization of Gfra3, Prol1, Nkd2, Aqp5, and Esp18 mRNA in P30 SMG. Scale bars, 20 μm.
Figure 9
Figure 9
Subpopulations of SMG ID Are Defined by Expression of Smgc, Gstt1, and Gfra3 (A) Venn diagram of the comparison between defining genes for Gstt1+ and Gfra3+ ID cells. Top 15 defining genes for each population are shown in the heatmap. (B) Pathway analysis of defining genes from ID populations. (C–E) UMAP of SMG ID cells integrated with selected populations from the Tabula Muris colored by tissue of origin and cell type as indicated in the legend. (F) UMAP showing expression of Krt18, Krt8, and Cldn4.

References

    1. Angelidis I., Simon L.M., Fernandez I.E., Strunz M., Mayr C.H., Greiffo F.R., Tsitsiridis G., Ansari M., Graf E., Strom T.M. An atlas of the aging lung mapped by single cell transcriptomics and deep tissue proteomics. Nat. Commun. 2019;10:963. - PMC - PubMed
    1. Athwal H.K., Murphy G., 3rd, Tibbs E., Cornett A., Hill E., Yeoh K., Berenstein E., Hoffman M.P., Lombaert I.M.A. Sox10 regulates plasticity of epithelial progenitors toward secretory units of exocrine glands. Stem Cell Reports. 2019;12:366–380. - PMC - PubMed
    1. Aure M.H., Konieczny S.F., Ovitt C.E. Salivary gland homeostasis is maintained through acinar cell self-duplication. Dev. Cell. 2015;33:231–237. - PMC - PubMed
    1. Aure M.H., Symonds J.M., Mays J.W., Hoffman M.P. Epithelial cell lineage and signaling in murine salivary glands. J. Dent. Res. 2019;98:1186–1194. - PMC - PubMed
    1. Bach K., Pensa S., Grzelak M., Hadfield J., Adams D.J., Marioni J.C., Khaled W.T. Differentiation dynamics of mammary epithelial cells revealed by single-cell RNA sequencing. Nat. Commun. 2017;8:2128. - PMC - PubMed