. 2021 Jan 29;41(1):BSR20201026.
doi: 10.1042/BSR20201026.

Human-derived NLS enhance the gene transfer efficiency of chitosan

Affiliations

Human-derived NLS enhance the gene transfer efficiency of chitosan

Diogo B Bitoque et al. Biosci Rep. .

Abstract

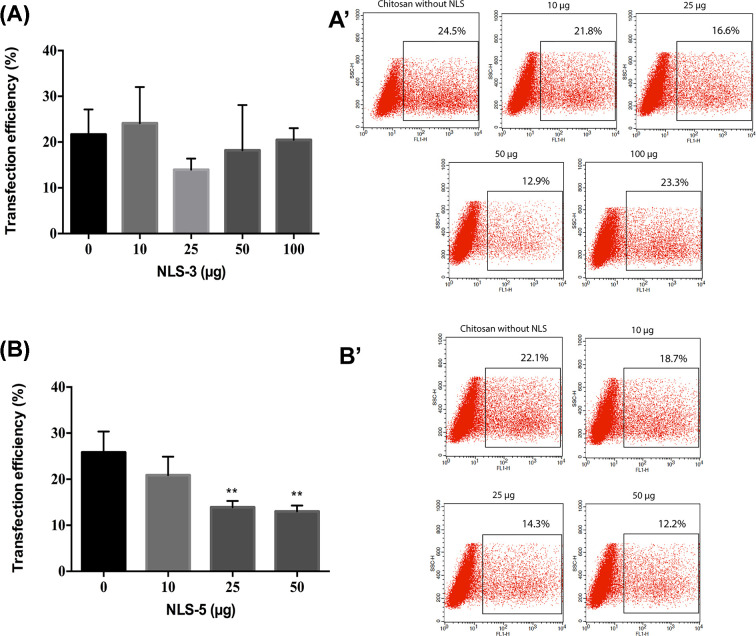
Nuclear import is considered as one of the major limitations for non-viral gene delivery systems and the incorporation of nuclear localization signals (NLS) that mediate nuclear intake can be used as a strategy to enhance internalization of exogenous DNA. In this work, human-derived endogenous NLS peptides based on insulin growth factor binding proteins (IGFBP), namely IGFBP-3 and IGFBP-5, were tested for their ability to improve nuclear translocation of genetic material by non-viral vectors. Several strategies were tested to determine their effect on chitosan mediated transfection efficiency: co-administration with polyplexes, co-complexation at the time of polyplex formation, and covalent ligation to chitosan. Our results show that co-complexation and covalent ligation of the NLS peptide derived from IGFBP-3 to chitosan polyplexes yields a 2-fold increase in transfection efficiency, which was not observed for NLS peptide derived from IGFBP-5. These results indicate that the integration of IGFBP-NLS-3 peptides into polyplexes has potential as a strategy to enhance the efficiency of non-viral vectors.

Keywords: HEK293T cells; IGFBP; chitosan; gene therapy; nuclear localization signals.


Conflict of interest statement

The authors declare that there are no competing interests associated with the manuscript.

Figures

Figure 1
Figure 1. Physical characterization of CS3 and CS5 polyplexes
Size (graph A) and zeta Potential (graph B) of CS3 and CS5 polyplexes. The white bar represents the CS polyplexes without NLS. The graphs are representative for S and T formulations, as no differences were found between these formulations. Polydispersity was similar for all samples (below 0.4). Statistical differences, compared to polyplexes without NLS peptides (0) were calculated using Dunnett's multiple comparisons test (N=3, error bars = SD; **P<0.01; *P<0.05).
Figure 2
Figure 2. Comparison of physical properties of CS3 (S and T) and CS5 (S and T) polyplexes
Size (graph A) and zeta Potential (graph B) of CS3 (S) and CS3 (T), and CS5 (S) and CS5 (T) co-complexation polyplexes, with 100 µg of NLS-3 and NLS-5 peptides, respectively. Polydispersity was similar for all samples (below 0.4). Statistical differences between polyplexes with the same NLS peptide were calculated using Sidak's multiple comparisons test. No differences were found between formulations. N=3, error bars refer to standard deviation.
Figure 3
Figure 3. Comparison of physical properties of CS0, CS3, CS5, 15:1-CS3, 15:1-CS5, CSedac3 and CSedac5
Size (graph A) and zeta potential (graph B) of polyplexes CS0, CS3, CS5, 15:1-CS3, 15:1-CS5, all with 100 µg of NLS (the graphs are representative for S and T co-complexation formulations) and covalently bond NLS formulations (CSedac3 and CSedac5).Polydispersity was below 0.4. Statistical differences of each condition compared to polyplexes without NLS peptides (CS0) were calculated using Dunnett’s multiple comparisons test; N=3, error bars = SD; **P<0.01; *P<0.05.
Figure 4
Figure 4. Cell viability evaluation of NLS peptides
Cell viability (%) after 24 and 72 h of incubation with different amounts of NLS-3 (graphs A,B) and NLS-5 (graphs C,D) peptides. Untreated cells were used as positive viability control (0 µg) and cells incubated with latex extracts as negative viability control (C-). Statistical differences, compared with positive control (0 µg), were calculated using Dunnett's multiple comparisons test (****P<0.0001; ***P<0.001; **P<0.01); N=3, error bars = SD.
Figure 5
Figure 5. Transfection efficiency after co-administration of polyplexes with NLS-3 and NLS-5
Transfection efficiency expressed as percentage of GFP-positive cells after co-administration of polyplexes (CS) with NLS-3 (graph A and dot plot A’) or NLS-5 (graph B and dot plot B’). Transfection was performed with 1 µg of DNA for all groups and analyzed 72 h after transfection; N=3, bars correspond to SD. Statistical significance was tested by one-way ANOVA with Dunnett’s post-test compared against polyplexes without NLS peptides (0 µg) (**P<0.01).
Figure 6
Figure 6. Transfection efficiency of CS3 and CS5 co-complexation polyplexes
Transfection efficiency expressed as percentage of GFP-positive cell for CS3 (S) (graph A and dot plot A’) and CS5 (S) (graph B and dot plot B’) co-complexation polyplexes. Transfection was performed with 1 µg of DNA for all groups and analyzed 72 h after transfection; N=3, bars correspond to SD. Statistical differences were calculated using Dunnett’s multiple comparisons test compared with polyplexes without NLS peptides (0 µg) (**P<0.01; *P<0.05).
Figure 7
Figure 7. Transfection efficiency of 15:1-CS3 and 15:1-CS5 co-complexation polyplexes
Transfection efficiency expressed as percentage of GFP-positive cells by 15:1-CS3 (S) and (T) (graph A and dot plot A’) and 15:1-CS5 (S) and (T) (graph B and dot plot B’) co-complexation polyplexes with 100 µg of NLS peptides. Transfection was performed with 1 µg of DNA for all groups and analyzed 72 h after transfection. N=3, bars correspond to SD. Statistical differences compared with CS polyplexes (condition 0 in both graphs) were calculated using Dunnett's multiple comparisons test (****P<0.0001).
Figure 8
Figure 8. Transfection efficiency of CSedac3 and CSedac5 polyplexes
Transfection efficiency represented by percentage of GFP-positive cells of CSedac3 (graph A and dot plot A’) and CSedac5 (graph B and dot plot B’) polyplexes covalently linked with 100 µg of NLS peptides. Transfection was performed with 1 µg of DNA for all groups and analyzed 72 h after transfection; N=3, bars correspond to SD. Statistical differences compared with CS polyplexes were calculated using an unpaired t test with Welch's correction (*P<0.05).

References

    1. Corsi K. et al. . (2003) Mesenchymal stem cells, MG63 and HEK293 transfection using chitosan-DNA nanoparticles. Biomaterials 24, 1255 10.1016/S0142-9612(02)00507-0 - DOI - PubMed
    1. Nayerossadat N. et al. . (2012) Viral and nonviral delivery systems for gene delivery. Adv. Biomed. Res. 1, 27 10.4103/2277-9175.98152 - DOI - PMC - PubMed
    1. Tiera M.J. et al. . (2006) Synthetic and natural polycations for gene therapy: state of the art and new perspectives. Curr. Gene Ther. 6, 59 10.2174/156652306775515510 - DOI - PubMed
    1. Yue Y.N. et al. . (2013) Progress and perspectives in developing polymeric vectors for in vitro gene delivery. Biomater. Sci. 1, 152 10.1039/C2BM00030J - DOI - PubMed
    1. Moore N.A. et al. . (2018) Gene therapy for inherited retinal and optic nerve degenerations. Expert Opin. Biol. Ther. 18, 37 10.1080/14712598.2018.1389886 - DOI - PubMed

Publication types

MeSH terms

Substances

LinkOut - more resources