. 2020 Dec;19(24):3508-3520.
doi: 10.1080/15384101.2020.1850968. Epub 2020 Dec 11.

P53 induces senescence in the unstable progeny of aneuploid cells

Affiliations

P53 induces senescence in the unstable progeny of aneuploid cells

Maybelline Giam et al. Cell Cycle. 2020 Dec.

Abstract

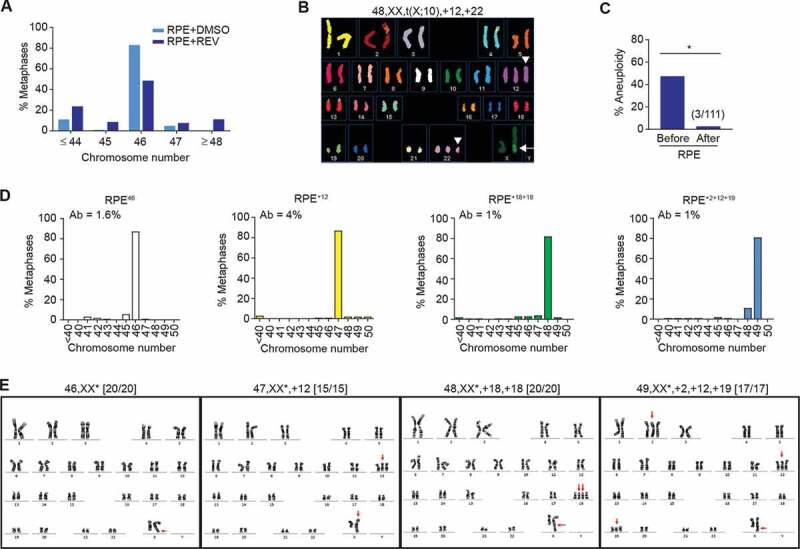
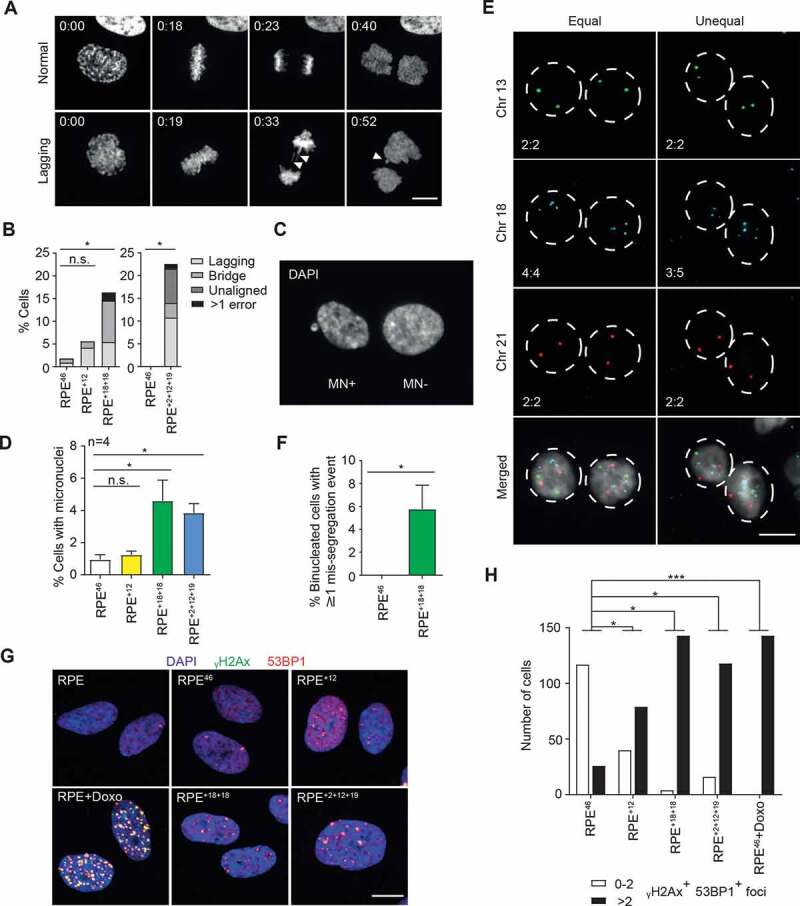
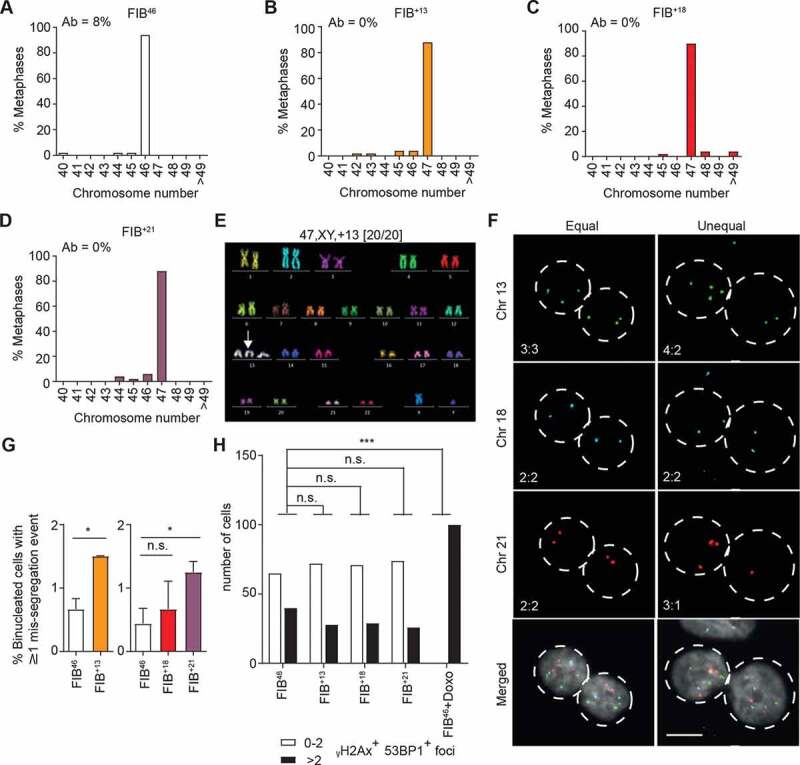
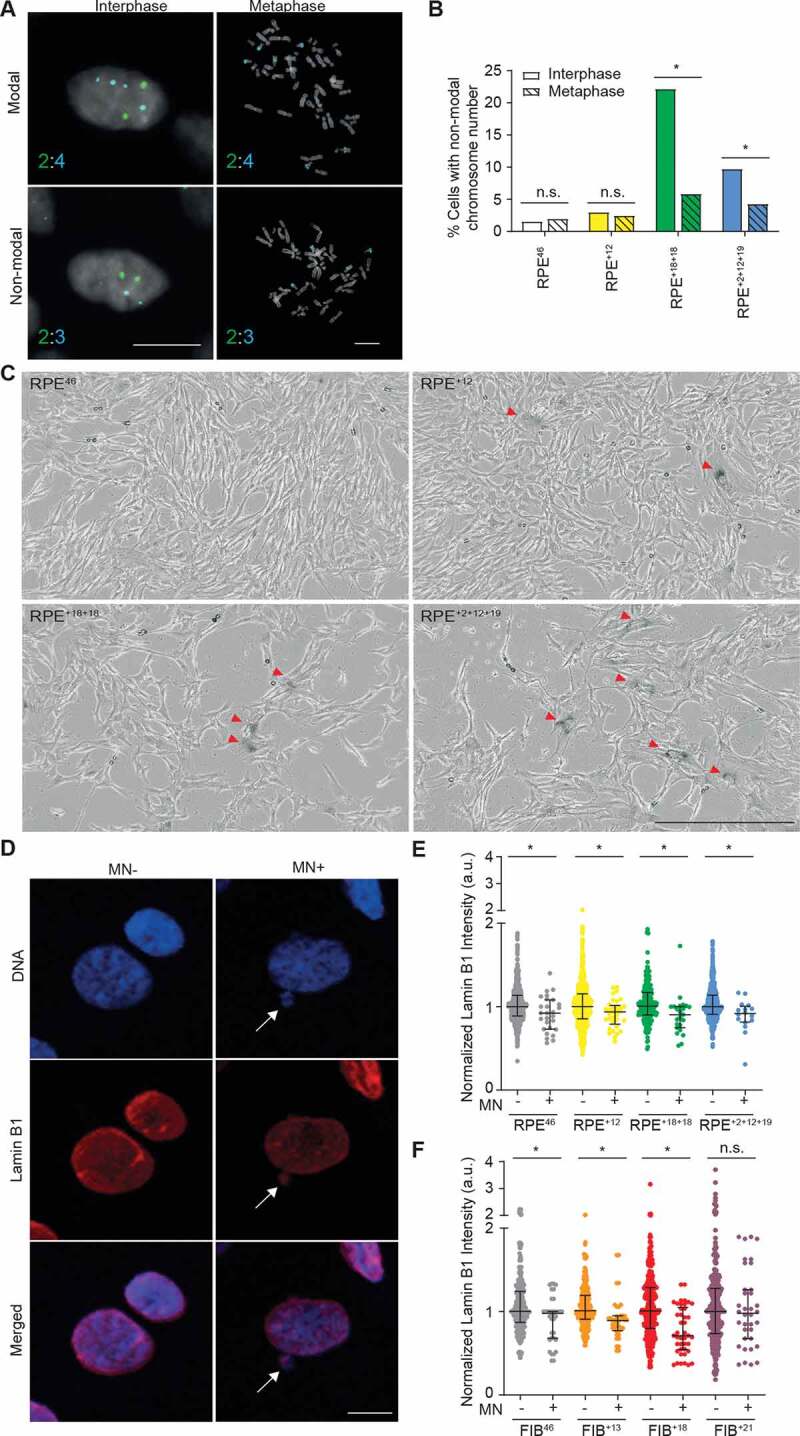
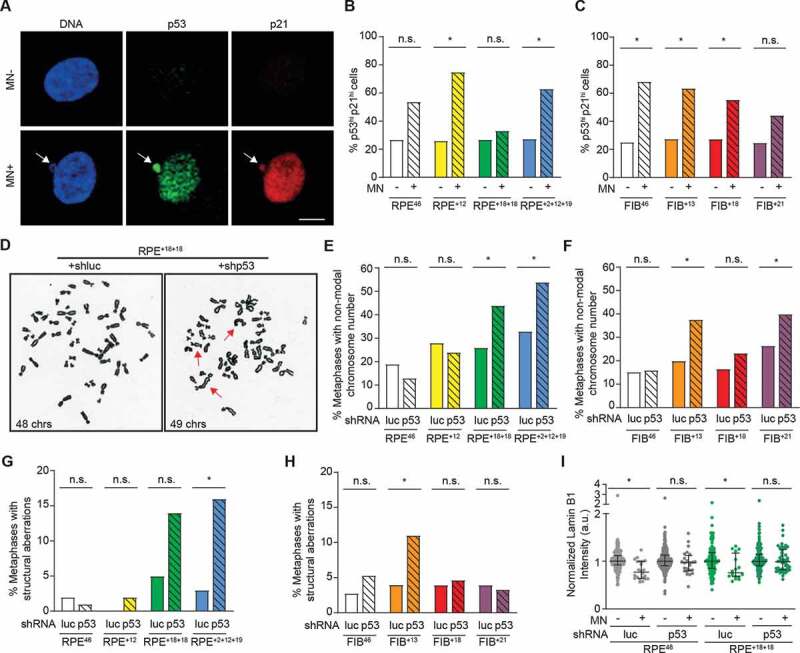
Aneuploidy is the condition of having an imbalanced karyotype, which is associated with tumor initiation, evolution, and acquisition of drug-resistant features, possibly by generating heterogeneous populations of cells with distinct genotypes and phenotypes. Multicellular eukaryotes have therefore evolved a range of extrinsic and cell-autonomous mechanisms for restraining proliferation of aneuploid cells, including activation of the tumor suppressor protein p53. However, accumulating evidence indicates that a subset of aneuploid cells can escape p53-mediated growth restriction and continue proliferating in vitro. Here we show that such aneuploid cell lines display a robust modal karyotype and low frequency of chromosomal aberrations despite ongoing chromosome instability. Indeed, while these aneuploid cells are able to survive for extended periods in vitro, their chromosomally unstable progeny remain subject to p53-induced senescence and growth restriction, leading to subsequent elimination from the aneuploid pool. This mechanism helps maintain low levels of heterogeneity in aneuploid populations and may prevent detrimental evolutionary processes such as cancer progression and development of drug resistance.

Keywords: P53; aneuploidy; genome instability; senescence.


Conflict of interest statement

The authors declare no competing financial interests.

Figures

Figure 1.
Figure 1.
Aneuploid cells can survive in vitro. A Chromosome counts from metaphase spreads of RPE cells 20 h after treatment with reversine (REV) or DMSO vehicle-only control (n = 50; shown is the average of two independent replicates). B Representative spectral karyotype of an aneuploid RPE cell after reversine treatment. White arrow: t(X:10) present in the background (Fig EV1A-D). White arrowheads: chromosome gains after reversine treatment. C Percentage of aneuploid cells detected before and after single-cell clonal amplification; clones were classified aneuploid if their modal chromosome number calculated from 20 metaphase spreads ≠ 46 (*p < 0.05 by Fisher’s exact test). Polyploid cells with chromosome number >65 were seldom found. D,E Chromosome counts (d) and G-banding karyotypes (e) of a diploid (RPE46) and three aneuploid lines recovered after single-cell clonal amplification of reversine-treated RPE-1 cells. (D) Histograms represent the distribution of chromosome number per cell from metaphase spreads. Percentage of cells with structurally aberrant chromosomes (Ab) is shown top left; n = 50 metaphase spreads; shown is the average of two independent replicates. (E) Gained chromosomes and the t(X:10) translocation are indicated with red arrows; karyotypes (with derivative X chromosomes labeled with asterisks) are indicated at the top of the panels; karyotypic frequency is indicated in the brackets
Figure 2.
Figure 2.
Aneuploid RPE cell lines display ongoing genome instability despite a stable modal karyotype. A Time-lapse microscopy montage of H2B-mCherry RPE+18+18 cells undergoing mitosis. Top: normal mitosis; bottom: aberrant mitosis (presence of lagging chromosomes and micronuclei, white arrowheads). Time frames are indicated as hr:min after Nuclear Envelope Breakdown (NEB, t = 0). Representative movies are also available as supplementary (Movie EV1). B Quantification of mitotic errors in the indicated H2B-mCherry RPE clones from the time-lapse movies. RPE+2+12+19 and another set of control cells were analyzed on IX83 Olympus (n = 86–167; *p < 0.05 by Fisher’s exact test). C,D Representative image of cells containing (MN+) or lacking (MN-) micronuclei (c) and percentage of cells containing at least one micronucleus in the indicated lines (d). Shown are the average and SEM of four independent experiments (n ≥ 1000; *p < 0.05 by Student’s t test). E Representative images of chromosome-specific FISH hybridization in RPE+18+18 cell line after DCB-induced cytokinesis failure. Equal or unequal segregation: left and right columns, respectively. Chromosome numbers in the two daughter nuclei are shown bottom left. F Quantification of cells displaying at least one mis-segregation event as identified in (e). Data are presented as mean ± S.E.M. of three independent experiments (n = 500; *p < 0.05 by Student’s t-test). G Representative images of immunolabeling with γH2Ax and 53BP1 in the indicated cell lines and conditions (Doxo = doxorubicin 400 nM, 4 h); γH2Ax, 53BP1 and DAPI signals are overlaid. H Quantification of γH2Ax and 53BP1 positive foci in the indicated lines and conditions (n > 100 cells). The experiment was repeated twice with qualitatively similar results (*p < 0.05 and ***p < 0.001 by Fisher’s exact test)
Figure 3.
Figure 3.
Primary aneuploid fibroblast cell lines are chromosomally unstable but maintain a stable karyotype. A-D Chromosome counting from metaphase spreads of the indicated euploid and aneuploid primary fibroblasts (n = 50); percentages of cells with structurally aberrant chromosomes (Ab) are shown top left. E Representative pseudo-colored image from M-FISH hybridization karyotyping of a FIB+13 cell. Karyotype is indicated on top with the number of cells analyzed in brackets. White arrow: trisomic chromosome. F Representative images of chromosome-specific FISH hybridization in FIB+13 cells after DCB-induced cytokinesis failure. Equal or unequal segregation: left and right column, respectively. Chromosome numbers in the two daughter nuclei are shown bottom left (scale bar: 10 µm). G Percentage of cells displaying at least one mis-segregation event in the indicated cell lines. Data are presented as mean ± S.E.M. of three independent experiments (n ≥ 522); *p < 0.05 by Student’s t-test. H Quantification of γH2Ax and 53BP1 positive foci in the indicated lines and conditions (Doxo = doxorubicin 400 nM, 4 h) after immunoblotting staining (n > 100 cells). The experiment was repeated twice with qualitatively similar results (***p < 0.001 by Fisher’s exact test)
Figure 4.
Figure 4.
Cell cycle arrest following chromosome mis-segregation. A Representative images of interphase or metaphase FISH using specific probes for chromosomes 13 (green, 2 copies) and 18 (aqua, 4 copies) in the RPE+18+18 cell line. Chromosome counts per cell are shown bottom left. Top and bottom row: cells displaying modal or non-modal distribution of chromosomes 13 and 18, respectively (scale bar: 10 µm). B Quantification of interphase (solid) or metaphase (pattern) cells with non-modal distribution of chromosomes 13 and 18 in the indicated cell lines. A total of 300–450 interphase and 85–200 metaphase cells were scored (*p < 0.05 by Fisher’s exact test). C Representative images of β-galactosidase assay performed on the indicated cell lines (scale bar: 400 µm). Red arrowhead indicate senescence cells. D Representative images of Lamin B1 immunofluorescence in RPE+18+18 cells with (MN+) or without (MN-) micronuclei (indicated by the white arrow). DNA was stained with DAPI (scale bar: 10 µm). E,F Quantification of normalized Lamin B1 intensity in MN- and MN+ cells from the indicated cell lines. A total of 16–42 MN+ and 235–756 MN- cells were quantified and two biological replicates were performed with qualitatively similar results. Error bars represent the median and interquartile ranges (*p < 0.05 by Mann-Whitney test)
Figure 5.
Figure 5.
P53 restrains the growth of chromosomally unstable daughter of aneuploid cells. A Representative images of p53 and p21 immunofluorescent staining in RPE+2+12+19 cells with (MN+) and without (MN-) micronuclei (white arrow). DNA was stained with DAPI (scale bar: 10 µm). B,C Quantification of MN- and MN+ cells with high p53 and p21 staining in the indicated cell lines (*p < 0.05 by Fisher’s exact test). Normalized p53 and p21 immunofluorescence levels per cell are reported in EV3. D Representative metaphase spreads of p53 knockdown (shp53) or control (shLuc) RPE+18+18 cells (red arrows: structural chromosome aberrations). E,F,G,H, Percentage of cells in the indicated lines carrying p53 knock down or control with (e-f) a chromosome number different from the modal karyotype (RPE46 and FIB46 = 46; RPE+12 and aneuploid fibroblasts = 47; RPE+18+18 = 48 and RPE+2+12+19 = 49) or with (g-h) structural chromosome aberrations (n = 50 metaphase spreads from two independent experiments; *p < 0.05 by Fisher’s exact test). I Normalized LaminB1 quantification in MN- and MN+ cells from p53 knockdown (shp53) or control (shLuc) RPEWT or RPE+18+18 lines (n = 16–46 MN+ cells; n = 124–364 MN- cells). Error bars represent the median and interquartile ranges (*p < 0.05 by Mann-Whitney test)

References

    1. Santaguida S, Amon A.. Short- and long-term effects of chromosome mis-segregation and aneuploidy. Nat Rev Mol Cell Biol. 2015;16:473–485. - PubMed
    1. Sansregret L, Swanton C. The role of aneuploidy in cancer evolution. Cold Spring Harb Perspect Med. 2017;7:a028373. - PMC - PubMed
    1. Pavelka N, Rancati G, Li R. Dr Jekyll and Mr Hyde: role of aneuploidy in cellular adaptation and cancer. Curr Opin Cell Biol. 2010;22:809–815. - PMC - PubMed
    1. Chen G, Rubinstein B, Li R. Whole chromosome aneuploidy: big mutations drive adaptation by phenotypic leap. BioEssays. 2012;34:893–900. - PMC - PubMed
    1. Targa A, Rancati G. Cancer: a CINful evolution. Curr Opin Cell Biol. 2018;52:136–144. - PubMed

Publication types

MeSH terms

Substances