. 2021 Jan 15;478(1):79-98.
doi: 10.1042/BCJ20200661.

Extracellular signal-regulated kinase (ERK) pathway control of CD8+ T cell differentiation

Affiliations

Extracellular signal-regulated kinase (ERK) pathway control of CD8+ T cell differentiation

Marcos P Damasio et al. Biochem J. .

Abstract

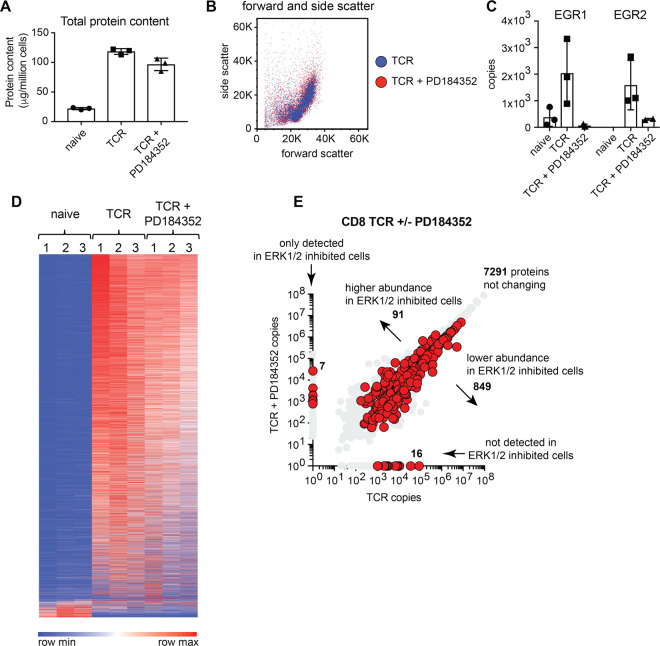
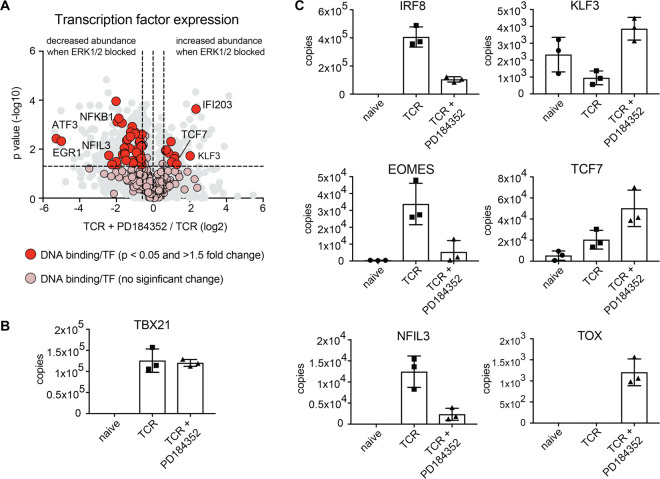
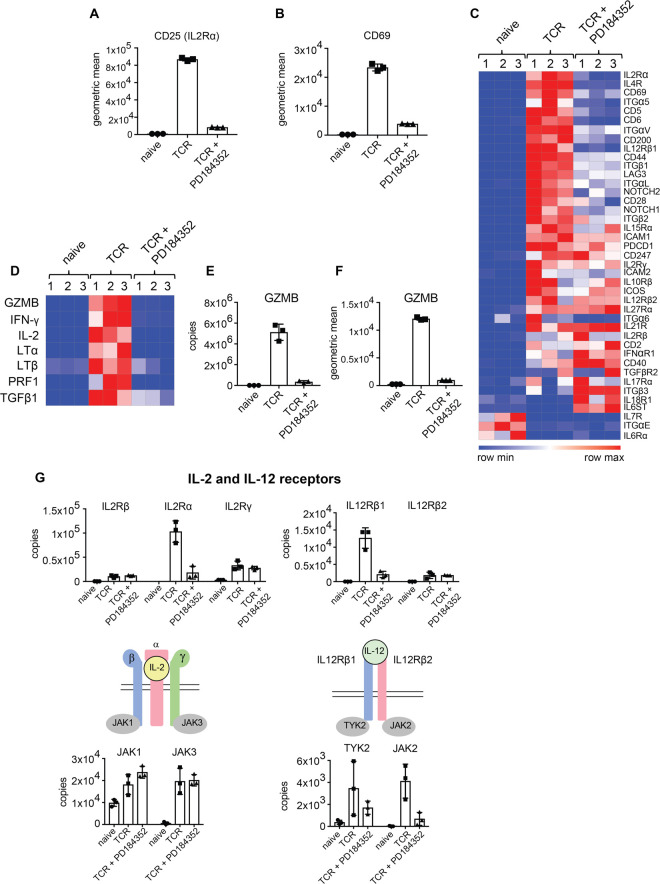
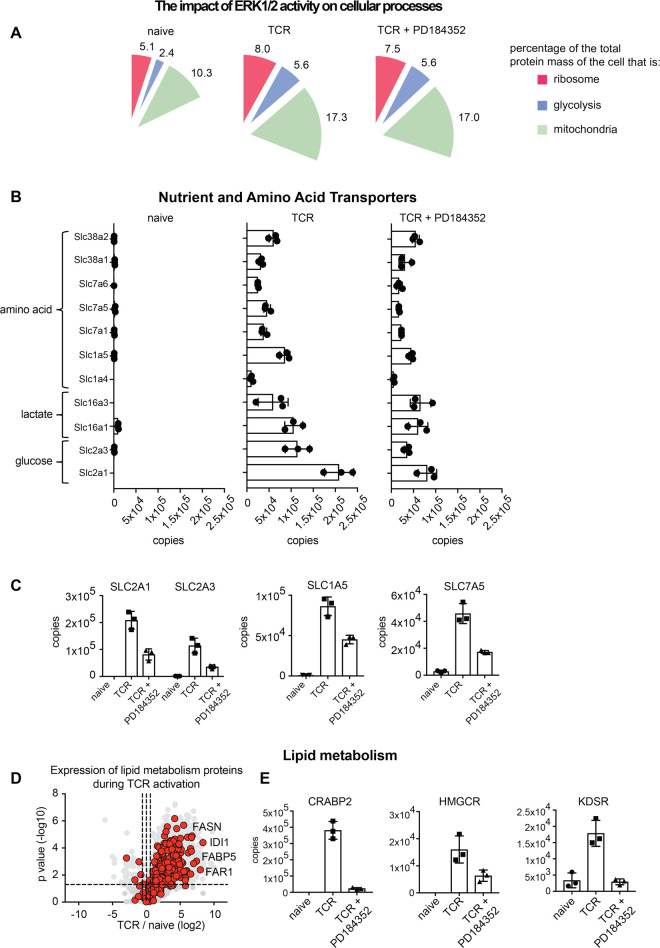
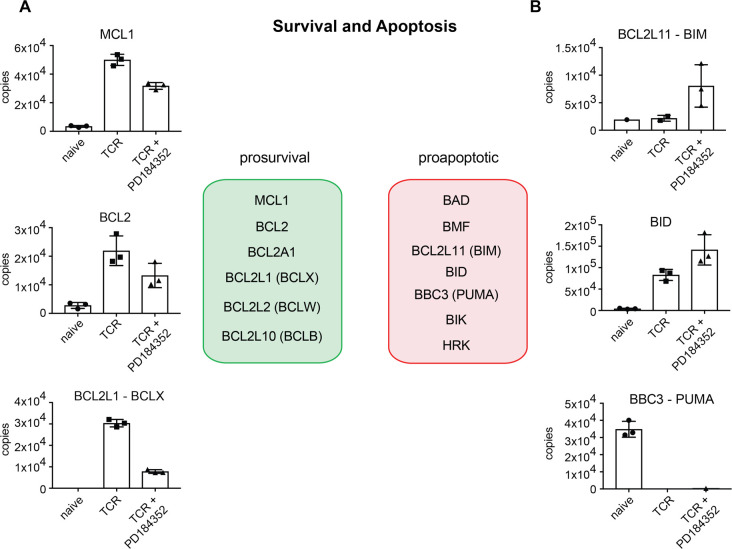
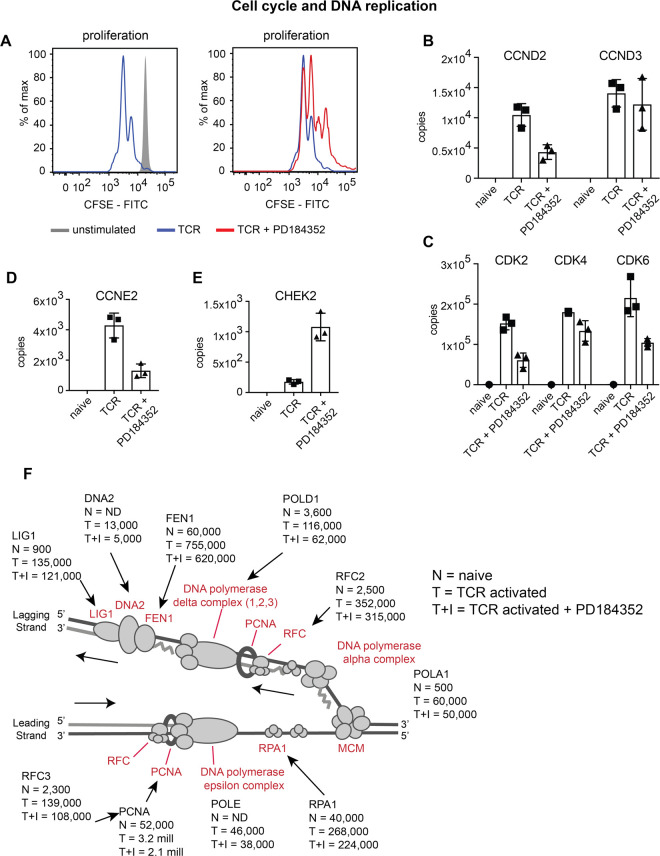
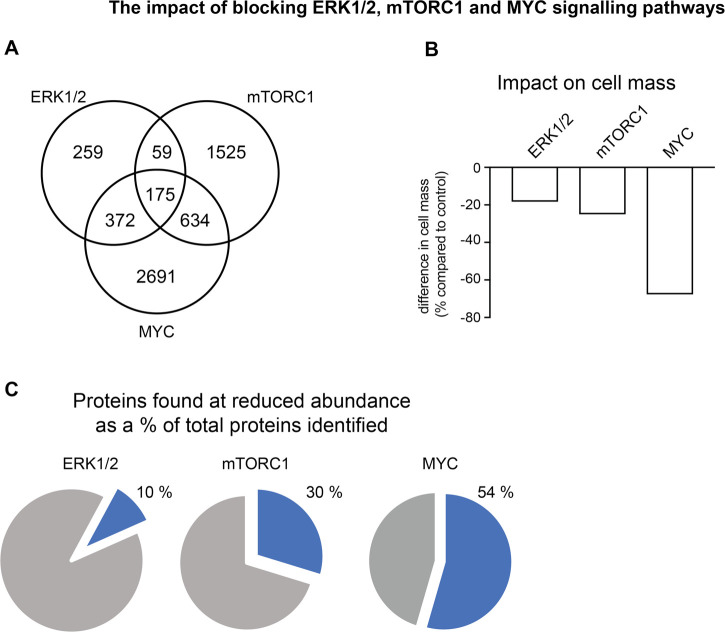
The integration of multiple signalling pathways that co-ordinate T cell metabolism and transcriptional reprogramming is required to drive T cell differentiation and proliferation. One key T cell signalling module is mediated by extracellular signal-regulated kinases (ERKs) which are activated in response to antigen receptor engagement. The activity of ERKs is often used to report antigen receptor occupancy but the full details of how ERKs control T cell activation is not understood. Accordingly, we have used mass spectrometry to explore how ERK signalling pathways control antigen receptor driven proteome restructuring in CD8+ T cells to gain insights about the biological processes controlled by ERKs in primary lymphocytes. Quantitative analysis of >8000 proteins identified 900 ERK regulated proteins in activated CD8+ T cells. The data identify both positive and negative regulatory roles for ERKs during T cell activation and reveal that ERK signalling primarily controls the repertoire of transcription factors, cytokines and cytokine receptors expressed by activated T cells. It was striking that a large proportion of the proteome restructuring that is driven by triggering of the T cell antigen receptor is not dependent on ERK activation. However, the selective targets of the ERK signalling module include the critical effector molecules and the cytokines that allow T cell communication with other immune cells to mediate adaptive immune responses.

Keywords: T-cells; extracellular signal-regulated kinases; proteomics.


Conflict of interest statement

The authors declare that there are no competing interests associated with the manuscript.

Figures

Figure 1.
Figure 1.. Selective proteome remodelling by ERK1/2.
High-resolution quantitative mass spectrometry was used to characterise the proteomes of naïve and 24 h antigen-activated CD8+ T cells +/− PD184352, a selective inhibitor of ERK1/2 activation. (a) Total protein content of T cell populations. (b) Forward/side scatter flow cytometry analysis of control and inhibitor-treated cells after 24 h of antigen activation. (c) Mean protein copy numbers per cell of the transcription factors early growth response 1 and 2 (EGR1 and EGR2). (d) Heat map of naïve and TCR activated CD8+ T cell proteomes +/− PD184352. Abundance is graded from low (blue) to high (red) for each individual protein. (e) Protein copy number comparison for control and inhibitor-treated cells. Proteins highlighted in red were significantly different between the two populations (P-value < 0.05, fold change <0.66 or >1.5, 2-tailed t-test with unequal variance) or were exclusively found in one population at >500 copies per cell and were not detected in the other population. For proteomics data, copy numbers are the mean of 3 biological replicates +/− standard deviation.
Figure 2.
Figure 2.. ERK1/2 activity is critical for the expression of key transcription factors during CD8+ T cell activation.
(a) The expression profile of over 300 proteins with the gene ontology term GO:0003700 (DNA binding transcription factor activity) was assessed in response to blocking ERK1/2 activity (TCR + PD184352). Proteins highlighted in red were annotated with the above GO term and were significantly different between the two populations (P-value < 0.05, fold change <0.66 or >1.5, 2-tailed t-test with unequal variance). Proteins highlighted in pink are transcription factors that did not significantly change in response to blocking ERK activity. Mean protein copy number per cell of (b) TBX21, T-Box Transcription Factor 21 (T-bet), (c) IRF8, IFN regulatory factor 8; EOMES, eomesodermin; NFIL3, Nuclear Factor Interleukin 3 Regulated; KLF3, Kruppel Like Factor 3; TCF7, Transcription factor 7; TOX, Thymocyte Selection-Associated High Mobility Group Box. Copy numbers are the mean of 3 biological replicates +/− standard deviation.
Figure 3.
Figure 3.. ERK1/2 activity controls the expression of effector molecules, cytokine receptors and their downstream signalling components.
(a,b) Flow cytometry analysis of (a) CD25 (IL2Rα) and (b) CD69, in naïve and TCR activated CD8+ T cells +/− PD184352. Data show the geometric mean for 3 biological replicates. (c) Expression profile of cell surface receptors in naïve and TCR activated CD8+ T cells +/− PD184352. The heat map shows the relative abundance of individual proteins graded from low (blue) to high (red). (d) Expression profile of effector molecules in naïve and antigen-activated CD8+ T cells +/− PD184352. GZMB, granzyme B; IFN-γ, interferon-gamma; IL-2, interleukin 2; LTα, lymphotoxin alpha; LTβ, lymphotoxin beta; PRF1, perforin 1; TGFβ1, Transforming Growth Factor Beta 1. (e) Mean protein copy numbers per cell of GZMB. (f) Flow cytometry analysis of GZMB in naïve and TCR activated CD8+ T cells +/− PD184352. The graph shows the geometric mean for 3 biological replicates. (g) The abundance of IL-2 and IL-12 receptor subunit components. The IL-2 receptor consists of three subunits: IL-2 receptor subunit alpha, beta and gamma (IL2Rα, IL2Rβ and IL2Rγ), while the IL-12 receptor consists of two subunits: IL-12 receptor subunit beta 1 and 2 (IL12Rβ1 and IL12Rβ2). JAK, Janus kinase. TYK2, Tyrosine Kinase 2. For proteomics data, copy numbers are the mean of 3 biological replicates +/− standard deviation.
Figure 4.
Figure 4.. The impact of ERK activity on metabolic processes.
(a) Percentage of the total cellular protein mass that represents ribosomal, glycolytic or mitochondrial proteins. (b,c) Expression profile of the major transporters for amino acids, lactate and glucose. (d) The impact of antigen activation on the expression of proteins linked to lipid metabolic processes (GO:0006629). Volcano plot shows the ratio for 24 h antigen-activated cells versus naïve cells. The horizontal dashed line indicates a P-value of 0.05 while the outer vertical dashed lines indicate a fold change of 0.66 and 1.5. IDI1, Isopentenyl-diphosphate Delta-isomerase 1; FAR1, Fatty acyl-CoA reductase 1; FABP5, Fatty acid-binding protein 5; FASN, Fatty acid synthase. (e) The mean copy number per cell for a selection of lipid metabolic proteins which were significantly impacted when ERK activity was blocked: CRABP2, Cellular Retinoic Acid-Binding Protein 2; HMGCR, 3-Hydroxy-3-Methylglutaryl-CoA Reductase; KDSR, 3-Ketodihydrosphingosine Reductase. Copy numbers are the mean of 3 biological replicates +/− standard deviation.
Figure 5.
Figure 5.. Blocking ERK activity directs cells towards an apoptotic profile.
The expression profile of key pro-survival (a) and pro-apoptotic (b) proteins was assessed in response to blocking ERK activity. MCL1, MCL1 apoptosis regulator BCL2 family member; BCL2, BCL2 apoptosis regulator; BCL2L1 (BCLX), BCL2 Like 1; BCL2L11 (BIM), BCL2 like 11; BID, BH3 Interacting Domain Death Agonist; BBC3 (PUMA), BCL2 Binding Component 3. Copy numbers are the mean of 3 biological replicates +/− standard deviation.
Figure 6.
Figure 6.. ERK activity has a selective impact on cell cycle and DNA replication machinery.
(a) Proliferation of CD8+ T cells was assessed after 48 h of antigen activation by flow cytometric analysis of CFSE label fluorescence. (b,c) The impact of ERK activity on key cell cycle proteins. CDK2, 4 and 6, cyclin-dependent kinase 2, 4 and 6; CCND2 and 3, cyclin D2 and cyclin D3. (d) The abundance of CCNE2, cyclin E2, and (e) CHEK2, checkpoint kinase 2. (f) Expression of components of the DNA replication fork complex in naïve (N), TCR activated (T) and TCR activated + inhibitor (T + I) cells. Copy numbers are the mean of 3 biological replicates +/− standard deviation.
Figure 7.
Figure 7.. Comparison of the impact of blocking ERK1/2, mTORC1 and MYC signalling pathways on CD8+ T cell proteomes.
(a) Overlap in the number of proteins that are found at the reduced abundance in response to blocking ERK1/2, mTORC1 or MYC signalling pathways. (b) The difference in total protein mass of TCR activated CD8+ T cells when ERK1/2, mTORC1 or MYC activity is blocked compared with control TCR activated cells. (c) The percentage of proteins identified that are found at a reduced abundance when ERK1/2, mTORC1 or MYC activity is blocked compared with control TCR activated cells. For (a) and (c), proteins were considered to significantly change in abundance with a P-value < 0.05 and a fold change <0.66 (2-tailed t-test with unequal variance) when compared with the control population, or were exclusively found in control cells at >500 copies per cell and were not detected in cells with either ERK1/2, mTORC1 or MYC pathways blocked.

Comment in

References

    1. Cantrell D. (2015) Signaling in lymphocyte activation. Cold Spring Harb. Perspect. Biol. 7, a018788 10.1101/cshperspect.a018788 - DOI - PMC - PubMed
    1. Navarro M.N. and Cantrell D.A. (2014) Serine-threonine kinases in TCR signaling. Nat. Immunol. 15, 808–814 10.1038/ni.2941 - DOI - PMC - PubMed
    1. Stefanová I., Hemmer B., Vergelli M., Martin R., Biddison W.E. and Germain R.N. (2003) TCR ligand discrimination is enforced by competing ERK positive and SHP-1 negative feedback pathways. Nat. Immunol. 4, 248–254 10.1038/ni895 - DOI - PubMed
    1. Altan-Bonnet G. and Germain R.N. (2005) Modeling T cell antigen discrimination based on feedback control of digital ERK responses. PLoS Biol. 3, e356 10.1371/journal.pbio.0030356 - DOI - PMC - PubMed
    1. Das J., Ho M., Zikherman J., Govern C., Yang M., Weiss A. et al. (2009) Digital signaling and hysteresis characterize ras activation in lymphoid cells. Cell 136, 337–351 10.1016/j.cell.2008.11.051 - DOI - PMC - PubMed

Publication types

MeSH terms

Substances