. 2020 Dec 11;18(12):e3001032.
doi: 10.1371/journal.pbio.3001032. eCollection 2020 Dec.

Distinct populations of crypt-associated fibroblasts act as signaling hubs to control colon homeostasis

Affiliations

Distinct populations of crypt-associated fibroblasts act as signaling hubs to control colon homeostasis

Michael David Brügger et al. PLoS Biol. .

Abstract

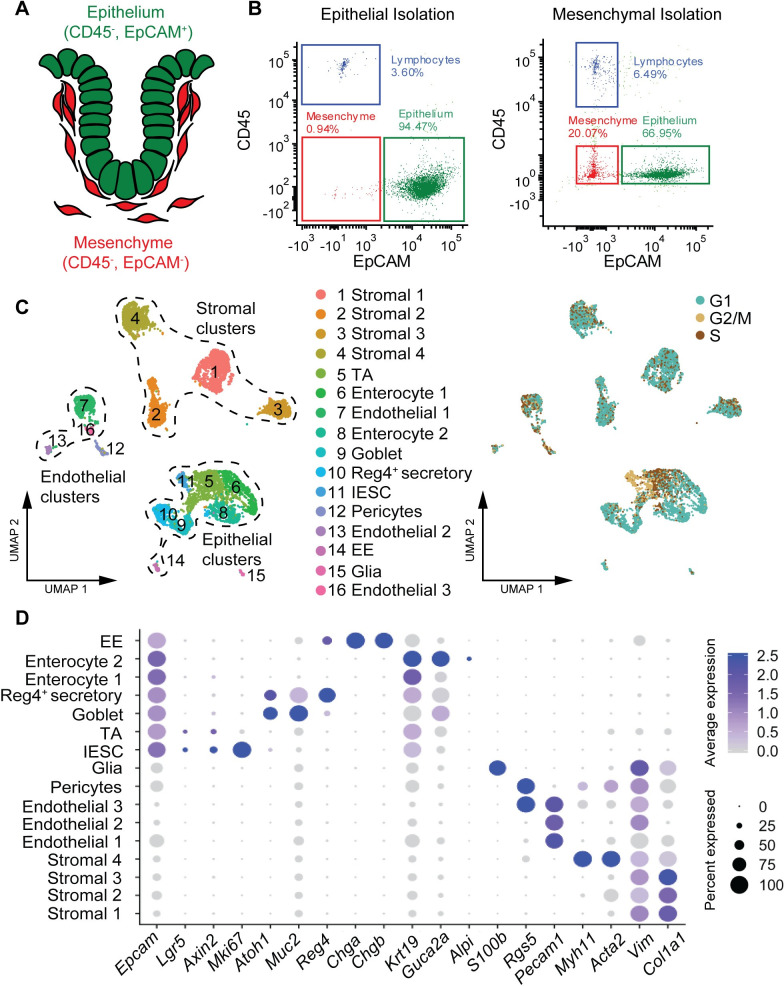
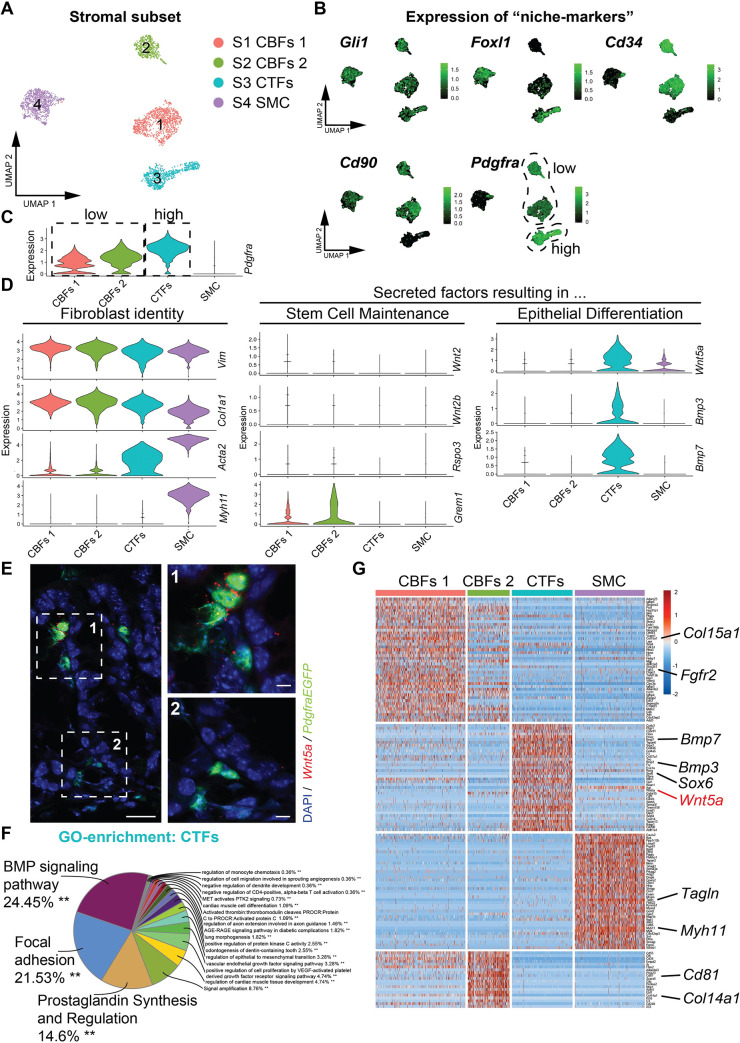
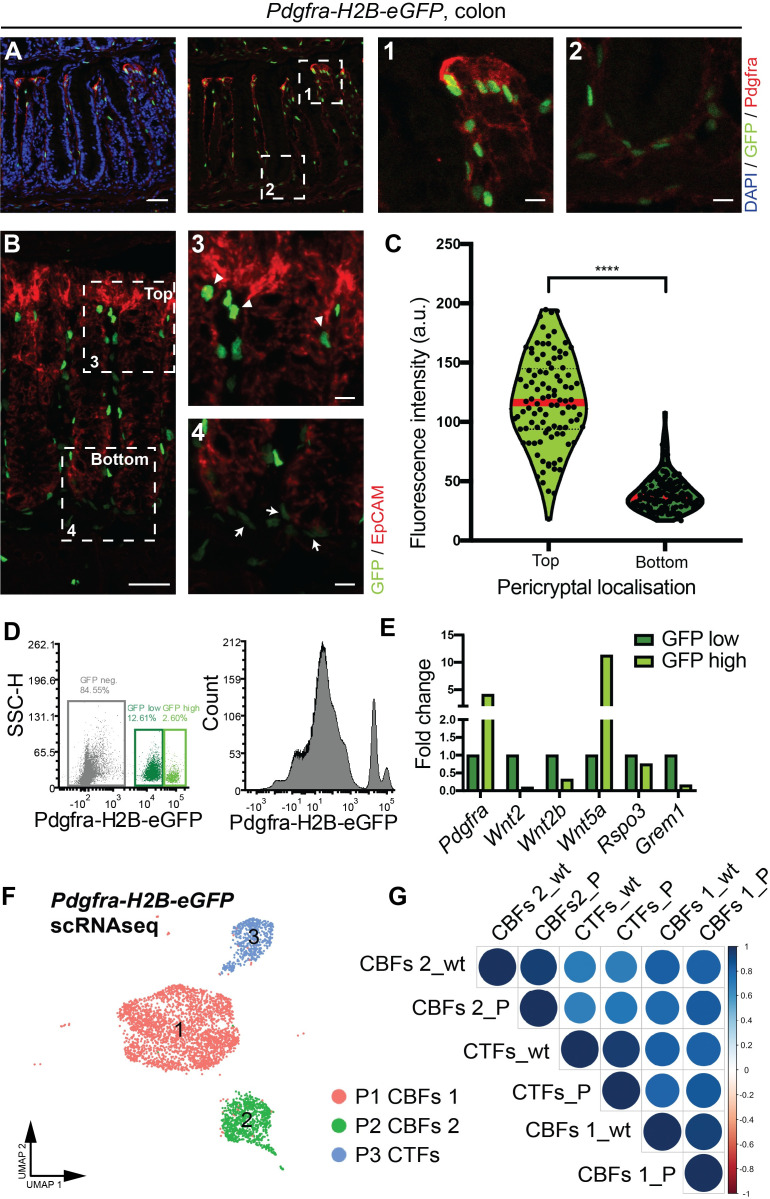
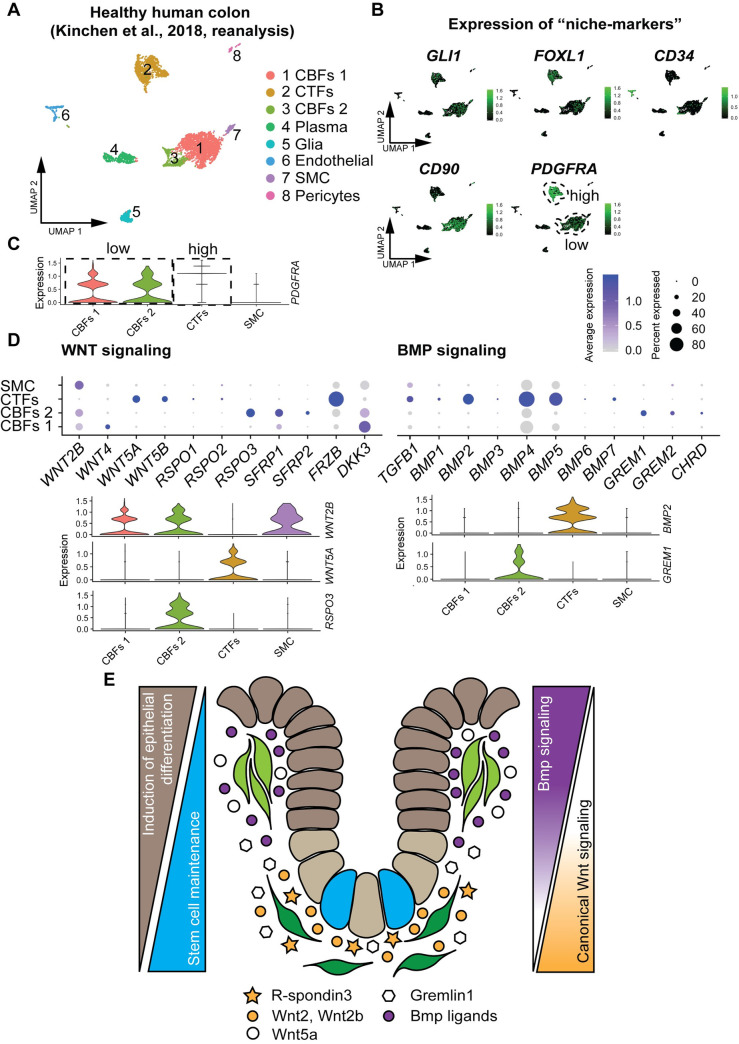
Despite recent progress in recognizing the importance of mesenchymal cells for the homeostasis of the intestinal system, the current picture of how these cells communicate with the associated epithelial layer remains unclear. To describe the relevant cell populations in an unbiased manner, we carried out a single-cell transcriptome analysis of the adult murine colon, producing a high-quality atlas of matched colonic epithelium and mesenchyme. We identify two crypt-associated colonic fibroblast populations that are demarcated by different strengths of platelet-derived growth factor receptor A (Pdgfra) expression. Crypt-bottom fibroblasts (CBFs), close to the intestinal stem cells, express low levels of Pdgfra and secrete canonical Wnt ligands, Wnt potentiators, and bone morphogenetic protein (Bmp) inhibitors. Crypt-top fibroblasts (CTFs) exhibit high Pdgfra levels and secrete noncanonical Wnts and Bmp ligands. While the Pdgfralow cells maintain intestinal stem cell proliferation, the Pdgfrahigh cells induce differentiation of the epithelial cells. Our findings enhance our understanding of the crosstalk between various colonic epithelial cells and their associated mesenchymal signaling hubs along the crypt axis-placing differential Pdgfra expression levels in the spotlight of intestinal fibroblast identity.


Conflict of interest statement

The authors have declared that no competing interests exist.

Figures

Fig 1
Fig 1. Unbiased analysis of murine colon landscape reveals complexity and heterogeneity of epithelial and mesenchymal cells.
(A) Schematic representation of a colonic crypt with surface markers used to sort epithelial (green: EpCAM+, CD45−) and mesenchymal/non-epithelial cells (red: EpCAM−, CD45−). (B) Flow cytometry analysis using EpCAM and CD45 on single-cell suspension of colonic epithelial (left, raw data: S2 Data) and mesenchymal cell isolation (right, raw data: S3 Data) prior to the sort. (C) Left: three major groups (epithelial, stromal, and endothelial) clustering into 16 distinct cluster revealed by UMAP analysis. Right: Epithelial cells show higher proliferative activity (cells in S-G2M) than non-epithelial cells (UMAP, single cells are colored according to their cluster annotation (left) or cell cycle phase (right)). (D) Characterization of cluster identity using relative expression of marker genes. (Dot plot, size, and color of the dot represent the percentage of cells which express the transcript and the average expression level within a cluster, respectively). EE, enteroendocrine; IESC, intestinal epithelial stem cell; TA, transit-amplifying cell; UMAP, Uniform Manifold Approximation and Projection.
Fig 2
Fig 2. CTFs (Pdgfrahigh) and CBFs (Pdgfralow) mark distinct functional colonic mesenchymal cell populations that control stem cell proliferation and epithelial differentiation in the murine colon.
(A) Heterogeneity of colonic mesenchymal cells (UMAP plot of the reanalyzed stromal subset, single cells are colored according to cluster annotation). (B) Relative expression of niche marker genes (UMAP, single cells are colored according to transcript expression). (C) Pdgfra expression across stromal clusters (violin plot, raw data: S1A Data). (D) Relative expression of fibroblast identity marker genes (Vim, Col1a1, Acta2, and Myh11), secreted factors resulting in stem cell maintenance (Wnt2, Wnt2b, Rspo3, and Grem1) and secreted factors resulting in epithelial differentiation (Wnt5a, Bmp3, and Bmp7) (violin plots, raw data: S1B Data). (E) Wnt5a is expressed by CTFs at the top of the colonic crypts (single-molecule RNA in situ hybridization (Scale bar = 20 μm, 5μm (1,2)). (F) GO enrichment terms for CTFs. (G) Heatmap of genes that are differentially expressed among the mesenchymal clusters (0.95 quantile) show strong similarities between CBFs1 and CBFs2 and clear distinction of CTFs and SMC. Bmp, bone morphogenetic protein; CBF, crypt-bottom fibroblast; CTF, crypt-top fibroblasts; GO, Gene Ontology; Pdgfra, platelet-derived growth factor receptor A; SMC, smooth muscle cell; UMAP, Uniform Manifold Approximation and Projection.
Fig 3
Fig 3. CTFs (Pdgfrahigh) and CBFs (Pdgfralow) are localized in a distinct manner along the colonic crypt axis.
(A–C) Cryosections of Pdgfra-H2B-eGFP mice. (A) High Pdgfra protein expression correlates with the level of Pdgfra transcript in Pdgfra-H2B-eGFP reporter mouse line. (Red: Pdgfra protein, green: GFP, blue: DAPI) (Scale bar = 40 μm), (1,2) Insets of crypt top and crypt bottom respectively (Scale bar = 5 μm). (B) CTFs (Pdgfrahigh) are localized at the top of the colonic crypt, whereas CBFs (Pdgfralow) are at the bottom. (Red: EpCAM, green: GFP, blue: DAPI) (Scale bar = 40 μm). (3,4) Insets of crypt top and crypt bottom, respectively, arrowheads point out Pdgfrahigh (GFP high) cells and arrows point out Pdgfralow (GFP low) cells. (Scale bar = 5 μm) (C) Fluorescence intensity measurement of GFP positive nuclei. nBottom = 159, nTop = 100, **** = p < 0.0001 (Unpaired t test with Welch correction) (Raw data: S1C Data) (D) Flow cytometry analysis for GFP on mesenchymal cells isolated from Pdgfra-H2B-eGFP mice identifying GFP, GFP-low, and GFP-high cells (Raw data: S4 Data). (E) Relative mRNA expression of Pdgfra, Wnt2, Wnt2b, Wnt5a, Rspo3, and Grem1 in CTFs (GFP high) and CBFs (GFP low) isolated from Pdgfra-H2B-eGFP reporter mouse line. (RT-qPCR, normalized to Hprt expression levels, FC levels in CBFs set to 1) (Raw data: S1D Data). (F) CBFs1, CBFs2, and CTFs populations determined by scRNAseq from colonic Pdgfra-positive cells (Pdgfra-H2B-eGFP reporter mouse line). (UMAP, single cells are colored according to cluster annotation). (G) Stromal clusters from wt and Pdgfra+ colonic scRNAseq analysis display high similarity. (Spearman correlation). CBF, crypt-bottom fibroblast; CTF, crypt-top fibroblasts; FC, fold change; GFP, green fluorescent protein; Pdgfra, platelet-derived growth factor receptor A; RT-qPCR, quantitative reverse transcription PCR; scRNAseq, single-cell RNA sequencing; UMAP, Uniform Manifold Approximation and Projection; wt, wild-type.
Fig 4
Fig 4. Murine CTFs and CBFs populations are conserved in healthy human colon.
(A) Reanalysis of the healthy colonic stromal dataset from GSE114374 reveals landscape similar to murine colon. (UMAP, single cells are colored according to cluster annotation). (B) Conserved niche markers determine analogous cell populations in human colonic mesenchyme (UMAP, single cells are colored according to transcript expression). (C) Relative expression of PDGFRA separates human mesenchymal cells into three PDGFRA+ populations: CTFs, CBFs 1, and CBFs 2. (Violin plot, raw data: S1E Data) (D) Relative expression of factors involved in WNT and BMP pathways. (Violin and dot plots, size, and color of the dot represent the percentage of cells which express the transcript and the average expression level within a cluster, respectively; raw data: S1F Data). (E) Schematic model of conserved colonic crypt-associated fibroblasts. PDGFRAhigh CTFs secrete BMP ligands and noncanonical WNT ligands, resulting in epithelial differentiation. PDGFRAlow CBFs secrete canonical WNT ligands, WNT potentiators, and BMP inhibitors to maintain stem cells (blue). BMP, bone morphogenetic protein; CBF, crypt-bottom fibroblast; CTF, crypt-top fibroblast; PDGFRA, platelet-derived growth factor receptor A; UMAP, Uniform Manifold Approximation and Projection.

References

    1. Powell DW, Pinchuk IV, Saada JI, Chen X, Mifflin RC. Mesenchymal Cells of the Intestinal Lamina Propria. Annu Rev Physiol. 2011;73:213–37. 10.1146/annurev.physiol.70.113006.100646 - DOI - PMC - PubMed
    1. Barker N. Adult intestinal stem cells: critical drivers of epithelial homeostasis and regeneration. Nat Rev Mol Cell Biol. 2014;15:19–33. 10.1038/nrm3721 - DOI - PubMed
    1. Gehart H, Clevers H. Tales from the crypt: new insights into intestinal stem cells. Nat Rev Gastroenterol Hepatol. 2019;16:19–34. 10.1038/s41575-018-0081-y - DOI - PubMed
    1. Greicius G, Kabiri Z, Sigmundsson K, Liang C, Bunte R, Singh MK, et al. PDGFRα+ pericryptal stromal cells are the critical source of Wnts and RSPO3 for murine intestinal stem cells in vivo. PNAS. 2018;115:E3173–81. 10.1073/pnas.1713510115 - DOI - PMC - PubMed
    1. Stzepourginski I, Nigro G, Jacob J-M, Dulauroy S, Sansonetti PJ, Eberl G, et al. CD34+ mesenchymal cells are a major component of the intestinal stem cells niche at homeostasis and after injury. PNAS. 2017;114:E506–13. 10.1073/pnas.1620059114 - DOI - PMC - PubMed

Publication types

MeSH terms

Substances