Review
. 2021 Jan 4;153(1):e202012722.
doi: 10.1085/jgp.202012722.

Structural basis of cytoplasmic NaV1.5 and NaV1.4 regulation

Affiliations
Review

Structural basis of cytoplasmic NaV1.5 and NaV1.4 regulation

Sara Nathan et al. J Gen Physiol. .

Abstract

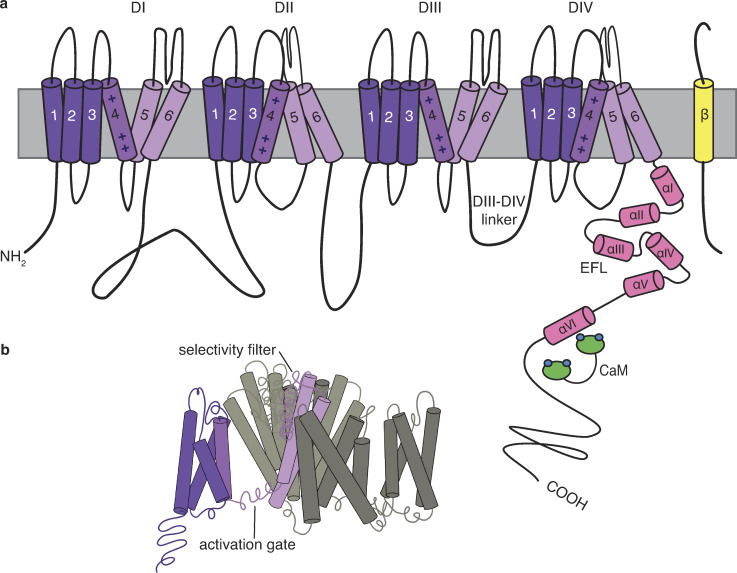
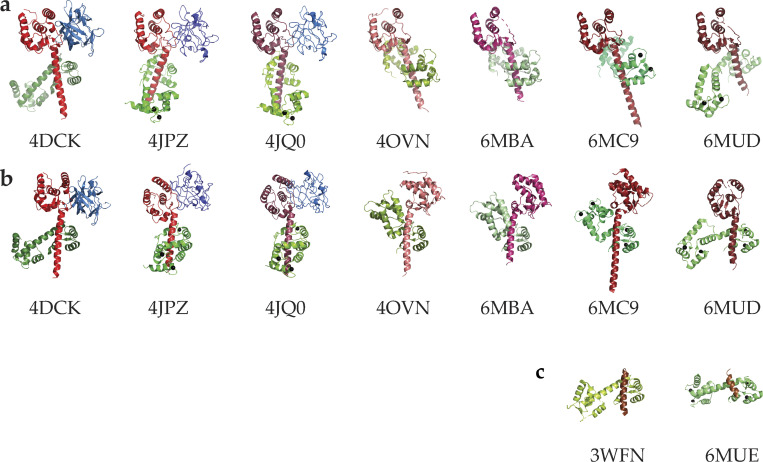
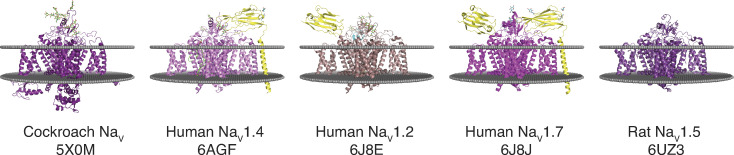
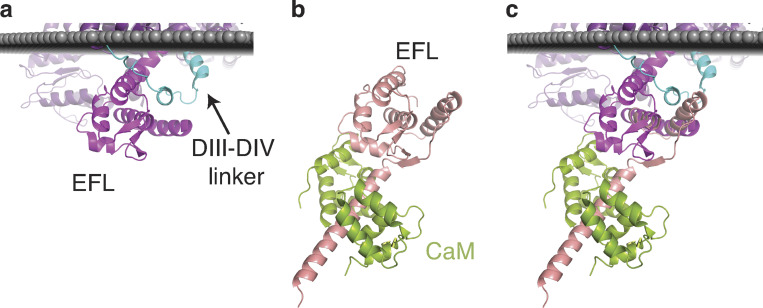
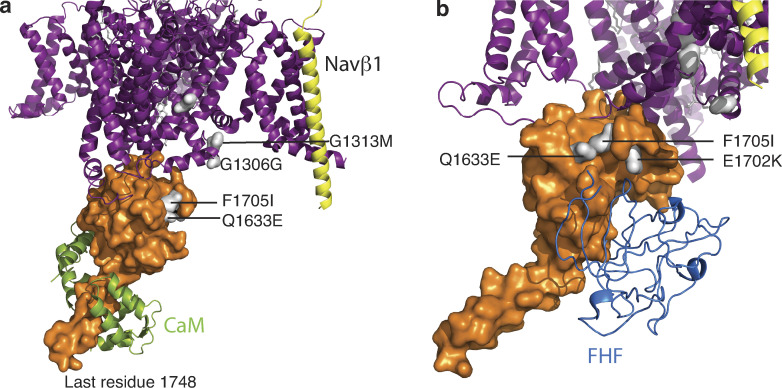
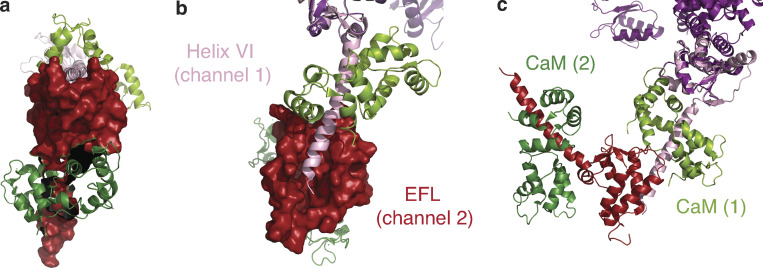
Voltage-gated sodium channels (NaVs) are membrane proteins responsible for the rapid upstroke of the action potential in excitable cells. There are nine human voltage-sensitive NaV1 isoforms that, in addition to their sequence differences, differ in tissue distribution and specific function. This review focuses on isoforms NaV1.4 and NaV1.5, which are primarily expressed in skeletal and cardiac muscle cells, respectively. The determination of the structures of several eukaryotic NaVs by single-particle cryo-electron microscopy (cryo-EM) has brought new perspective to the study of the channels. Alignment of the cryo-EM structure of the transmembrane channel pore with x-ray crystallographic structures of the cytoplasmic domains illustrates the complementary nature of the techniques and highlights the intricate cellular mechanisms that modulate these channels. Here, we review structural insights into the cytoplasmic C-terminal regulation of NaV1.4 and NaV1.5 with special attention to Ca2+ sensing by calmodulin, implications for disease, and putative channel dimerization.


Figures

Figure 1.
Figure 1.
Schematic of NaVs. (a) The NaVs are pseudotetramers with four transmembrane domains (DI–DIV, purple), with each domain containing six α-helices (S1–S6). The cytoplasmic CT has been shown to have six α-helices (αI–αVI; pink) with αI–αV forming the EFL. (b) The open configuration of the transmembrane domains, with S1–S6 of one domain shaded in purple to show S1–S4 (dark purple) forming the VSD that shifts to open the pore formed by S5–S6 (light purple).
Figure 2.
Figure 2.
Published crystal structures of CTNaV with CaM. (a) Structures aligned pairwise to CTNaV1.5–CaM (PDB accession no. 4OVN) using the EFL domain as an anchor. Each CT is in shades of red, CaM in green, and FHF in blue. The angle of helix αVI with respect to the EFL varies in these constructs. (b) The same structures aligned pairwise using the CaM C-lobe as an anchor and so helix αVI has the same orientation. These alignments highlight the different relative orientations of the EFL and helix αVI, displaying the EFL to the right (4OVN, 6MBA, 6MC9) or to the left (4DCK, 4JPZ, 4JQ0, 6MUD). (c) Complexes of CaM with shorter peptides of CTNaV1.5.
Figure 3.
Figure 3.
Cryo-EM structures of NaVs. α-Subunits are shown in purple and β-subunits are shown in yellow. 5X0M displays most of the N-terminal domain and the EFL of the CT domain.
Figure 4.
Figure 4.
Alignment of transmembrane NaVPas with CTNaV1.5. (a) NaVPas (PDB accession no. 5X0M) with cytoplasmic domain resolution. DIII–DIV linker is shown in cyan and EFL of CT in purple. (b) CTNaV1.5 is shown in pink and apo-CaM in green (PDB accession no. 4OVN). (c) Alignment of NaVPas with CTNaV1.5 shows overlap between the two structures (0.39 RMSD over 69 amino acids).
Figure 5.
Figure 5.
NaV1.4 displays CDI. (a) NaV1.5 Na+ current does not change upon Ca2+ release, but NaV1.4 INa is reduced upon optical Ca2+ release, indicated with a blue line. (b) When CTNaV1.4 is transplanted to NaV1.5 and vice versa, the CDI still only takes place in channels with CTNaV1.4. (c) Deletion of the NaV1.5 post-IQ motif reveals CDI with INa reduced at 10 µM Ca2+. a and b are adapted from Ben-Johny et al. (2014), and c is adapted from Yoder et al. (2019).
Figure 6.
Figure 6.
Populations of CTNaV1.4 and CTNaV1.5 with bound CaM. (a) Panels show the relative population (z-axis) of four CaM species bound to CTNaV, as a function of Ca2+ and CaM concentration. Black boxes indicate the dominant species at high CaM and 10 µM Ca2+; (Ca2+)2C–CaM for CTNaV1.4 (top) and (Ca2+)4–CaM for CTNaV1.5 (bottom). (b) Cross-section showing populations of CTNaV (Ca2+)–CaM species as a function of [Ca2+] at a [CaM] of 10 µM. Note the dramatic reduction of (Ca2+)2C–CaM for CTNaV1.5 compared with CTNaV1.4. Adapted from Yoder et al. (2019).
Figure 7.
Figure 7.
Sequence alignment of the post-IQ sequence in the NaV1s. (a) Alignment of the IQ and the post-IQ domains of the nine major human NaV isoforms. (b) Logo of the post-IQ sequences where the frequency of an amino acid at a given position is proportional to the size of its single amino acid letter descriptor.
Figure 8.
Figure 8.
Mutations in NaV1.5 mapped to its structure. (a) Overall structure of NaV1.5 with the transmembrane portion as observed in the cryo-EM structure (PDB accession no. 6UZ3) in purple. CT domain as observed in PDB accession no. 4OVN, shown in pink surface with mutations displayed in red. (b) Zoom-in showing mutations in the EFL and IQ region, potentially interacting with (or in close proximity to) CaM. (c) Mutations interacting with FHF of PDB accession no. 4JQ0. (d) Mutations of NaV1.5 in the EFL that line the binding site of the DIII–DIV linker.
Figure 9.
Figure 9.
Mutations in NaV1.4 mapped to its structure. (a) Overall structure of NaV1.4 with the transmembrane portion as observed in the cryo-EM structure (PDB accession no. 6AGF) in purple and NaV β1 in yellow. CT domain as observed in PDB accession no. 6MBA, shown in orange surface with mutations displayed in white. (b) Different 6MBA NaV1.4 orientation with FHF (from PDB accession no. 4JQ0 of NaV1.5 with FHF1b; aligned to 6MBA by CTNaV EFL) to show a possible interaction with Q1633.
Figure 10.
Figure 10.
NaV–NaV dimerization: interaction between CT helix αVI and EFL of an adjacent channel. (a) Front view of the complex of CTNaV1.5–CaM (red surface) with another channel’s helix αVI (pink ribbons) as observed in PDB accession no. 4OVN. CaM bound to each channel is shown in shades of green. (b) Bird’s eye view of a; the binding site of helix αVI of channel 1 (pink ribbons) on EFL of channel 2 (red surface). (c) Rotated 90° with both channels 1 and 2 shown in ribbons. NaV1.5 channel 1 is shown in pink with its CaM (light green), and NaV1.5 channel 2 EFL in red with its CaM (dark green).

Similar articles

Cited by

References

    1. Adelman, J.P. 2016. SK channels and calmodulin. Channels (Austin). 10:1–6. 10.1080/19336950.2015.1029688 - DOI - PMC - PubMed
    1. Agullo-Pascual, E., Lin X., Leo-Macias A., Zhang M., Liang F.X., Li Z., Pfenniger A., Lübkemeier I., Keegan S., Fenyö D., et al. . 2014. Super-resolution imaging reveals that loss of the C-terminus of connexin43 limits microtubule plus-end capture and NaV1.5 localization at the intercalated disc. Cardiovasc. Res. 104:371–381. 10.1093/cvr/cvu195 - DOI - PMC - PubMed
    1. Aldrich, R.W., Corey D.P., and Stevens C.F.. 1983. A reinterpretation of mammalian sodium channel gating based on single channel recording. Nature. 306:436–441. 10.1038/306436a0 - DOI - PubMed
    1. Allouis, M., Le Bouffant F., Wilders R., Péroz D., Schott J.J., Noireaud J., Le Marec H., Mérot J., Escande D., and Baró I.. 2006. 14-3-3 is a regulator of the cardiac voltage-gated sodium channel Nav1.5. Circ. Res. 98:1538–1546. 10.1161/01.RES.0000229244.97497.2c - DOI - PubMed
    1. Bähler, M., and Rhoads A.. 2002. Calmodulin signaling via the IQ motif. FEBS Lett. 513:107–113. 10.1016/S0014-5793(01)03239-2 - DOI - PubMed

Publication types