Randomized Controlled Trial
. 2021 Jun 1;203(11):1386-1397.
doi: 10.1164/rccm.202006-2319OC.

Effects of a Household Air Pollution Intervention with Liquefied Petroleum Gas on Cardiopulmonary Outcomes in Peru. A Randomized Controlled Trial

Affiliations
Randomized Controlled Trial

Effects of a Household Air Pollution Intervention with Liquefied Petroleum Gas on Cardiopulmonary Outcomes in Peru. A Randomized Controlled Trial

William Checkley et al. Am J Respir Crit Care Med. .

Abstract

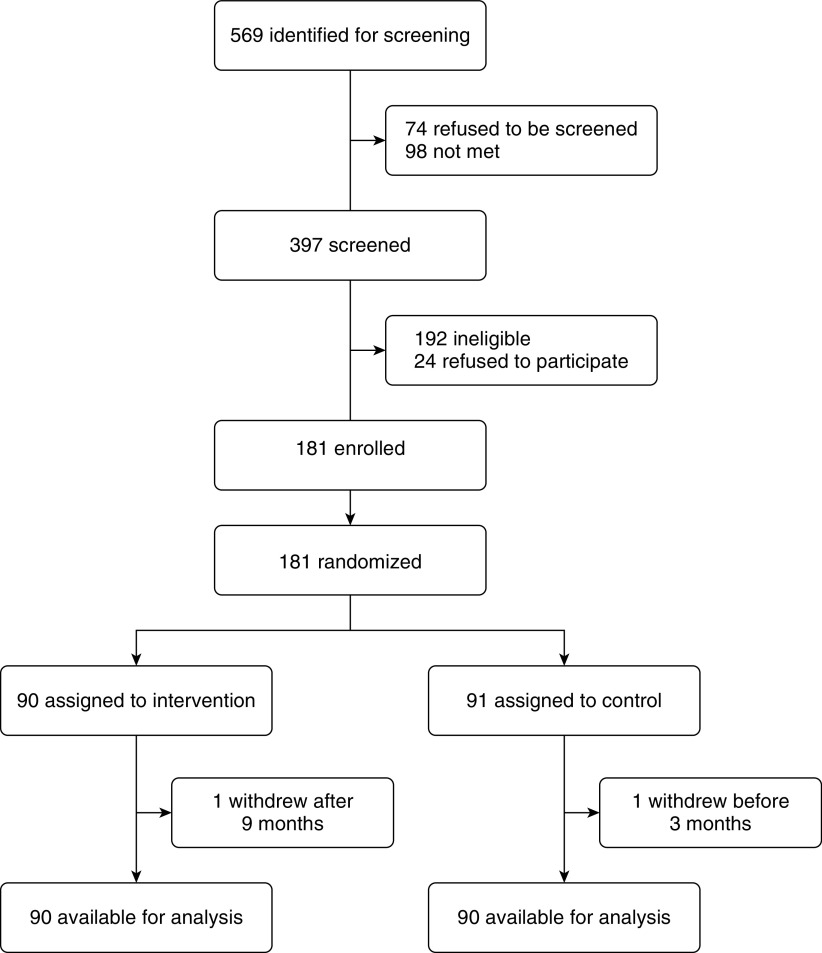
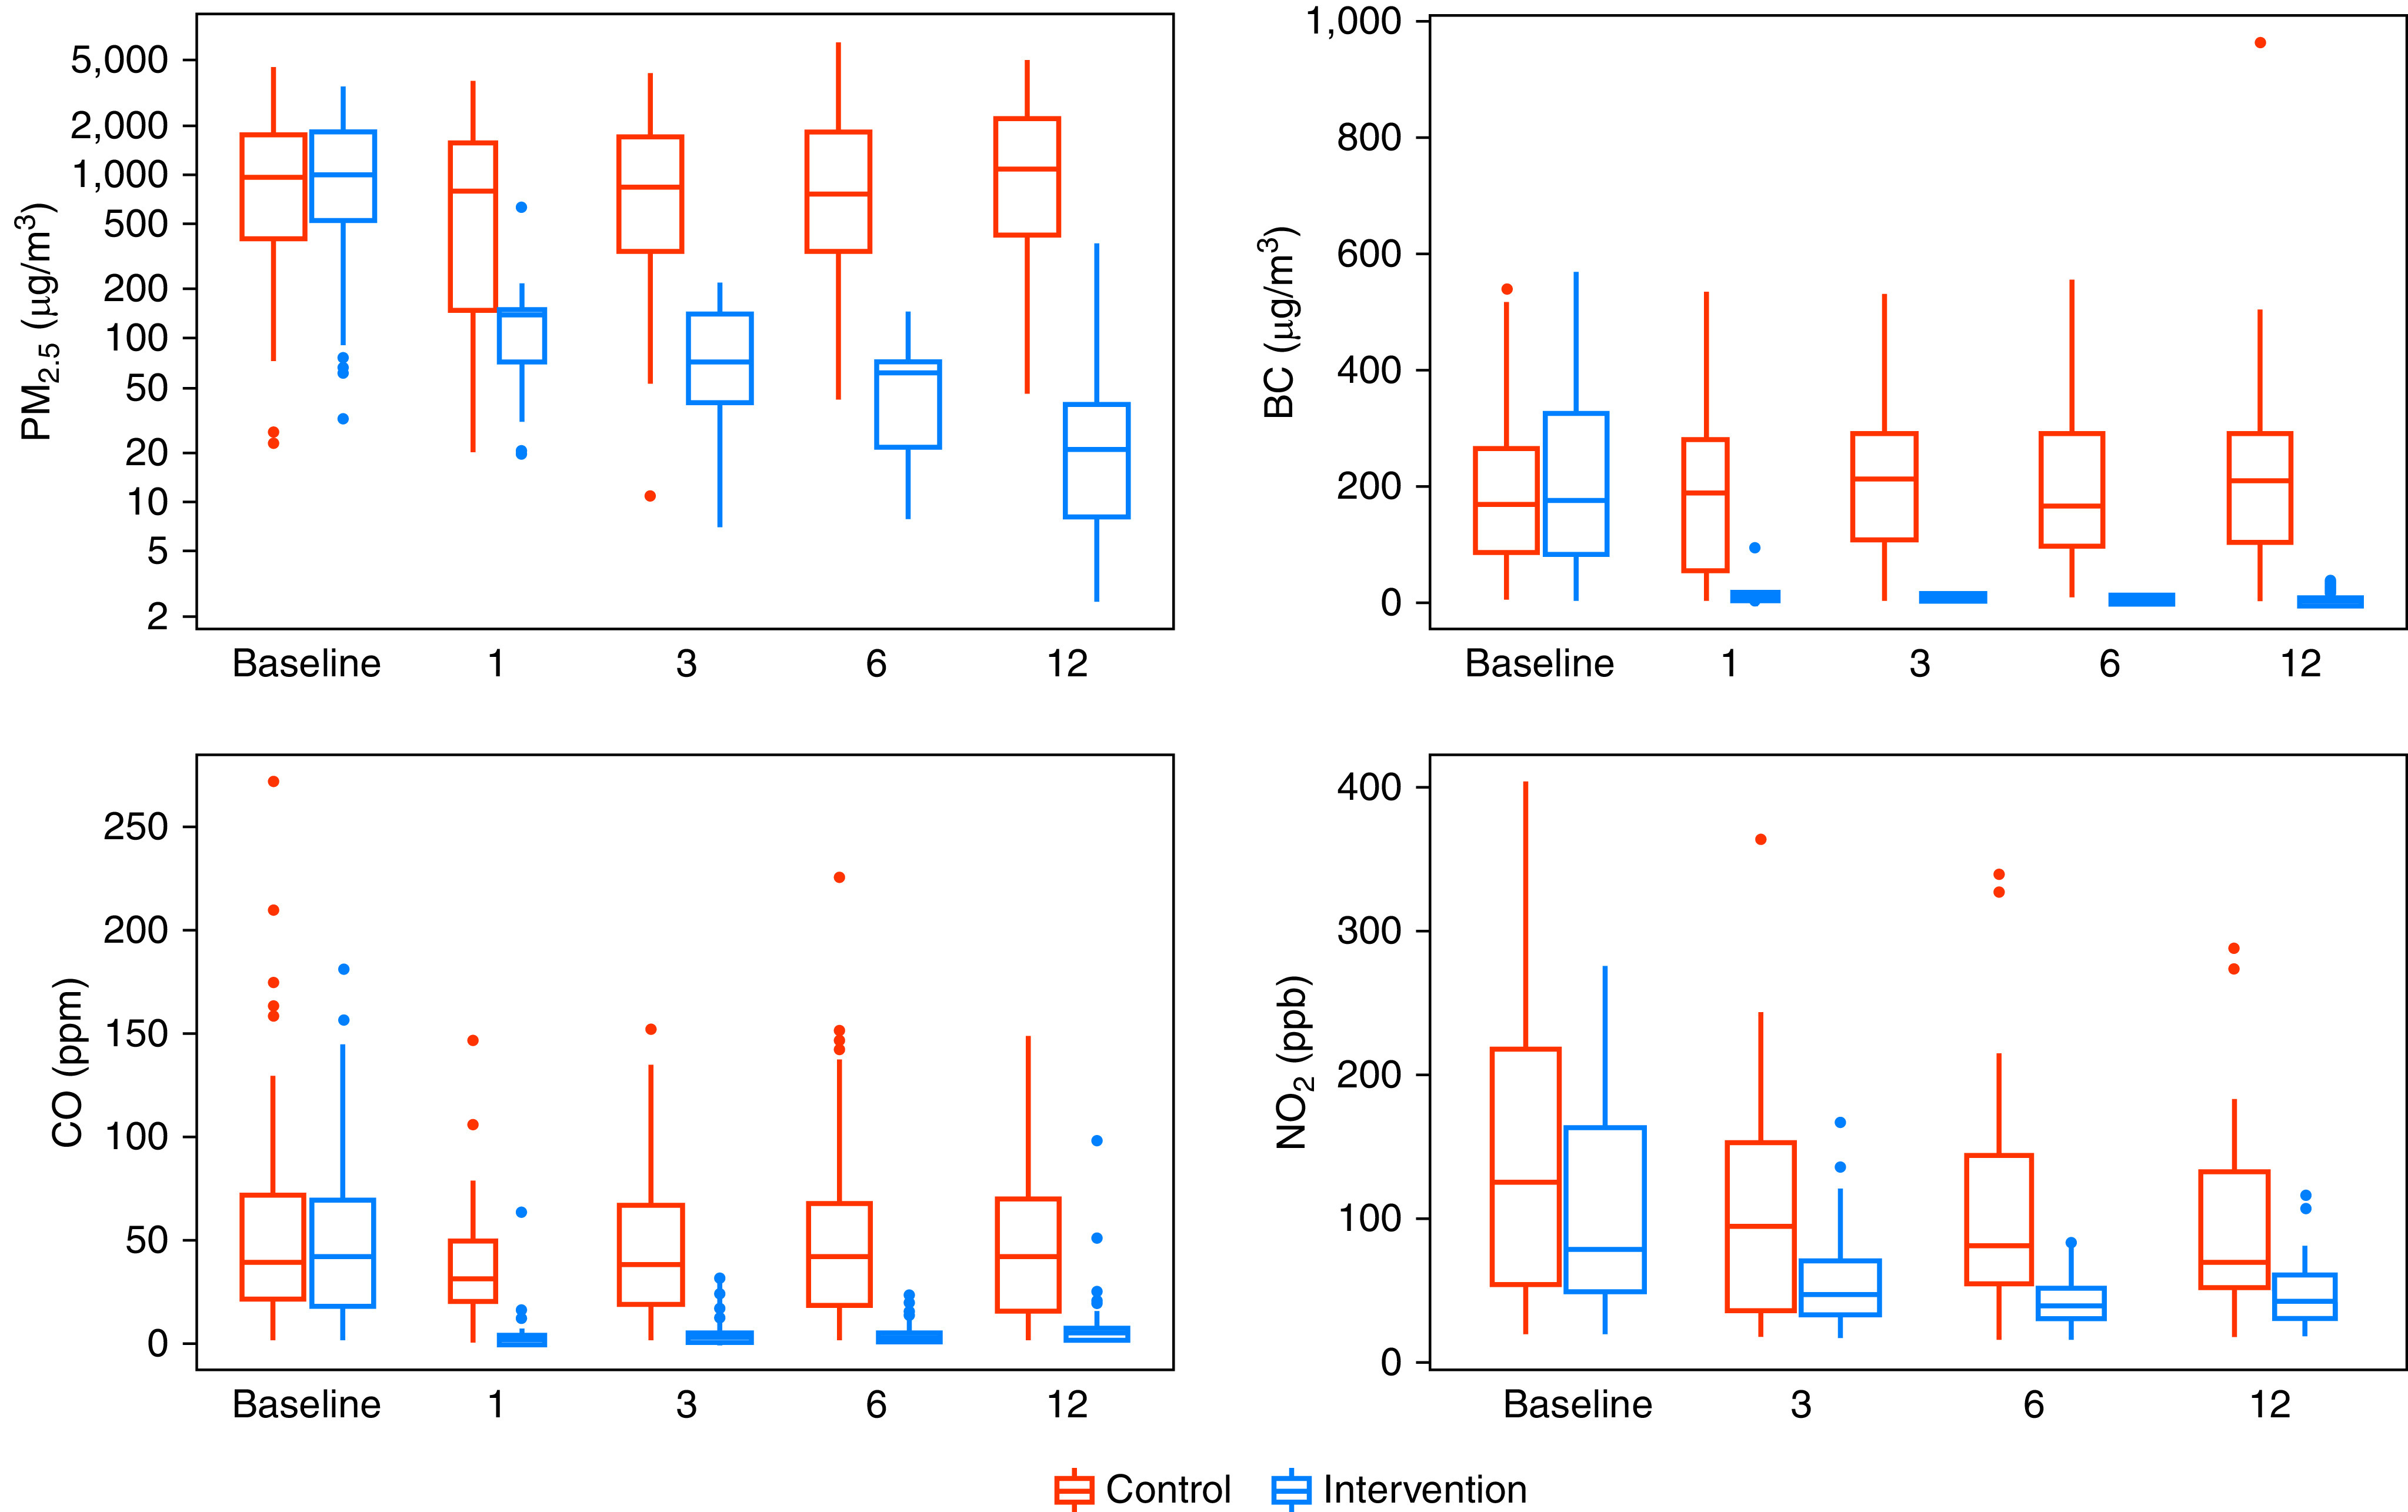
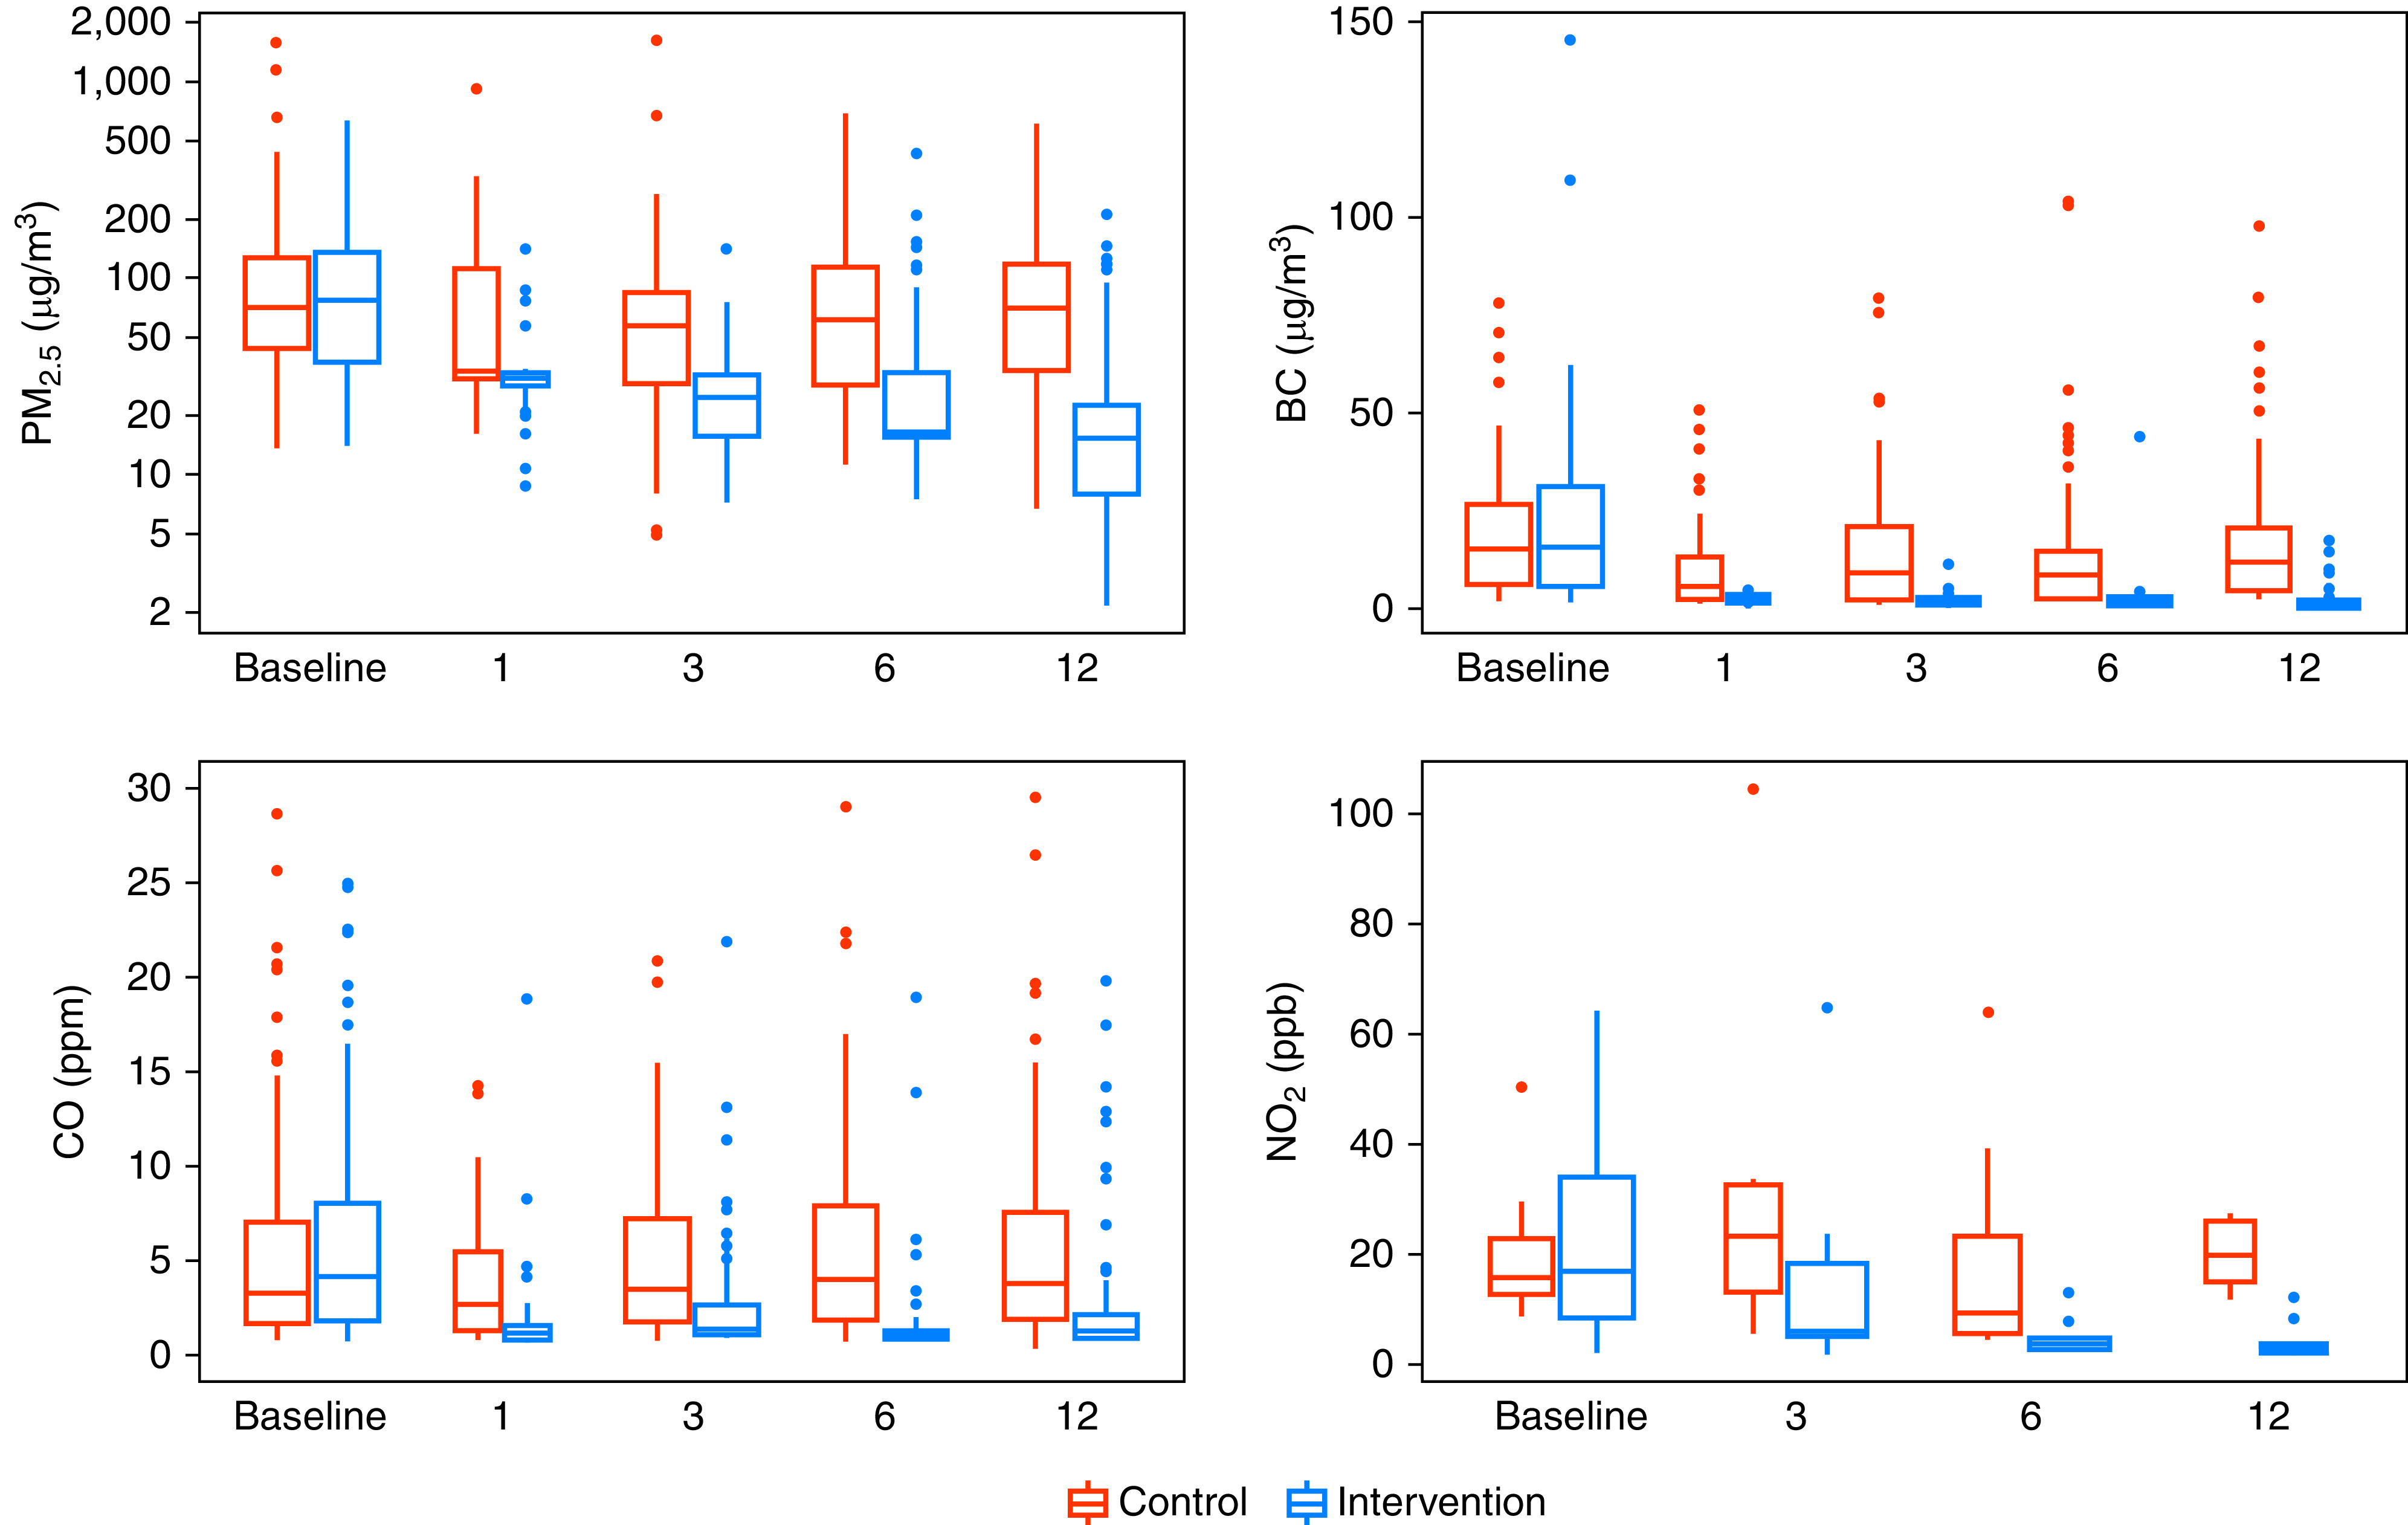
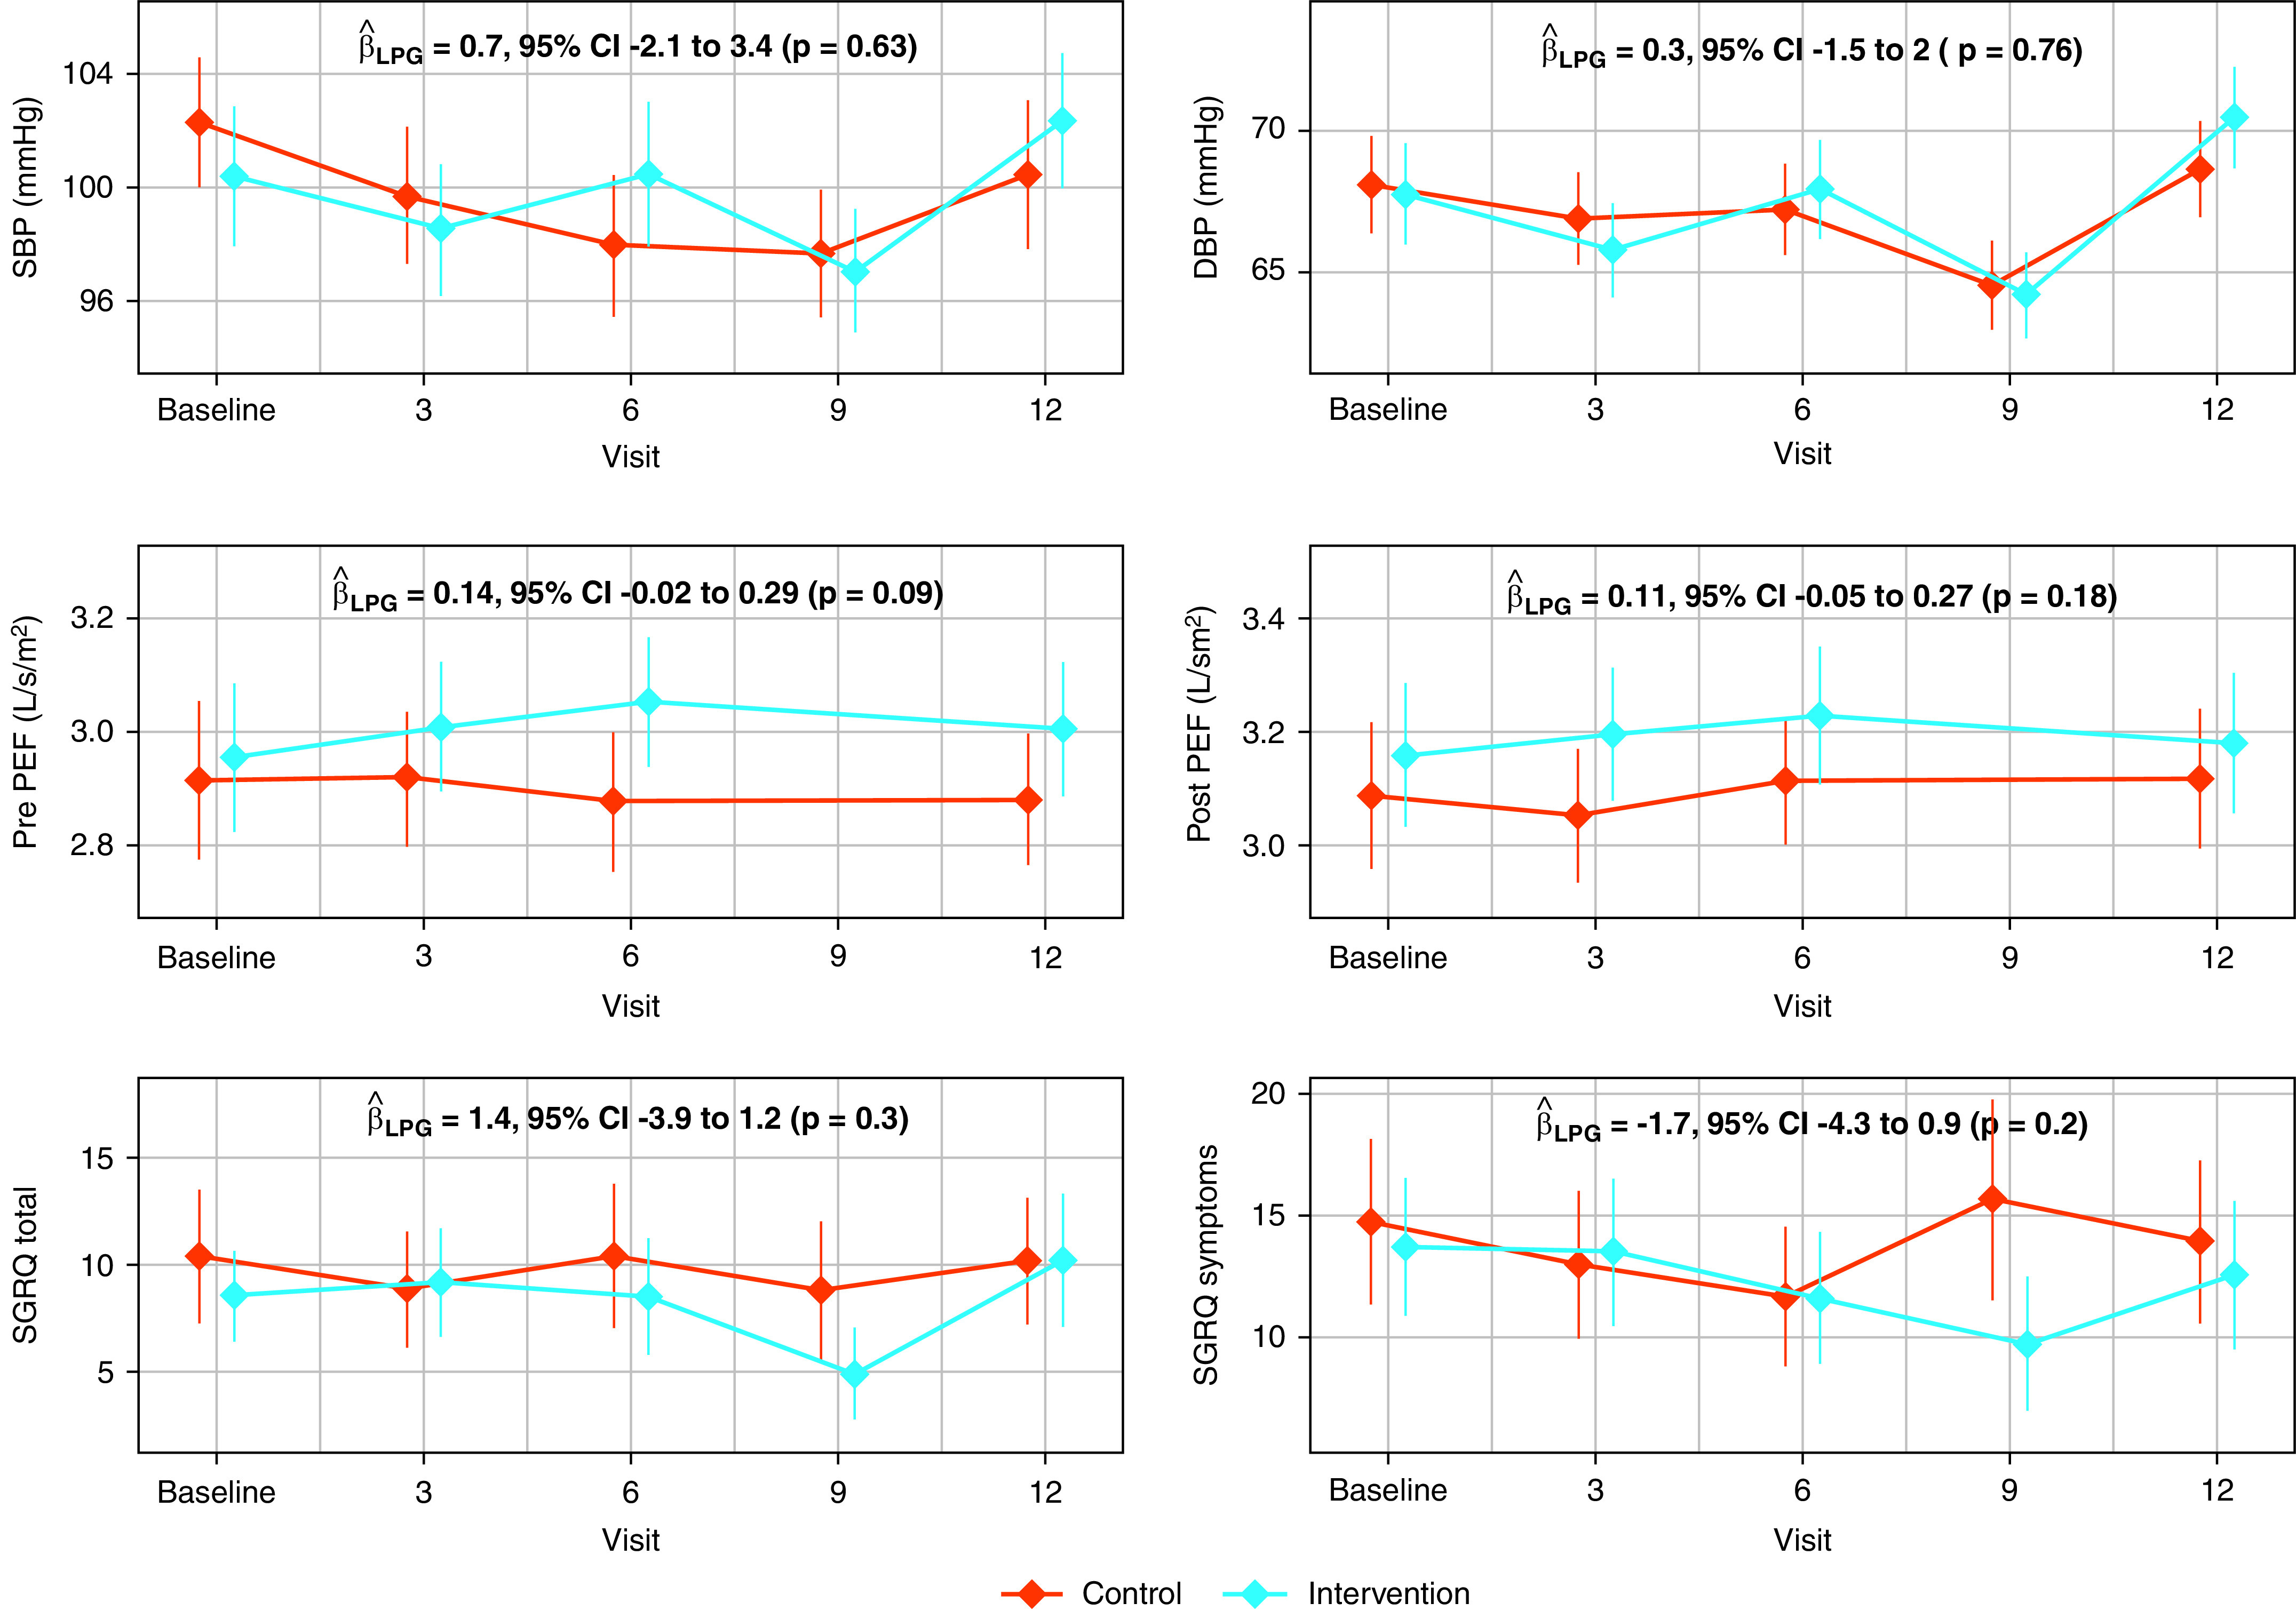
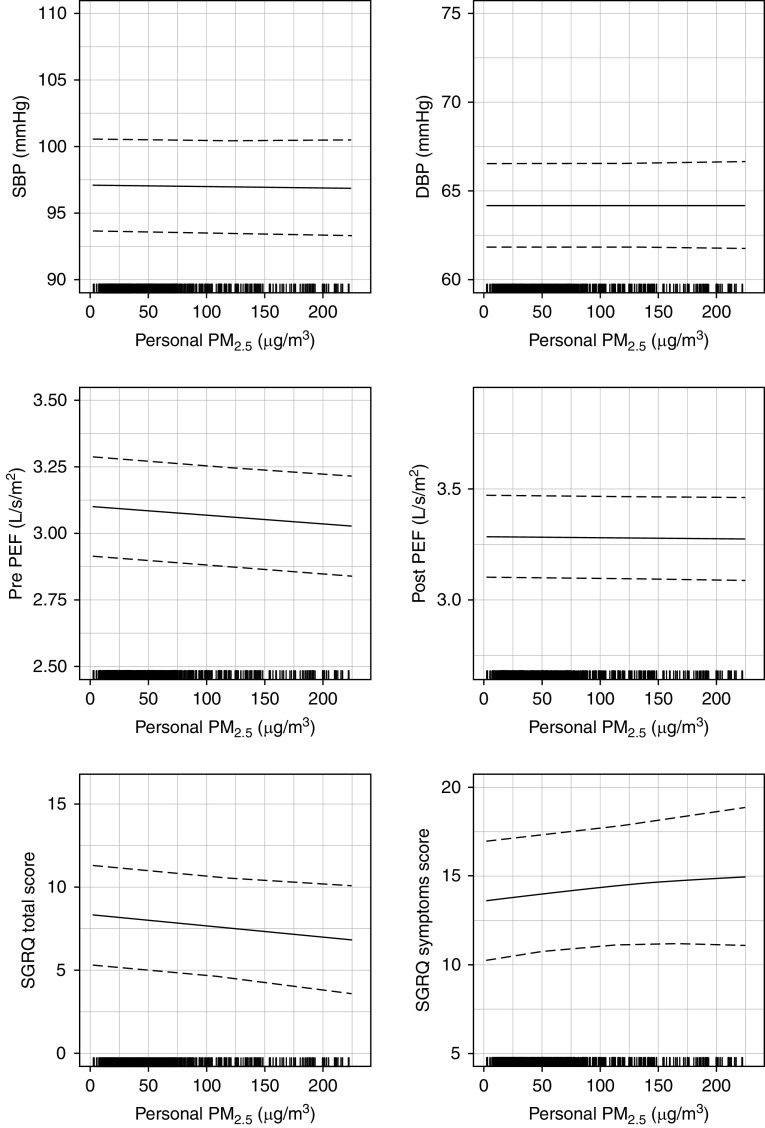
Rationale: Approximately 40% of people worldwide are exposed to household air pollution (HAP) from the burning of biomass fuels. Previous efforts to document health benefits of HAP mitigation have been stymied by an inability to lower emissions to target levels. Objectives: We sought to determine if a household air pollution intervention with liquefied petroleum gas (LPG) improved cardiopulmonary health outcomes in adult women living in a resource-poor setting in Peru. Methods: We conducted a randomized controlled field trial in 180 women aged 25-64 years living in rural Puno, Peru. Intervention women received an LPG stove, continuous fuel delivery for 1 year, education, and behavioral messaging, whereas control women were asked to continue their usual cooking practices. We assessed for stove use adherence using temperature loggers installed in both LPG and biomass stoves of intervention households. Measurements and Main Results: We measured blood pressure, peak expiratory flow (PEF), and respiratory symptoms using the St. George's Respiratory Questionnaire at baseline and at 3-4 visits after randomization. Intervention women used their LPG stove exclusively for 98% of days. We did not find differences in average postrandomization systolic blood pressure (intervention - control 0.7 mm Hg; 95% confidence interval, -2.1 to 3.4), diastolic blood pressure (0.3 mm Hg; -1.5 to 2.0), prebronchodilator peak expiratory flow/height2 (0.14 L/s/m2; -0.02 to 0.29), postbronchodilator peak expiratory flow/height2 (0.11 L/s/m2; -0.05 to 0.27), or St. George's Respiratory Questionnaire total score (-1.4; -3.9 to 1.2) over 1 year in intention-to-treat analysis. There were no reported harms related to the intervention. Conclusions: We did not find evidence of a difference in blood pressure, lung function, or respiratory symptoms during the year-long intervention with LPG. Clinical trial registered with www.clinicaltrials.gov (NCT02994680).

Keywords: blood pressure; household air pollution; lung function; respiratory symptoms.


Figures

Figure 1.
Figure 1.
Screening, randomization, and follow-up (Consolidated Standards of Reporting Trials [CONSORT] flow diagram).
Figure 2.
Figure 2.
Boxplots of kitchen area concentrations of particulate matter ≤ 2.5 μm in aerodynamic diameter (PM2.5), black carbon (BC), carbon monoxide (CO), and nitrogen dioxide (NO2) by trial arm and visit. In each panel, control households are represented by red-colored boxplots and intervention households by blue-colored boxplots. The width of the barplots in each panel is proportional with sample size. The sample size for baseline and 1-, 3-, 6-, and 12-month visits for control households are as follows: PM2.5 and BC (n0 = 89, n1 = 42, n3 = 89, n6 = 88, n12 = 89), CO (n0 = 84, n1 = 42, n3 = 84, n6 = 86, n12 = 86), and NO2 (n0 = 34, n3 = 36, n6 = 33, n12 = 35). The sample size for baseline and 1-, 3-, 6-, and 12-month visits for intervention households are as follows: PM2.5 and BC (n0 = 89, n1 = 43, n3 = 90, n6 = 90, n12 = 87), CO (n0 = 85, n1 = 41, n3 = 80, n6 = 82, n12 = 77), and NO2 (n0 = 48, n3 = 41, n6 = 33, n12 = 29).
Figure 3.
Figure 3.
Boxplots of personal exposure to particulate matter ≤ 2.5 μm in aerodynamic diameter (PM2.5), black carbon (BC), carbon monoxide (CO), and nitrogen dioxide (NO2) by trial arm and visit. In each panel, control women are represented by red-colored boxplots and intervention women by blue-colored boxplots. The width of the barplots in each panel is proportional with sample size. The sample sizes for baseline and 1-, 3-, 6-, and 12-month visits for control households are as follows: PM2.5 and BC (n0 = 90, n1 = 40, n3 = 87, n6 = 90, n12 = 90), CO (n0 = 81, n1 = 41, n3 = 79, n6 = 81, n12 = 81), and NO2 (n0 = 8, n3 = 6, n6 = 9, n12 = 5). The sample sizes for baseline and 1-, 3-, 6-, and 12-month visits for intervention households are as follows: PM2.5 and BC (n0 = 90, n1 = 45, n3 = 90, n6 = 89, n12 = 87), CO (n0 = 79, n1 = 38, n3 = 76, n6 = 79, n12 = 79), and NO2 (n0 = 11, n3 = 13, n6 = 13, n12 = 9).
Figure 4.
Figure 4.
Average blood pressure, peak expiratory flow, and respiratory symptoms scores by trial arm and visit. We summarized mean systolic blood pressure (SBP), diastolic blood pressure (DBP), pre- and postbronchodilator height-adjusted peak expiratory flow (PEF/height2), and the St. George’s Respiratory Questionnaire (SGRQ) total and symptoms scores with a filled diamond. The vertical lines represent 95% confidence intervals (95% CIs). In each panel, outcomes for intervention women are represented by blue-colored diamonds and lines and control households by red-colored diamonds and lines. We also present the between-arms difference (intervention – control), the 95% CI, and corresponding P value estimated from a linear-mixed model for each of the primary outcomes within each panel. The sample sizes for postrandomization visits in the control women were as follows: SBP and DBP (n0 = 90, n3 = 90, n6 = 90, n9 = 90, n12 = 90), prebronchodilator PEF/height2 (n0 = 89, n3 = 90, n6 = 90, n12 = 89), postbronchodilator PEF/height2 (n0 = 89, n3 = 90, n6 = 90, n12 = 90), and SGRQ total and symptoms scores (n0 = 90, n3 = 90, n6 = 90, n9 = 90, n12 = 90). The sample sizes for postrandomization visits in the intervention women were as follows: SBP and DBP (n0 = 90, n3 = 90, n6 = 90, n9 = 90, n12 = 89), pre- and postbronchodilator PEF/height2 (n0 = 90, n3 = 90, n6 = 90, n12 = 88), and SGRQ total and symptoms scores (n0 = 90, n3 = 90, n6 = 90, n9 = 90, n12 = 89). LPG = liquefied petroleum gas.
Figure 5.
Figure 5.
Exposure–response relationships between personal exposures to particulate matter that is ≤ 2.5 μm in aerodynamic diameter (PM2.5) and primary cardiopulmonary outcomes. The 180 participants contributed 713 pairs of blood pressure or St. George’s Respiratory Questionnaire (SGRQ) and personal exposure to PM2.5, and 711 pairs of peak expiratory flow (PEF) and personal exposure to PM2.5 data to these analyses. The six panels correspond to the association between personal exposures to PM2.5 and either blood pressure (SBP and DBP), PEF (pre- and postbronchodilator PEF/height2), and SGRQ (total and symptoms scores). In each of the six panels, we plot the estimated thin plate regression splines that describe the adjusted association between PM2.5 and each cardiopulmonary outcome (mean = solid line, 95% confidence interval = broken lines). We visually restricted the plots to show up to the 95th percentile of personal exposures to PM2.5 (230 μg/m3). We show a rug plot of the distribution of personal exposures to PM2.5. DBP = diastolic blood pressure; SBP = systolic blood pressure.

Comment in

References

    1. Bonjour S, Adair-Rohani H, Wolf J, Bruce NG, Mehta S, Prüss-Ustün A, et al. Solid fuel use for household cooking: country and regional estimates for 1980-2010. Environ Health Perspect . 2013;121:784–790. - PMC - PubMed
    1. Zhang J, Smith KR. Indoor air pollution: a global health concern. Br Med Bull . 2003;68:209–225. - PubMed
    1. GBD 2017 Risk Factors Collaborators. Global, regional, and national comparative risk assessment of 84 behavioral, environmental and occupational, and metabolic risks or clusters of risks for 195 countries and territories, 1990–2017: a systematic analysis for the Global Burden of Disease Study 2017. Lancet . 2018;392:1923–1994. - PMC - PubMed
    1. Thakur M, Nuyts PAW, Boudewijns EA, Flores Kim J, Faber T, Babu GR, et al. Impact of improved cookstoves on women’s and child health in low and middle income countries: a systematic review and meta-analysis. Thorax . 2018;73:1026–1040. - PubMed
    1. Po JY, FitzGerald JM, Carlsten C. Respiratory disease associated with solid biomass fuel exposure in rural women and children: systematic review and meta-analysis. Thorax . 2011;66:232–239. - PubMed

Publication types

Associated data