. 2021 Jan 21;184(2):323-333.e9.
doi: 10.1016/j.cell.2020.12.001. Epub 2020 Dec 4.

Amplification-free detection of SARS-CoV-2 with CRISPR-Cas13a and mobile phone microscopy

Affiliations

Amplification-free detection of SARS-CoV-2 with CRISPR-Cas13a and mobile phone microscopy

Parinaz Fozouni et al. Cell. .

Abstract

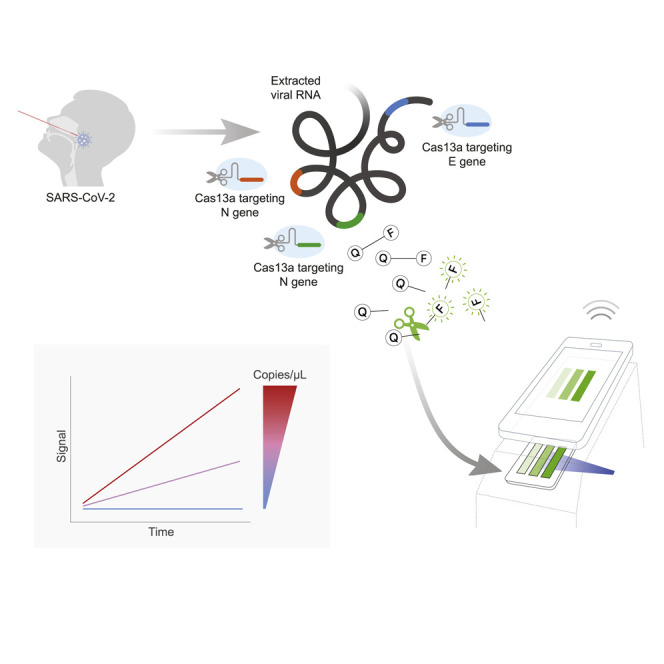
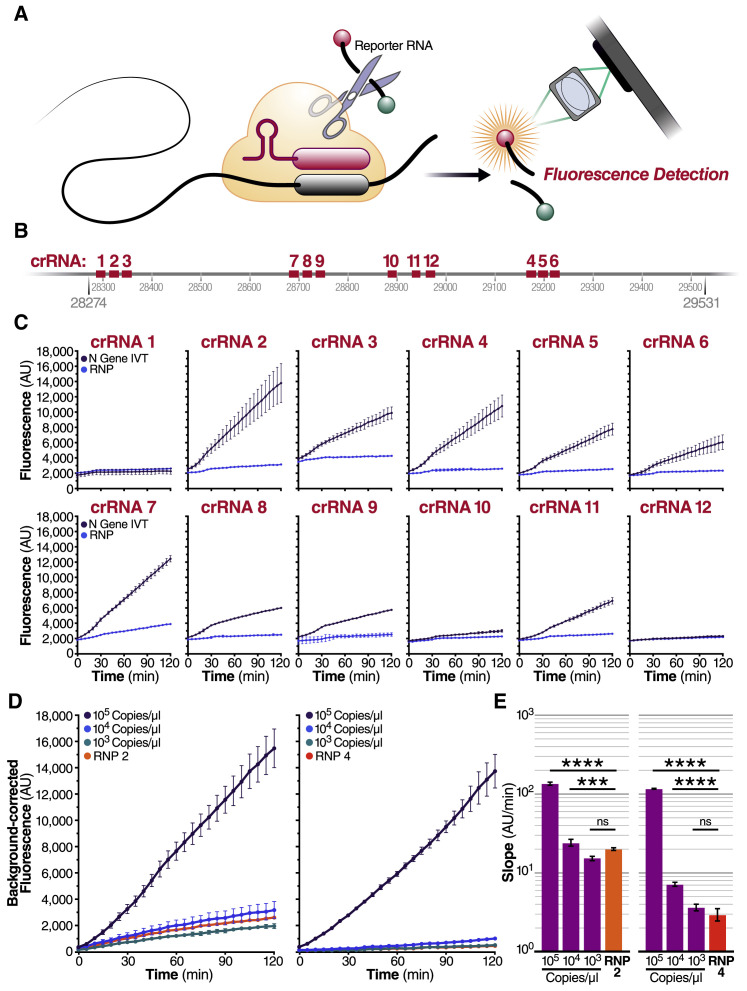
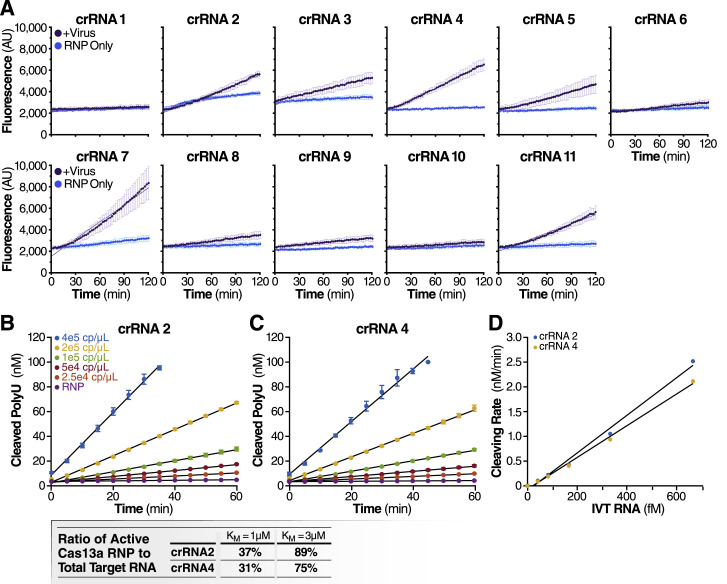
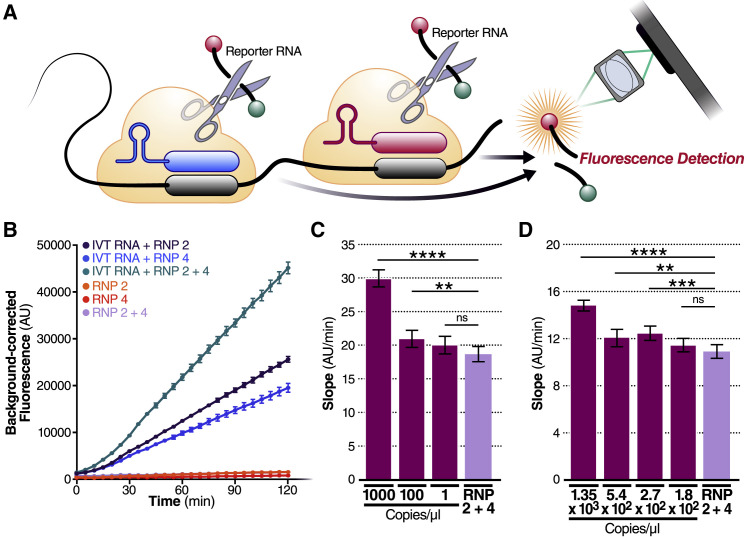
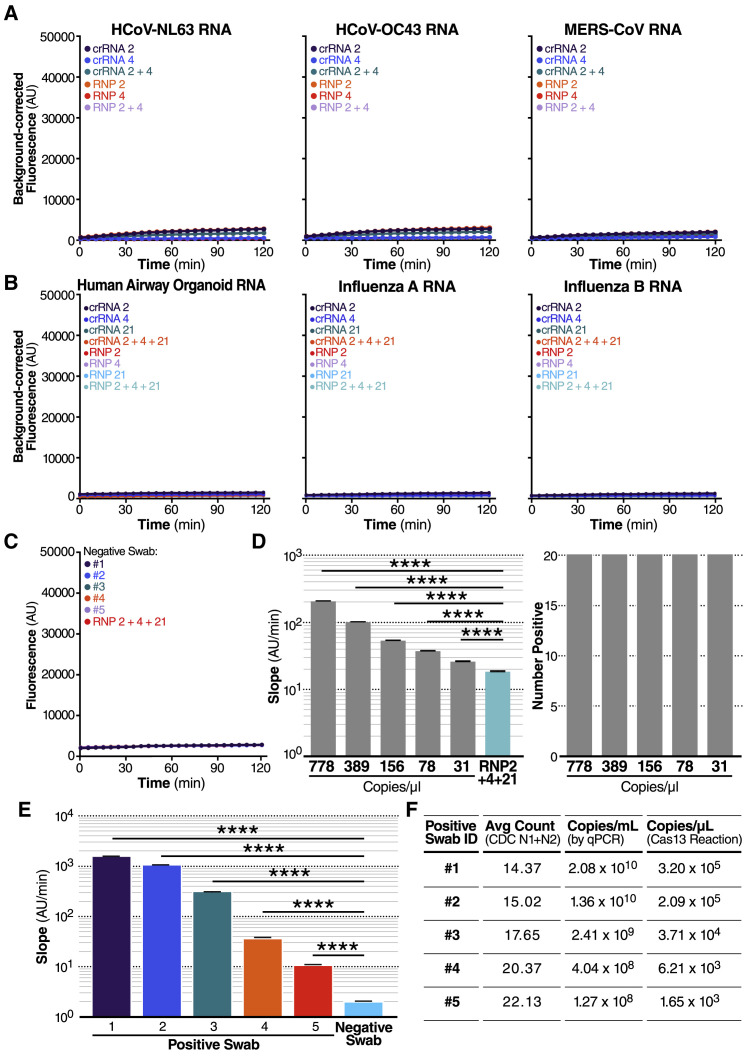
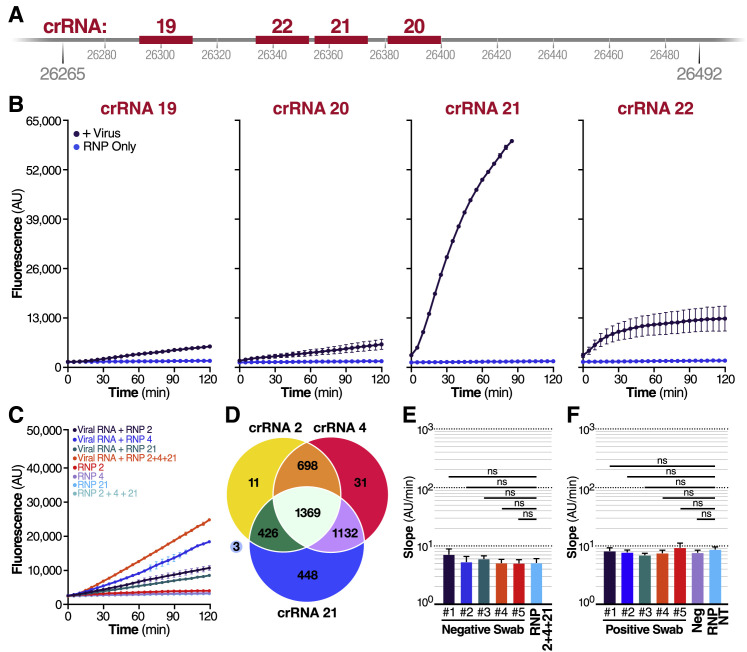
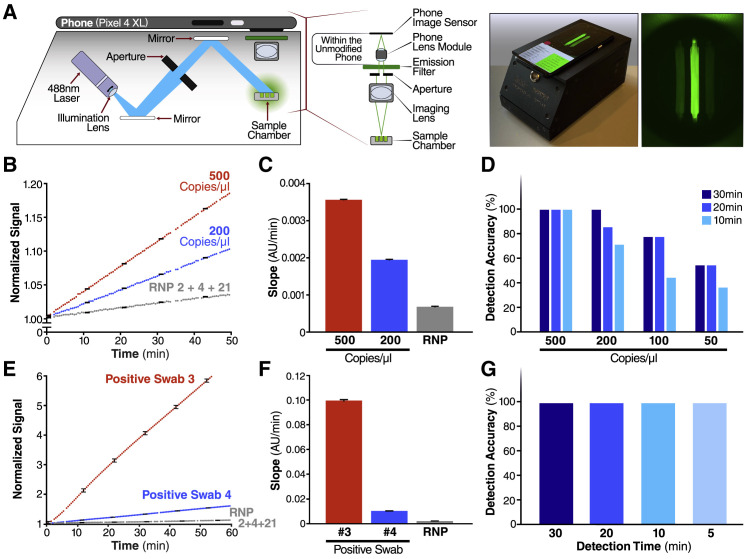
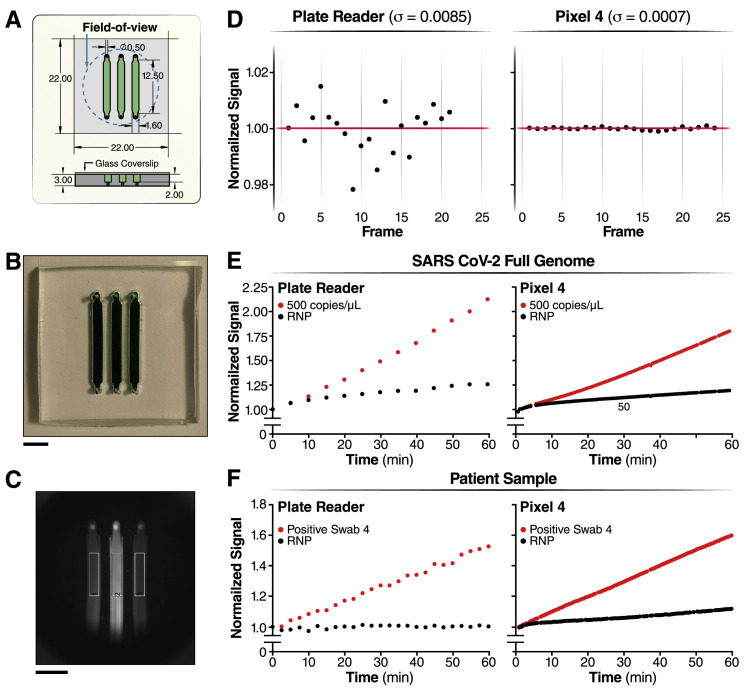
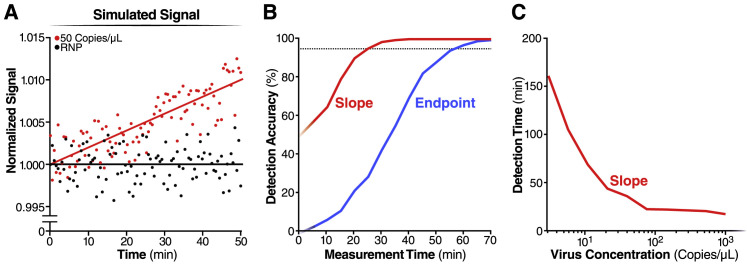
The December 2019 outbreak of a novel respiratory virus, SARS-CoV-2, has become an ongoing global pandemic due in part to the challenge of identifying symptomatic, asymptomatic, and pre-symptomatic carriers of the virus. CRISPR diagnostics can augment gold-standard PCR-based testing if they can be made rapid, portable, and accurate. Here, we report the development of an amplification-free CRISPR-Cas13a assay for direct detection of SARS-CoV-2 from nasal swab RNA that can be read with a mobile phone microscope. The assay achieved ∼100 copies/μL sensitivity in under 30 min of measurement time and accurately detected pre-extracted RNA from a set of positive clinical samples in under 5 min. We combined crRNAs targeting SARS-CoV-2 RNA to improve sensitivity and specificity and directly quantified viral load using enzyme kinetics. Integrated with a reader device based on a mobile phone, this assay has the potential to enable rapid, low-cost, point-of-care screening for SARS-CoV-2.

Keywords: COVID-19; CRISPR Dx; CRISPR-Cas13; SARS-CoV-2; mobile phone microscopy; point-of-care diagnostics.


Conflict of interest statement

Declaration of interests P.F., S.S., G.J.K., J.A.D., D.A.F., and M.O. have filed patent applications related to this work. The Regents of the University of California have patents issued and pending for CRISPR technologies on which J.A.D. is an inventor. J.A.D. is a cofounder of Caribou Biosciences, Editas Medicine, Scribe Therapeutics, Intellia Therapeutics, and Mammoth Biosciences. J.A.D. is a scientific advisory board member of Caribou Biosciences, Intellia Therapeutics, eFFECTOR Therapeutics, Scribe Therapeutics, Mammoth Biosciences, Synthego, Algen Biotechnologies, Felix Biosciences, and Inari. J.A.D. is a director at Johnson & Johnson and has research projects sponsored by Biogen, Pfizer, AppleTree Partners, and Roche.

Figures

None
Graphical abstract
Figure 1
Figure 1
Quantitative direct detection of viral SARS-CoV-2 RNA with Cas13a (A) Schematic of a Cas13a (beige)-crRNA (red) RNP complex binding target RNA (black), resulting in activation of the HEPN nuclease (denoted by scissors) domain. Upon target recognition and RNP activation, Cas13a indiscriminately cleaves a quenched-fluorophore RNA reporter, allowing for fluorescence detection as a proxy for Cas13a activation and target RNA. (B) Schematic of the SARS-CoV-2 N gene, and the corresponding location of each crRNA spacer region. (C) Cas13a RNPs made individually with each crRNA were tested against 2.89 × 105 copies/μL (480 fM) of SARS-CoV-2 IVT N gene RNA in a total 20 μL reaction volume. Background fluorescence by the individual RNP in the absence of target RNA is shown as “RNP.” Raw fluorescence values over 2 h is shown. Data are represented as mean ± standard deviation (SD) of three technical replicates. See also Figure S1A. (D) Limit of detection of crRNA 2 and crRNA 4 was determined by testing 100 nM of each RNP individually against 105, 104, and 103 copies/μL of N gene IVT RNA. “RNP 2” and “RNP 4” represent no target RNA RNP alone controls. Background correction of fluorescence was performed by subtraction of reporter alone fluorescence values. Data are represented as mean ± standard error of the difference between means of three technical replicates. See also Figures S1B–S1D. (E) Slope of the curve over 2 h from Figure 1D was calculated by performing simple linear regression to data merged from replicates and is shown as slope ± 95% confidence interval. Slopes were compared to the RNP alone control through an analysis of covariance (ANCOVA): ∗∗∗∗p < 0.0001, ∗∗∗p < 0.001, ns = not significantly higher than RNP control.
Figure S1
Figure S1
Individual crRNAs quantitatively detect SARS-CoV-2 RNA, related to Figure 1 (A) Cas13a RNPs made individually with each N gene crRNA (final RNP complex concentration of 100 nM) were tested against extracted SARS-CoV-2 viral RNA. Background fluorescence by the individual RNP in the absence of target RNA is shown as “RNP Only.” Raw fluorescence values over 2 h is shown. Data are represented as mean ± SD of three technical replicates. (B and C) Cas13a reaction rate is linearly proportional to the target RNA concentration. (B) The reaction rate of Cas13a was measured by adding a range of concentrations of IVT N gene RNA to reactions that contain 100 nM of Cas13a RNP with crRNA 2 and 400 nM of polyU reporter (error bars indicate the standard deviation of triplicate measurements). The reaction rate is determined by fitting a linear curve to the data (black curves). (C) The reaction rate of Cas13a for a range of IVT N gene RNA concentrations as measured in Figure S1B but with crRNA 4 used in place of crRNA 2. (D) Cas13a reaction rate – either with crRNA 2 or crRNA 4 – scales linearly with the target IVT RNA concentration (R2 = 0.990 for crRNA 2 and 0.996 for crRNA 4). Assuming that Cas13a enzymatic activity can be described by the Michaelis-Menten kinetics model, and that the amount of IVT RNA sets the upper limit of active Cas13a RNP, we predict the ratio of active Cas13a to IVT RNA in for Kcat = 600/s and KM = 1 μM or 3 μM, which is the range of KM previously found for Cas13b (Slaymaker et al., 2019).
Figure 2
Figure 2
Combining crRNAs improves sensitivity of Cas13a (A) Schematic of two different RNPs binding to different locations of the same SARS-CoV-2 RNA, leading to cleavage of the RNA reporter and increased fluorescence. (B) RNPs made with crRNA 2 and crRNA 4 individually and in combination (50 nM total RNP concentration per reaction) were tested against 2.89 × 105 copies/μL (480 fM) of SARS-CoV-2 IVT N gene RNA and compared to fluorescence from no target RNA RNP alone controls (“RNP 2,” “RNP 4,” and “RNP 2+4”). Background correction of fluorescence was performed by subtraction of reporter-alone fluorescence values. Data are represented as mean ± standard error of the difference between means of three technical replicates. (C) Limit of detection of crRNA 2 and crRNA 4 in combination was determined by combining 50 nM of RNP 2 and 50 nM of RNP 4 (100 nM total) against 1,000, 100, and 1 copy/μL of SARS-CoV-2 IVT RNA (n = 3, technical replicates). Slope of the curve over 2 h was calculated by performing simple linear regression of data merged from replicates and is shown as slope ± 95% confidence interval. Slopes were compared to the no target RNA RNP alone control using ANCOVA: ∗∗∗∗p < 0.0001, ∗∗p = 0.0076, ns = not significant. (D) Limit of detection of crRNA 2 and crRNA 4 in combination was determined by combining 50 nM of RNP 2 and 50 nM of RNP 4 (100 nM total) against 1.35 × 103, 5.4 × 102, 2.7 × 102, and 1.8 × 102 copies/μL of genomic SARS-CoV-2 viral RNA as quantified by qPCR (n = 3, technical replicates). Slope of the curve over 2 h was calculated by performing simple linear regression of data merged from replicates and is shown as slope ± 95% confidence interval. Slopes were compared to the no target RNA RNP alone control using ANCOVA: ∗∗∗∗p < 0.0001, ∗∗∗p = 0.0002, ∗∗p = 0.0023, ns = not significant.
Figure 3
Figure 3
Cas13a directly detects SARS-CoV-2 RNA in patient samples (A) crRNA 2 and crRNA 4 were tested individually (100 nM total RNP concentration) and in combination (100 nM total RNP concentration: 50 nM each of RNP 2 and RNP 4) against RNA isolated from HCoV-NL63 viral supernatant (left) and HCoV-OC43 viral supernatant (center) or the IVT N gene RNA from MERS-CoV (right). No target RNA RNP alone controls are denoted as “RNP 2,” “RNP 4,” and “RNP 2+4.” Background correction of fluorescence was performed by subtraction of reporter alone fluorescence values. Data are represented as mean ± standard error of the difference between means of three technical replicates. (B) crRNA 2, crRNA 4, and crRNA 21 were tested individually (100 nM total RNP concentration) and in combination (100 nM total RNP concentration: 33 nM each of RNP 2, RNP 4, and RNP 21) against RNA isolated from human airway organoids (left), H1N1 influenza A (center), and influenza B (right). No target RNA RNP alone controls are denoted as “RNP 2,” “RNP 4,” “RNP 21,” and “RNP 2+4+21.” Background correction of fluorescence was performed by subtraction of reporter alone fluorescence values. Data are represented as mean ± standard error of the difference between means of three technical replicates. See also Figures S2A–S2D. (C) RNA from five nasopharyngeal swabs confirmed negative for SARS-CoV-2 by RT-qPCR was tested against RNP 2+4+21 (100 nM total RNP concentration). The no target RNA RNP control is denoted as “RNP 2+4+21.” Raw fluorescence values over 2 h is shown. Data are represented as mean ± SD of three technical replicates. See also Figure S2E. (D) Dilutions of genomic SARS-CoV-2 RNA independently quantified by BEI using ddPCR was tested against RNP 2+4+21 to determine the limit of detection (n = 20, technical replicates). Slope of the raw fluorescence curve over 2 h was calculated by performing simple linear regression of data merged from replicates and is shown as slope ± 95% confidence interval (left). Slopes were compared to the no target RNA RNP alone control using ANCOVA: ∗∗∗∗p < 0.0001. An individual reaction containing the diluted SARS-Cov-2 RNA was compared with the reaction without the target RNA and the number of true positives was counted at the 95% confidence level (right). (E) Pre-extracted RNA from five nasopharyngeal swabs confirmed positive for SARS-CoV-2 by RT-qPCR was tested against RNP 2+4+21 (100 nM total RNP concentration) (n = 3, technical replicates). A confirmed negative swab was tested against RNP 2+4+21 for comparison. We added 0.3 μL of RNA from Patient Swabs 1–4, 0.26 mL of RNA from Patient Swab 5, and 0.3 μL of RNA from a confirmed negative swab to each 20 μL Cas13a reaction (in triplicate). Slope of the raw fluorescence curve over 2 h was calculated by performing simple linear regression of data merged from replicates and is shown as slope ± 95% confidence interval. Slopes were compared to the negative swab RNP background control using ANCOVA: ∗∗∗∗p < 0.0001. See also Figure S2F. (F) The Ct value (average Ct count using CDC N1/N2 primers in RT-qPCR), the copies/mL of the original sample determined by qPCR, and the copies/μL in the Cas13a reaction are described for the RNA samples from each positive swab used in Figure 3E.
Figure S2
Figure S2
Combining crRNAs improves SARS-CoV-2 detection, related to Figure 3 (A) Schematic of the SARS-CoV-2 envelope (E) gene, and the corresponding location of each crRNA spacer region. (B) Cas13a RNPs made individually with each E gene crRNA (final RNP complex concentration of 100 nM) were tested against genomic SARS-CoV-2 RNA. Background fluorescence by the RNP alone in the absence of target RNA is shown as “RNP Only.” Raw fluorescence values over 2 h are shown. Data are represented as mean ± SD of three technical replicates. (C) RNPs made with crRNA 2, crRNA 4, and crRNA 21 individually and in combination (100 nM total RNP concentration for each reaction) were tested against 1.5 × 104 copies/mL of extracted SARS-CoV-2 RNA, and compared to fluorescence from no target RNA RNP alone controls (“RNP 2,” “RNP 4,” “RNP 21,” and “RNP 2+4+21”). Raw fluorescence values over 2 h is shown. Data are represented as mean ± SD of three technical replicates. (D) 4118 complete SARS-CoV-2 genome sequences deposited in NCBI RefSeq under taxonomy ID (2697049) were downloaded on 06/05/2020. Each crRNA was compared against the downloaded genomes for genomes with zero mismatches to each individual crRNA. The Venn diagram shows how many complete genomes have 100% homology to crRNAs 2, 4, and 21, as well as the overlap between crRNAs. (E) Slope of the curves in Figure 3C over two h was calculated by performing simple linear regression of data from each replicate (n = 3) individually. The mean of the replicate slopes is shown as slope ± 95% confidence interval. Slopes were compared to the no target RNA RNP alone control using repeated-measures one-way analysis of variance (ANOVA) and Dunnett’s multiple comparisons test: ns = not significant. (F) The same swabs as in Figure 3E were tested against a non-targeting crRNA (RNP NT) (final RNP complex concentration of 100 nM). Slope of the raw fluorescence curve over 2 h was calculated by performing simple linear regression of data merged from replicates (n = 3) and is shown as slope ± 95% confidence interval. Slopes were compared to the no target RNA RNP alone control using ANCOVA: ns = not significant.
Figure 4
Figure 4
Harnessing the mobile phone camera as a portable plate reader (A) Schematic of mobile phone-based microscope for fluorescence detection showing illumination and image collection components (left). Picture of assembled device used for data collection and sample image taken by the mobile phone camera after running a Cas13a assay (right). See also Figures S3A–S3C. (B) Results from the Cas13a assay run on the mobile device with two different dilutions of genomic SARS-CoV-2 viral RNA isolated from infected Vero CCL-81 cells (500 and 200 copies/μL) and RNP alone, using three combined crRNAs (crRNA 2, crRNA 4, and crRNA 21). y axis is the fluorescent signal of each sample normalized by the first time point. The error bars indicate the root-mean-square error (RMSE) of simple linear regression to individual curves. See also Figures S3D and S3E. (C) Slope of the curve over 30 min of measurement on the device from Figure 4B was calculated by simple linear regression and is shown as slope ± 95% confidence interval. (D) Detection accuracy of the Cas13a assay is characterized in the mobile device using genomic SARS-CoV-2 viral RNA. For each target dilutions, the slope at three different times—10, 20, and 30 min of measurement time on the device—were compared to the slope of the no target RNA RNP alone controls, and the detection accuracy was determined at the 95% confidence level. The number of replicates for each concentration is 8 (500 copies/μL), 7 (200 copies/μL), 9 (100 copies/μL), and 11 (50 copies/μL). See also Figures S4A–S4C. (E) Results from a Cas13a assay run on mobile device with two different nasal swab samples, confirmed positive for SARS-CoV-2 using RT-qPCR, and the RNP alone control, all using the crRNA combination of crRNA 2, crRNA 4, and crRNA 21. The error bars indicate the RMSE of simple linear regression to individual curves. See also Figure S3F. (F) Slope of the curve over 30 min from Figure 4E was calculated by simple linear regression and is shown as slope ± 95% confidence interval. (G) Detection accuracy of Cas13a assay for 5 nasal swab samples, confirmed positive by RT-qPCR. Detection accuracy was evaluated at four different time points: 5, 10, 20, and 30 min of measurement time on the device.
Figure S3
Figure S3
Comparison of the Cas13a reaction measured in the plate reader and the mobile phone device, related to Figure 4 (A–C) Schematic of the reaction chamber and the sample region-of-interest (ROI) (A) Reaction chamber dimensions are described here. (B) Photo of a reaction chamber loaded with an artificial green dye (Scale bar = 5 mm). (C) Raw image of patient sample and the sample ROIs (black rectangle) (Scale bar = 5 mm). (D) The measurement error of the plate reader (left) versus the mobile device (right) for typical conditions used for Cas13a reaction (37°C, measurement interval: 30 s). (E) The triple crRNA combination with 500 copies/μL of genomic SARS CoV-2 viral RNA was measured in the plate reader (left) and in the mobile phone device (right). (F) The triple crRNA combination with Positive Swab 4 was measured in the plate reader (left) and in the mobile phone device (right).
Figure S4
Figure S4
Limit of detection of the mobile phone device, related to Figure 4 (A) We simulated the signal of mobile phone device for triple crRNA combination with the target viral RNA at 50 copies/μL (red dots) or without the target (RNP alone) (black dots) (see Methods). The red and black lines indicate the linear fit of the simulated signal. (B) For each simulated measurement, we estimated the slope and the 95% confidence interval of the slope and tested whether the slope of the positive sample was significantly larger than the slope of the RNP alone (red line). Similarly, we tested whether the endpoint signal of the positive sample was significantly larger than the endpoint signal of the RNP alone (blue line). By repeating this procedure 1,000 times for different assay times, we estimated the difference in detection accuracy of the two methods. (C) The simulation using the slope analysis in panel (B) was repeated for varying amounts of target viral RNA, and the time where detection accuracy reached 95% was determined.

Comment in

References

    1. Abudayyeh O.O., Gootenberg J.S., Konermann S., Joung J., Slaymaker I.M., Cox D.B., Shmakov S., Makarova K.S., Semenova E., Minakhin L., et al. C2c2 is a single-component programmable RNA-guided RNA-targeting CRISPR effector. Science. 2016;353:aaf5573. - PMC - PubMed
    1. Abudayyeh O.O., Gootenberg J.S., Essletzbichler P., Han S., Joung J., Belanto J.J., Verdine V., Cox D.B.T., Kellner M.J., Regev A., et al. RNA targeting with CRISPR-Cas13. Nature. 2017;550:280–284. - PMC - PubMed
    1. Angus S.V., Cho S., Harshman D.K., Song J.Y., Yoon J.Y. A portable, shock-proof, surface-heated droplet PCR system for Escherichia coli detection. Biosens. Bioelectron. 2015;74:360–368. - PMC - PubMed
    1. Arizti-Sanz J., Freije C.A., Stanton A.C., Boehm C.K., Petros B.A., Siddiqui S., Shaw B.M., Adams G., Kosoko-Thoroddsen T.F., Kemball M.E., et al. Integrated sample inactivation, amplification, and Cas13-based detection of SARS-CoV-2. bioRxiv. 2020 2020.05.28.119131. - PMC - PubMed
    1. Babin S.M., Hsieh Y.H., Rothman R.E., Gaydos C.A. A meta-analysis of point-of-care laboratory tests in the diagnosis of novel 2009 swine-lineage pandemic influenza A (H1N1) Diagn. Microbiol. Infect. Dis. 2011;69:410–418. - PMC - PubMed

Publication types

MeSH terms

Substances