. 2020 Dec 23;183(7):1946-1961.e15.
doi: 10.1016/j.cell.2020.11.019. Epub 2020 Dec 10.

The Identity of Human Tissue-Emigrant CD8+ T Cells

Affiliations

The Identity of Human Tissue-Emigrant CD8+ T Cells

Marcus Buggert et al. Cell. .

Abstract

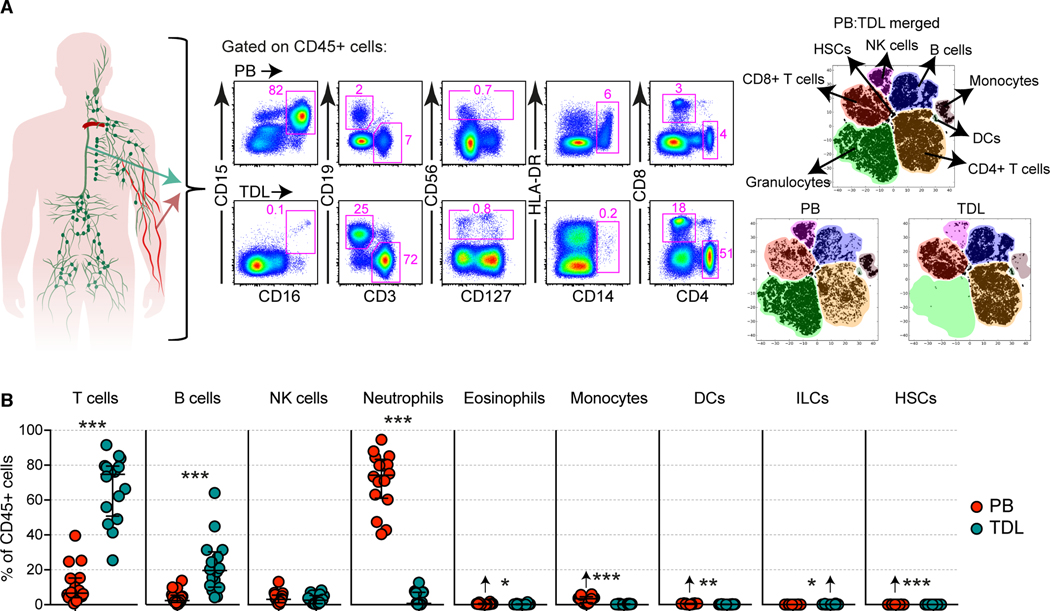
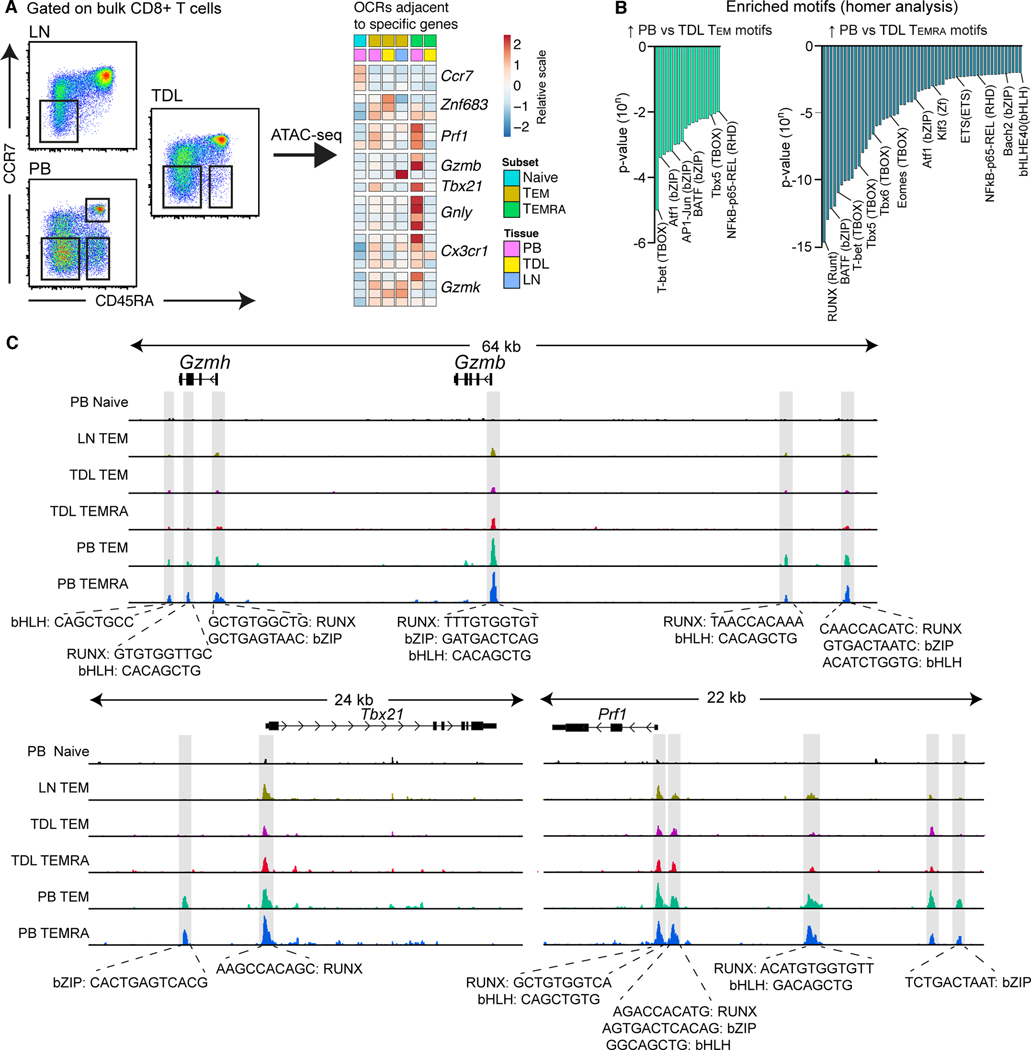
Lymphocyte migration is essential for adaptive immune surveillance. However, our current understanding of this process is rudimentary, because most human studies have been restricted to immunological analyses of blood and various tissues. To address this knowledge gap, we used an integrated approach to characterize tissue-emigrant lineages in thoracic duct lymph (TDL). The most prevalent immune cells in human and non-human primate efferent lymph were T cells. Cytolytic CD8+ T cell subsets with effector-like epigenetic and transcriptional signatures were clonotypically skewed and selectively confined to the intravascular circulation, whereas non-cytolytic CD8+ T cell subsets with stem-like epigenetic and transcriptional signatures predominated in tissues and TDL. Moreover, these anatomically distinct gene expression profiles were recapitulated within individual clonotypes, suggesting parallel differentiation programs independent of the expressed antigen receptor. Our collective dataset provides an atlas of the migratory immune system and defines the nature of tissue-emigrant CD8+ T cells that recirculate via TDL.

Keywords: CD8; cytotoxic; lymphatic; recirculation; thoracic duct.


Conflict of interest statement

Declaration of Interests The authors declare no competing interests.

Figures

Figure 1.
Figure 1.. Immunological atlas of human TDL.
(A) Representative flow cytometry plots with graphic (left) and merged tSNE plots (right) showing the differential immune lineage content of peripheral blood (PB) and TDL. (B) Quantification of immune cell subsets in matched PB and TDL. Arrows indicate higher average values. Data are shown as median ± IQR. Each dot represents one donor. *p < 0.05, **p < 0.01, ***p < 0.001. Paired t-test or Wilcoxon signed-rank test.
Figure 2.
Figure 2.. Highly differentiated CD8+ T cells are uncommon in TDL.
(A) Representative flow cytometry plots (top) and summary graphs (bottom) showing the frequencies of naive and memory CD8+ T cell subsets in matched samples of human peripheral blood (PB) and TDL. Subsets were defined as naive (CCR7+CD45RA+), TCM (CCR7+CD45RA), TEM (CCR7CD45RA), or TEMRA (CCR7CD45RA+). Data are shown as median ± IQR. Each dot represents one donor. *p < 0.05, **p < 0.01, ***p < 0.001. Paired t-test or Wilcoxon signed-rank test. (B) Representative flow cytometry plots (top) and summary graphs (bottom) showing the frequencies of naive and memory CD8+ T cell subsets in matched samples of rhesus macaque PB and TDL. Subsets were defined as naïve (CD28+CD95), TCM (CD28+CD95+), or TEM (CD28CD95+). Data are shown as median ± IQR. Each dot represents one donor. ***p < 0.001. Paired t-test or Wilcoxon signed-rank test. (C) Expression frequencies of various markers on the surface of human memory (non-CCR7hiCD45RAhi) CD8+ T cells in matched samples of PB and TDL. Data are shown as median. Each dot represents one donor. *p < 0.05, ***p < 0.001. Paired t-test or Wilcoxon signed-rank test. (D) Heatmap showing the expression intensity of various markers on the surface of human memory CD8+ T cell subsets in PB, TDL, tonsils, iliac LNs, and mesenteric LNs. Flow cytometry data are z-score-transformed in each row. (E) PCA plot using the dataset in (D) to show the segregation of human naive and memory CD8+ T cell subsets across anatomical locations. (F) PCA plot showing key markers associated with the segregation observed in (E). (G) Merged tSNE plots (left) and flow cytometry plots (right) showing the relative absence of the CD27CD127 subpopulation (red) among CCR7 memory CD8+ T cells in human TDL.
Figure 3.
Figure 3.. Effector memory CD8+ cells exhibit stem-like signatures in TDL.
(A) Representative flow cytometry plot (left) and tSNE plot (right) showing the clustering of transcriptomes from naive and memory CD8+ T cell subsets in PB, TDL, and mesenteric LNs. Each dot represents one donor. (B) Heatmap showing the expression levels of selected genes among CD8+ TEM and TEMRA cells in PB, TDL, and mesenteric LNs. (C) GSEA showing the enrichment of genes associated with cytolytic activity among CD8+ TEM and TEMRA cells in PB and the enrichment of genes associated with stemness among CD8+ TEM and TEMRA cells in TDL. (D) scRNA-seq analysis of memory (non-CCR7hiCD45RAhi) CD8+ T cells in matched samples of PB and TDL (n = 2 donors). Left: UMAP plot illustrating the distribution of naive and memory-like clusters. The associated heatmap shows the enrichment score for each cluster according to previously reported signatures (Cano-Gamez et al., 2020). Right: UMAP plot and summary graph illustrating the distribution of memory CD8+ T cells in PB (red) and TDL (blue). (E) Bubble plot showing the expression of selected genes. Size represents the percentage of cells in each cluster with non-zero expression of each gene, and color represents the average normalized read count for each gene in each cluster. (F) GSEA comparing signatures from the CD8+ TEM-like and TEMRA-like clusters in PB and TDL versus the GO database (Broad Institute). NES, normalized enrichment score. (G) Representative flow cytometry plots (left) and summary graphs (right) showing the coexpression frequency of GzmB and perforin among naive and memory CD8+ T cell subsets in PB and TDL. Data are shown as median ± IQR. Each dot represents one donor. ***p < 0.001. Paired t-test or Wilcoxon signed-rank test. (H) Summary graph showing the expression frequency of TCF-1 among naive and memory CD8+ T cell subsets in PB and TDL (n = 5 donors). Data are shown as median ± IQR. *p < 0.05. Paired t-test or Wilcoxon signed-rank test. (I) Representative flow cytometry plots (left) and summary graphs (right) showing the expression frequencies of Eomes and T-bet among naive and memory CD8+ T cell subsets in PB and TDL. Data are shown as median ± IQR. Each dot represents one donor. **p < 0.01, ***p < 0.001. Paired t-test or Wilcoxon signed-rank test. (J) Top: cytolytic activity of CD8+ T cells isolated from PB versus TDL (n = 5 donors). Redirected killing was quantified at different effectorto-target (E:T) ratios against sensitized mastocytoma cells (P815). Data are shown as median ± IQR. **p < 0.01. Wilcoxon signed-rank test. Bottom: correlation between cytolytic activity and the coexpression frequency of GzmB and perforin among memory CD8+ T cells in PB and TDL. Each dot represents one donor. Spearman rank correlation. (K) Representative flow cytometry plots (left) and summary graphs (right) showing chemokine/cytokine production and the expression of GzmB and perforin among naive and memory CD8+ T cell subsets in PB and TDL after stimulation with PMA and ionomycin (n = 6 donors). Data are shown as median ± IQR. *p < 0.05, **p < 0.01, ***p < 0.001. Paired t-test or Wilcoxon signed-rank test. Functional profiles were compared using the permutation test in Simplified Presentation of Incredibly Complex Evaluations (SPICE).
Figure 4.
Figure 4.. Effector memory CD8+ T cells are epigenetically distinct in blood and TDL.
(A) Flow cytometric gating strategy for cell sorting (left) and heat map based on the corresponding ATAC-seq data (right) showing open chromatin regions (OCR) adjacent to specific early- and late-differentiated genes for CD8+ naïve, TEM and TEMRA cells in PB, TDL, and mesenteric LNs. (B) Transcription factor motifs enriched among CD8+ TEM (left) and TEMRA cells (right) in PB versus TDL. (C) ATAC-seq tracks for the Gzmh, Gzmb, Tbx21, and Prf1 loci among naive and memory CD8+ T cell subsets in PB, TDL, and mesenteric LNs.
Figure 5.
Figure 5.. Cytolytic and non-cytolytic CD8+ T cells are clonotypically divergent.
(A) Representative flow cytometry plots (left) and scatter graph (right) showing the expression frequencies of GzmB and perforin versus CX3CR1 among memory CD8+ T cells. Each dot represents one donor. Spearman rank correlation. (B) Flow cytometric gating strategy for sorting memory CD8+ T cell subsets based on the expression of CCR7 and CX3CR1. (C) TCRβ repertoire diversity calculated for each memory CD8+ T cell subset using normalized Shannon entropy. Data are shown as median ± IQR. Each dot represents one donor. **p < 0.01. Mann-Whitney U test. (D) Representative clonotype frequency correlations among memory CD8+ T cell subsets in PB and TDL. Each dot represents one unique TCRβ sequence. (E) Bubble plot showing pairwise comparisons of clonotype similarity among CD8+ T cell subsets in PB and TDL (n = 4 donors). (F) Circos plots illustrating the distribution of clonotypes among CD8+ T cell subsets in PB and TDL (n = 4 donors).
Figure 6.
Figure 6.. Cytolytic CD8+ T cells are selectively retained in the intravascular circulation.
(A) Representative flow cytometry plots (left) and summary graph (right) showing the coexpression frequencies of GzmB and perforin among memory CD8+ T cells in PB, LTs, and NLTs. Data are shown as median ± IQR. Each dot represents one donor. (B) Representative flow cytometry plots (left) and summary graph (right) showing the expression frequencies of CCR7 and CD69 among memory CD8+ T cells in LTs and NLTs (n = 15 donors). Data are shown as median ± IQR. *p < 0.05. Paired t-test or Wilcoxon signed-rank test. (C) Representative flow cytometry plot (top) and summary graph (bottom) showing the expression frequencies of CD27 and CX3CR1 among non-resident CD8+ TEM cells (CD69) in endometrial tissue (n = 4 donors). Data are shown as median ± IQR. (D) Schematic representation of the fingolimod (FTY-720) study. Blood samples were drawn before, 1 month after (1M), and 6 months after (6M) the initiation of FTY-720. (E) Representative flow cytometry plots (left) and summary graphs (right) showing the frequencies (left) and absolute numbers (right) of naive and memory CD8+ T cells over the course of the study. Combined data are shown as median ± IQR. Individual gray lines are shown for each donor. (F) Representative flow cytometry plots (left) and summary graphs (right) showing the frequencies (left) and absolute numbers (right) of cytolytic CD8+ T cells (GzmB+perforin+) over the course of the study. Combined data are shown as median ± IQR. Individual gray lines are shown for each donor. (G) Functional profiles of memory CD8+ T cells in response to stimulation with PMA and ionomycin before and 6 months after the initiation of FTY-720 (n = 6 donors). Data are shown as median ± IQR. *p < 0.05. Paired t-test or Wilcoxon signed-rank test. (H) Representative flow cytometry plots (left) and summary graphs (center) showing the persistence of intravascular cytolytic CD8+ T cells (CCR7CD27CX3CR1+) after the initiation of FTY-720 (n = 6 donors). Data are shown as median ± IQR. Right: correlations between the absolute numbers of intravascular cytolytic (CCR7CD27CX3CR1+) and non-cytolytic CD8+ T cells (CCR7CD27+CX3CR1) before and 6 months after the initiation of FTY-720. Each dot represents one donor. Spearman rank correlation. (I) Expression frequencies of various trafficking receptors among cytolytic (CCR7CD27CX3CR1+) and non-cytolytic effector memory CD8+ T cells (CCR7CD27+CX3CR1) in healthy donor PBMCs. Data are shown as median. Each dot represents one donor. *p < 0.05, ***p < 0.001. Paired t-test or Wilcoxon signed-rank test. NS, non-significant.
Figure 7.
Figure 7.. Virus-specific CD8+ T cells rarely express cytolytic molecules in TDL.
(A) MHC class I tetramer-based quantification of virus-specific CD8+ T cells in PB and TDL (shown as ratios). Data are shown as median ± IQR. Each dot represents one specificity. (B) Representative flow cytometry plots (left) and summary graphs (right) showing the coexpression frequency of GzmB and perforin among virus-specific CD8+ T cells in PB and TDL. Each dot represents one specificity in one donor. ***p < 0.001. Paired t-test or Wilcoxon signed-rank test. (C) Top: representative flow cytometry plots showing the expression of CD27 and GzmB among CMV-specific CD8+ T cells in PB and TDL. Bottom: correlation between the coexpression frequency of GzmB and perforin and the relative frequency of virus-specific CD8+ T cells in PB versus TDL. Each dot represents one specificity in one donor. Spearman rank correlation. (D) Representative flow cytometry plots (left) and summary graphs (right) showing the expression frequencies of Eomes and T-bet among virus-specific CD8+ T cells in PB and TDL. Each dot represents one specificity in one donor. **p < 0.01. Paired t-test or Wilcoxon signed-rank test. (E) Clonotype distribution among virus-specific CD8+ T cells in PB and TDL. The number in each circle indicates the total number of sorted cells used to generate the displayed sequences. Population frequencies are shown in the corresponding flow cytometry plots (left). (F) Top left: volcano plots comparing single-cell gene expression for one CMV-specific CD8+ T cell clonotype in PB versus TDL (n = 1 donor). Top right and bottom: violin plots showing differential expression of immune-related genes for the same CMV-specific CD8+ T cell clonotype in PB versus TDL. Each dot represents one cell. (G) scRNA-seq heatmap showing average gene expression intensities for matched HIV-specific CD8+ T cell clonotypes (n = 3) in PB versus TDL (n = 2 donors).

References

    1. Appay V, Nixon DF, Donahoe SM, Gillespie GM, Dong T, King A, Ogg GS, Spiegel HM, Conlon C, Spina CA, et al. (2000). HIV-specific CD8(+) T cells produce antiviral cytokines but are impaired in cytolytic function. J Exp Med 192, 63–75. - PMC - PubMed
    1. Bartolome-Casado R, Landsverk OJB, Chauhan SK, Richter L, Phung D, Greiff V, Risnes LF, Yao Y, Neumann RS, Yaqub S, et al. (2019). Resident memory CD8 T cells persist for years in human small intestine. J Exp Med. - PMC - PubMed
    1. Beura LK, Hamilton SE, Bi K, Schenkel JM, Odumade OA, Casey KA, Thompson EA, Fraser KA, Rosato PC, Filali-Mouhim A, et al. (2016). Normalizing the environment recapitulates adult human immune traits in laboratory mice. Nature 532, 512–516. - PMC - PubMed
    1. Boritz EA, Darko S, Swaszek L, Wolf G, Wells D, Wu X, Henry AR, Laboune F, Hu J, Ambrozak D, et al. (2016). Multiple Origins of Virus Persistence during Natural Control of HIV Infection. Cell 166, 1004–1015. - PMC - PubMed
    1. Boschetti G, Nancey S, Moussata D, Cotte E, Francois Y, Flourie B, and Kaiserlian D. (2016). Enrichment of Circulating and Mucosal Cytotoxic CD8+ T Cells Is Associated with Postoperative Endoscopic Recurrence in Patients with Crohn’s Disease. J Crohns Colitis 10, 338–345. - PMC - PubMed

Publication types