. 2021 Feb 2;33(2):411-423.e4.
doi: 10.1016/j.cmet.2020.11.016. Epub 2020 Dec 10.

Neutrophils Fuel Effective Immune Responses through Gluconeogenesis and Glycogenesis

Affiliations

Neutrophils Fuel Effective Immune Responses through Gluconeogenesis and Glycogenesis

Pranvera Sadiku et al. Cell Metab. .

Erratum in

  • Neutrophils fuel effective immune responses through gluconeogenesis and glycogenesis.
    Sadiku P, Willson JA, Ryan EM, Sammut D, Coelho P, Watts ER, Grecian R, Young JM, Bewley M, Arienti S, Mirchandani AS, Sanchez Garcia MA, Morrison T, Zhang A, Reyes L, Griessler T, Jheeta P, Paterson GG, Graham CJ, Thomson JP, Baillie K, Thompson AAR, Morgan JM, Acosta-Sanchez A, Dardé VM, Duran J, Guinovart JJ, Rodriguez-Blanco G, Von Kriegsheim A, Meehan RR, Mazzone M, Dockrell DH, Ghesquiere B, Carmeliet P, Whyte MKB, Walmsley SR. Sadiku P, et al. Cell Metab. 2021 May 4;33(5):1062-1064. doi: 10.1016/j.cmet.2021.03.018. Cell Metab. 2021. PMID: 33951466 Free PMC article. No abstract available.

Abstract

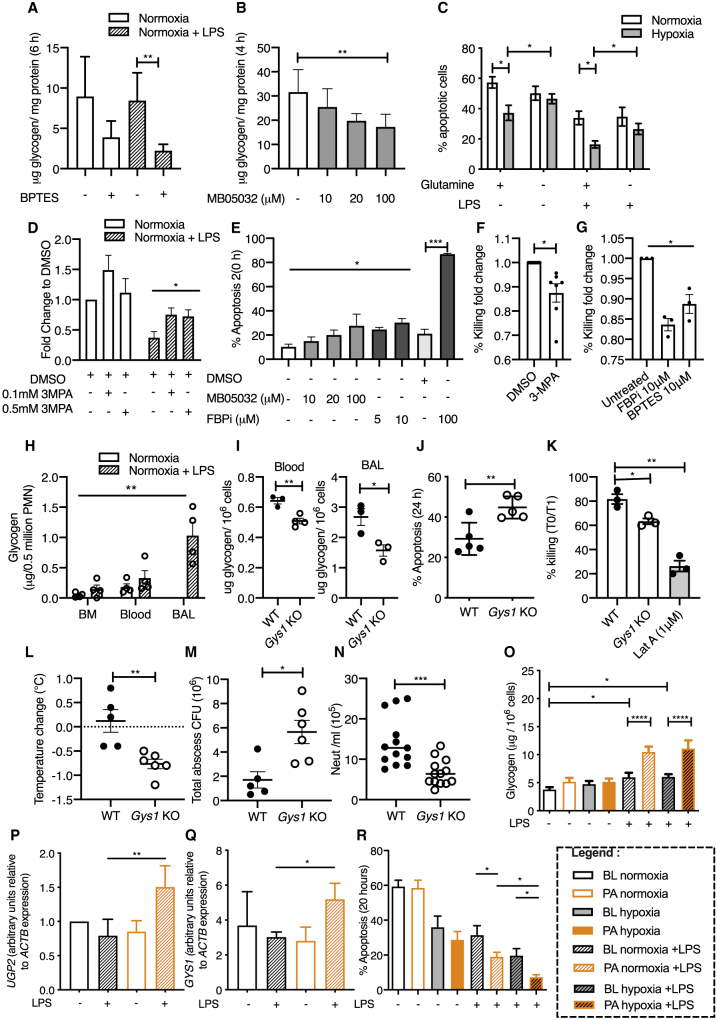
Neutrophils can function and survive in injured and infected tissues, where oxygen and metabolic substrates are limited. Using radioactive flux assays and LC-MS tracing with U-13C glucose, glutamine, and pyruvate, we observe that neutrophils require the generation of intracellular glycogen stores by gluconeogenesis and glycogenesis for effective survival and bacterial killing. These metabolic adaptations are dynamic, with net increases in glycogen stores observed following LPS challenge or altitude-induced hypoxia. Neutrophils from patients with chronic obstructive pulmonary disease have reduced glycogen cycling, resulting in impaired function. Metabolic specialization of neutrophils may therefore underpin disease pathology and allow selective therapeutic targeting.

Keywords: COPD; GYS1; gluconeogenesis; glycogen; glycogenesis; glycogenolysis; glycolysis; inflammation; neutrophil.


Conflict of interest statement

Declaration of Interests The authors declare no competing interests.

Figures

None
Graphical abstract
Figure 1
Figure 1
Neutrophil Stimulation Results in Upregulated Glycolytic and PPP Activity, Redox Buffer Capacity, and Glutamine Utilization (A–C) Radioactive flux assay analysis of human neutrophils following 6 h of culture showing glycolysis (A), TCA/PPP cycle (B), and fatty acid oxidation (FAO) (C) in unstimulated and stimulated neutrophils under normoxic (N, 21% O2, white bar) and hypoxic (H, 1% O2, gray bar) culture. (A) N and N + LPS, n = 12; N + 2-DG, n = 6; N + LPS + 2-DG, n = 4; H and H + LPS, n = 11; H + 2-DG, n = 5; H + LPS + 2-DG, n = 3. (B) n = 4 for all conditions. (C) N and N + LPS, n = 6; H and H + LPS, n = 5; N + etomoxir and H + etomoxir, n = 3. (D) A pathway diagram showing the metabolites measured in human neutrophils following 6 h of culture in normoxia and hypoxia in the presence or absence of LPS stimulation. (E–L) LC-MS analyses of the neutrophil intracellular abundance of glycolytic metabolites (glucose-6-phosphate/fructose-6-phosphate, G6P/F6P; dihydroxyacetone phosphate, DHAP; glyceradehyde-3-phosphate, GAP; lactate), pentose phosphate pathway metabolites (PPP; ribose-5-phosphate/xylulose-5-phosphate, R5P/X5P; sedoheptulose-7-phosphate, S7P), and redox buffers (NADPH and NADH). n = 3. (M and N) LC-MS time course analyses of the neutrophil intracellular levels of amino acid glutamine (M; n = 3) and percentage heavy labeled glutamate (N; n = 3) following culture with U-13C glutamine. Data represent mean ± SEM. p values obtained via unpaired t tests (A–C), paired t tests (D–L), or two-way ANOVA with Tukey’s multiple comparisons test; overall significance shown for increase in labeled glutamate from 2 to 6 h (N). p < 0.05, ∗∗p < 0.01, ∗∗∗p < 0.005, ∗∗∗∗p < 0.001.
Figure 2
Figure 2
Neutrophil ATP Is Predominantly Generated by Glycolysis with Maintenance of Energy Charge during Neutrophil Lifespan and in a Glucose-Deplete Setting (A and B) ATP contribution of fatty acid oxidation (FAO), tricarboxylic acid cycle (TCA), and glycolysis were derived from calculation from the radioactive flux assays comparing normoxia to hypoxia (A) and unstimulated to LPS-stimulated neutrophils following 6 h of culture (B). Normoxia, FAO, n = 6; TCA, n = 3; glycolysis, n = 9; hypoxia, FAO, n = 4; TCA, n = 3; glycolysis, n = 8: normoxia + LPS, FAO, n = 6; TCA, n = 3; glycolysis, n = 9. (C–E) Energy status measurement (ATP/ADP) of neutrophils cultured for 2 h in the presence and absence of pathway inhibitors 10 mM 2-DG (C; n = 4), 1.2 μM oligomycin A (D; n = 3), and 10 μM etomoxir (E; n = 3). (F and G) Energy charge measurement ([ATP + 1/2ADP]/[ATP + ADP + AMP]) in neutrophils cultured for 2, 6, and 20 h in normoxia and hypoxia (F) and for 12 h in glucose-replete and -deplete medium in unstimulated and LPS-stimulated cells (G). (F) normoxia + LPS-glucose, n = 4; hypoxia + glucose, n = 3. (G) n = 3. Data represent mean ± SEM. p values obtained via unpaired t test (A and B) or paired t test (C). p < 0.05, ∗∗p < 0.01, ∗∗∗p < 0.005, ∗∗∗∗p < 0.001.
Figure 3
Figure 3
Regulation of Glycogen Stores and Gluconeogenesis Pathway Activity during Human Neutrophil Activation (A) Glycogen level quantification in freshly isolated neutrophils (0 h) and following 6 h of culture in glucose-deplete and -replete media under normoxia and hypoxia. n = 4. (B) Glycogen content of neutrophils following 6 h of normoxic culture with the glycogen phosphorylase inhibitor CP-91149 preventing glycogen breakdown. n = 4. (C) Assessment of apoptosis rates using flow cytometry following culture in glucose-deprived media under normoxia and hypoxia with CP-91149 and LPS for 12 h. n = 5. (D and E) Liquid scintillation count measurement of radioactive U-14C glucose (D; n = 4) and U-14C lactate (E; n = 5) incorporation into neutrophil glycogen stores following 6 h of culture. (F) Transcript expression of glycogen metabolism and gluconeogenesis machinery: muscle glycogen synthase (GYS1, n = 4), glycogen branching enzyme (GBE1, n = 4), UDP-glucose pyrophosphorylase 2 (UGP2, n = 3), liver glycogen phosphorylase (PYGL, n = 4), fructose-1,6-bisphosphatase 1 (FBP1, n = 4), and phosphoenolpyruvate carboxykinase 2 (PEPCK2, n = 4). (G) Protein expression of glycogen metabolism and gluconeogenesis machinery in freshly isolated neutrophils (0 h) and neutrophils cultured for 6 or 20 h. Positive controls for FBP1 and PEPCK2− MCF7 lysate, PYGL− mouse liver lysate, phospho-GYS (p-GYS), and GYS− NIH/3T3 cell lysate. Representative western blots are shown. n = 3. (H) Diagrammatic representation of U-13C glucose (black circles) and U-13C glutamine (gray circles) labeling in human neutrophils. GNG, gluconeogenesis. (I) G6P/F6P isotopologue abundance following culture in U-13C glucose media for 4 h under conditions of normoxia, normoxia with LPS, and hypoxia. n = 4. (J–L) 13C percentage labeling of glycolytic intermediaries (J; n = 4) and isotopologue labeling of TCA cycle and glycolytic intermediaries (K and L; n = 4) following 4 h of culture in U-13C glutamine containing media. (M) Percentage heavy labeling of G6P/F6P following 4 h of culture in the presence of U-13C palmitic acid. n = 4. (N) Schematic diagram and relative abundance of glucose m+3 isotopologue following U-13C pyruvate tracing in neutrophils derived by LC-MS analysis of hydrolyzed glycogen. n = 4. Data represent mean ± SEM. Statistical significance was determined by paired t tests (A, B, and D) or two-way ANOVA with Tukey’s multiple comparisons test (C and J–L) and a one-way ANOVA with Tukey’s multiple comparisons test (N). p < 0.05, ∗∗p < 0.01, ∗∗∗p < 0.005. (J) Significance shown for unstimulated versus LPS stimulated cells across all isotopologues.
Figure 4
Figure 4
Glycogen Storage Capacity Dictates Neutrophil Function and Survival in Gys1loxloxMRP8-cre+/− Mice and Healthy Human Volunteers Exposed to Altitude-Induced Hypoxia (A and B) Neutrophil glycogen content following 6 (A) or 4 h (B) normoxic culture in glucose-deplete media with the glutaminase inhibitor BPTES preventing glutamine breakdown (A; n = 4) and the gluconeogenesis inhibitor MB05032 (B; n = 3). (C–E) Assessment of apoptosis rates using flow cytometry (C) and cellular morphology (D and E) following culture in glutamine-deprived (C) or glucose-deplete media (D and E) under conditions of normoxia and hypoxia ± LPS for 6 (D) and 20 h (C). Data shown as mean ± SEM (C and D) and fold change from DMSO vehicle control. n = 4. (F and G) Neutrophils were challenged with S. aureus (SH1000) at a multiplicity of infection (MOI) of 10 and bacterial killing assessed by flow cytometry. Data shown as fold change from DMSO (F; n = 7) and untreated (G; n = 3) controls. (H) Glycogen content of neutrophils in the bone marrow, blood, and bronchoalveolar lavage (BAL) of untreated and 24 h post-LPS challenge of wild-type mice (WT). n = 3. (I) Glycogen content of circulating and BAL neutrophils of WT and Gys1 knockout mice. n = 3. (J) Assessment of apoptosis rates using flow cytometry following 24 h of culture under standard media conditions. n = 5. (K) In vitro challenge of BAL neutrophils with S. aureus (SH1000) (MOI:10) and bacterial killing assessed by flow cytometry. n = 3. (L–N) Gys1lox/lox MRP8-Cre+/− knockout (GYS1 KO) and Gys1lox/lox MRP8-Cre−/− WT mice were inoculated with 5 × 107 CFU of S. aureus (SH1000) and rectal temperatures (L), total abscess CFU counts (M), and blood neutrophil counts (N) obtained 24 h post-subcutaneous infection. (O–R) Intracellular glycogen levels (O; n = 6), UGP2 (P; n = 8) and GYS1 (Q; n = 7) relative transcript abundance, and apoptosis rates (R; n = 8) were measured in blood neutrophils isolated from healthy human volunteers at baseline (BL) and 3 months post-altitude-induced hypoxia (PA), following culture ex vivo with LPS and hypoxia. Data represent mean ± SEM. Statistical significance was determined by paired t tests (A, B, D–F, K, P, and Q), two-way ANOVA with Sidak’s multiple comparisons test (C, O, and R), one-way ANOVA with Tukey’s multiple comparisons test (C, G, and H), and unpaired t tests (I, J, and L–N). p < 0.05, ∗∗p < 0.01, ∗∗∗p < 0.005, ∗∗∗∗p < 0.001.
Figure 5
Figure 5
COPD Peripheral Blood Neutrophils Are Unable to Regulate Their Glycogen Synthesis, Resulting in Diminished Intracellular Glycogen Stores, Defective Bacterial Killing, and Survival (A–C) Neutrophils from healthy control subjects (HC; open black circle) or patients with COPD (COPD; open blue square) were challenged with either opsonized serotype 14 Streptococcus pneumoniae (S14) (A; n = 7) or Staphylococcus aureus (SH1000) (B; n = 4), at a multiplicity of infection (MOI) of 10 and bacterial killing assessed. Assessment of apoptosis by annexin V/TO-PRO-3 staining of HC and COPD neutrophils following 20 h culture (C; n = 6). (D) Relative of ATP abundance of freshly isolated neutrophils from HC and COPD using RP-HPLC (reversed-phase high-performance liquid chromatography). HC, n = 4; COPD, n = 6. (E and F) Seahorse quantification of ECAR of healthy and COPD peripheral blood neutrophils exposed to SH1000 at an MOI of 10, 25, and 50. n = 4. (G) U-13C glucose incorporation into glucose-6-phosphate/fructose-6-phosphate (G6P/F6P) following 4 h of culture in U-13C glucose containing media under normoxia in the presence (filled symbol) and absence (open symbol) of LPS. n = 5. (H) Glycogen content of HC and COPD neutrophils cultured in glucose-replete and glucose-deplete media for 6 h in the presence and absence of LPS. n = 7. (I and J) Relative transcript abundance of the gluconeogenic gene PEPCK2 (I; n = 7, unstimulated; n = 9, LPS) and glycogen synthesis pathway gene GBE1 (J; n = 7) in HC and COPD neutrophils cultured for 6 h in the presence and absence of LPS normalized to β-actin expression. (K–Q) Healthy control and COPD peripheral blood neutrophils were cultured in U-13C glucose containing media for 4 h under normoxia in the presence and absence of LPS. Total intracellular lactate (K; n = 5), medium lactate (L; n = 5), ribose5P/xylulose5P (M; n = 5), sedoheptulose7P (N; n = 5), NADH (O; n = 4), UDP-glucose (P; n = 5), and UDP-GlcNAc (Q; n = 5) were measured using LC-MS and normalized to protein content. Fold change was determined relative to the paired unstimulated HC control (M). (R) Healthy control and COPD peripheral blood neutrophils were cultured in U-13C glutamine containing media for 4 h under normoxia and total labeled F1,6BP measured using LC-MS. n = 6. Data are expressed as individual data points with mean ± SEM. Statistical significance was determined by paired t tests (A–D and H–R) or two-way ANOVA with Sidak’s multiple comparisons test (E and F). p < 0.05, ∗∗p < 0.01.
Figure 6
Figure 6
A Summary of the Observed Metabolic States of Quiescent, LPS Stimulated, and COPD Neutrophils A diagram showing the metabolic states of resting (A), stimulated (B), and COPD (C) neutrophils showing increased glycolytic activity and glycogen synthesis in response to LPS and defective glycogen cycling and glycolysis in COPD. Genes identified to actively regulate neutrophil glucose transport (Glut1), gluconeogenesis (GNG) (Fbp1 and Pck2), glycogenesis (Gys1, Gbe1, and Ugp2), and glycogenolysis (Pygl) are highlighted in red. Arrow thickness indicates the relative flux through metabolic pathways with glycogenolysis and glucose oxidation highlighted in blue and glycogenesis and gluconeogenesis in green.

References

    1. Bender J.G., Van Epps D.E. Inhibition of human neutrophil function by 6-aminonicotinamide: the role of the hexose monophosphate shunt in cell activation. Immunopharmacology. 1985;10:191–199. - PubMed
    1. Borregaard N., Herlin T. Energy metabolism of human neutrophils during phagocytosis. J. Clin. Invest. 1982;70:550–557. - PMC - PubMed
    1. Boxer L.A., Baehner R.L., Davis J. The effect of 2-deoxyglucose on guinea pig polymorphonuclear leukocyte phagocytosis. J. Cell. Physiol. 1977;91:89–102. - PubMed
    1. Cheung Y.Y., Kim S.Y., Yiu W.H., Pan C.-J., Jun H.-S., Ruef R.A., Lee E.J., Westphal H., Mansfield B.C., Chou J.Y. Impaired neutrophil activity and increased susceptibility to bacterial infection in mice lacking glucose-6-phosphatase-β. J. Clin. Invest. 2007;117:784–793. - PMC - PubMed
    1. De Bock K., Georgiadou M., Schoors S., Kuchnio A., Wong B.W., Cantelmo A.R., Quaegebeur A., Ghesquière B., Cauwenberghs S., Eelen G. Role of PFKFB3-driven glycolysis in vessel sprouting. Cell. 2013;154:651–663. - PubMed

Publication types