. 2021 Jan 12;16(1):134-148.
doi: 10.1016/j.stemcr.2020.11.007. Epub 2020 Dec 10.

The miR-199a/214 Cluster Controls Nephrogenesis and Vascularization in a Human Embryonic Stem Cell Model

Affiliations

The miR-199a/214 Cluster Controls Nephrogenesis and Vascularization in a Human Embryonic Stem Cell Model

Ioannis Bantounas et al. Stem Cell Reports. .

Abstract

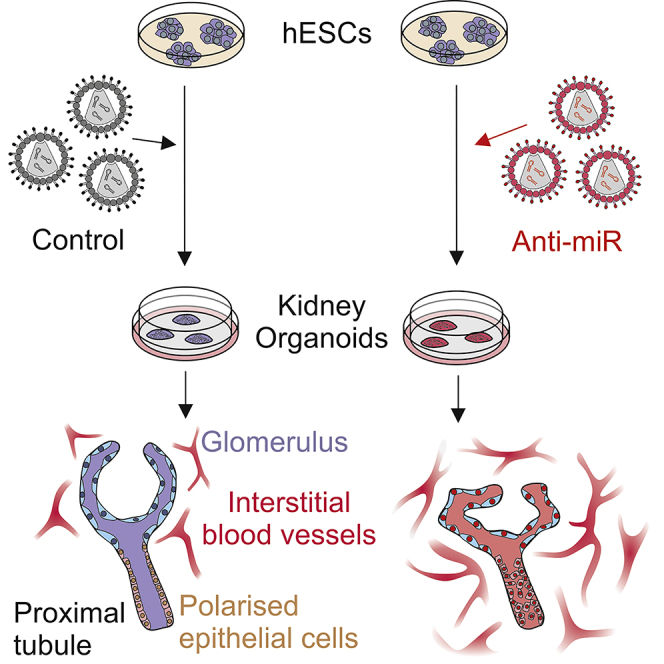
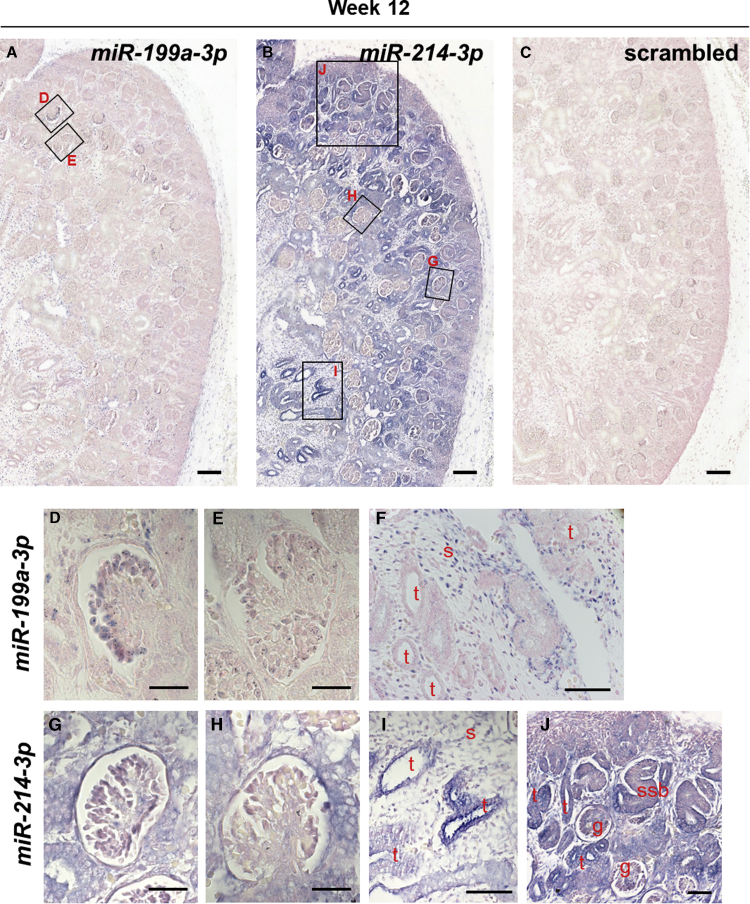
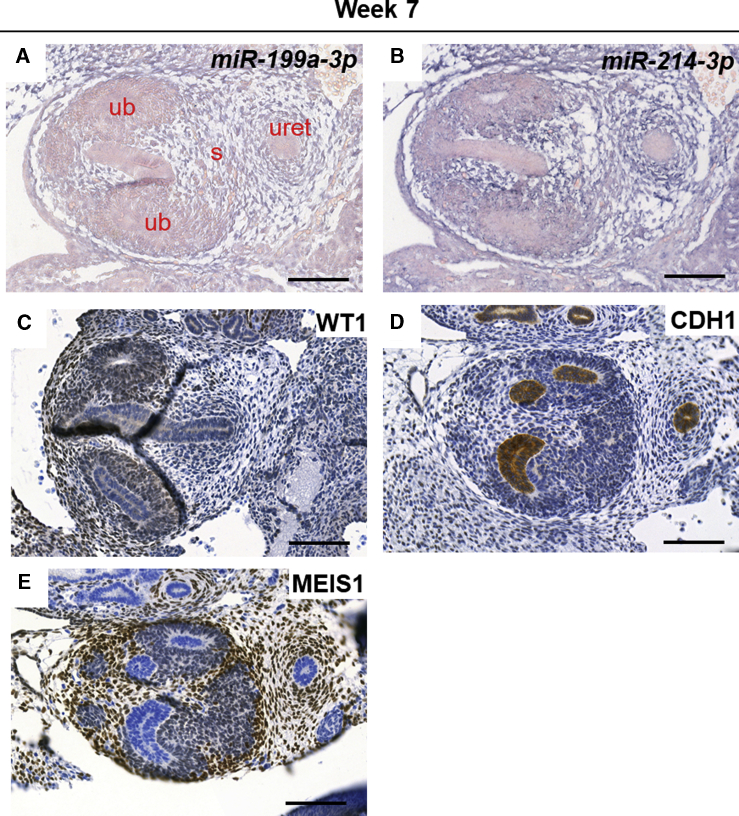
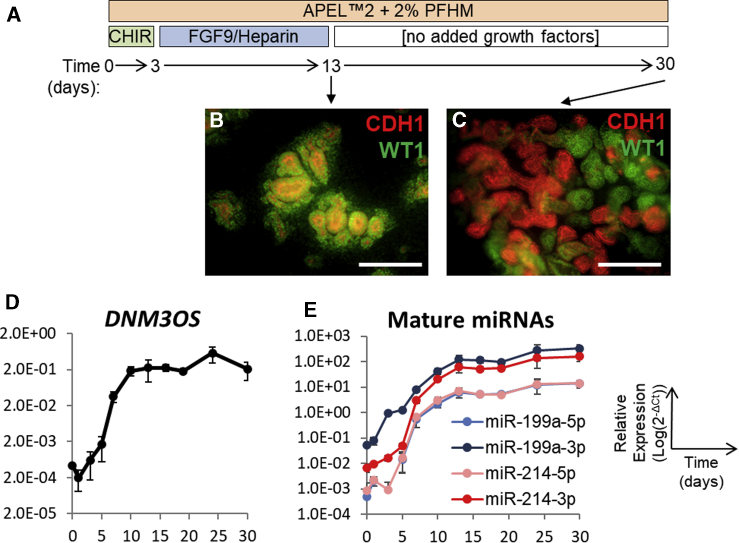
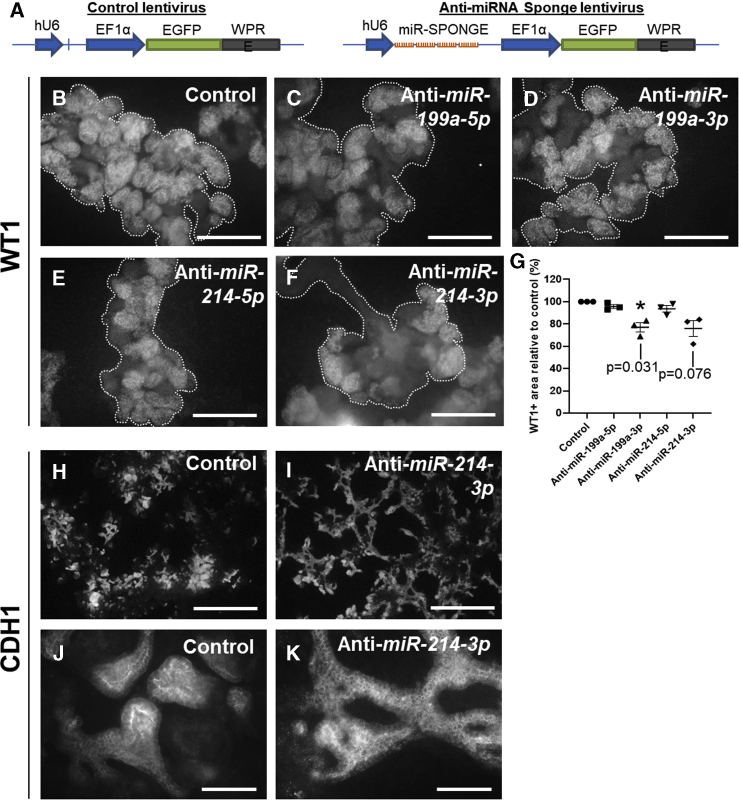
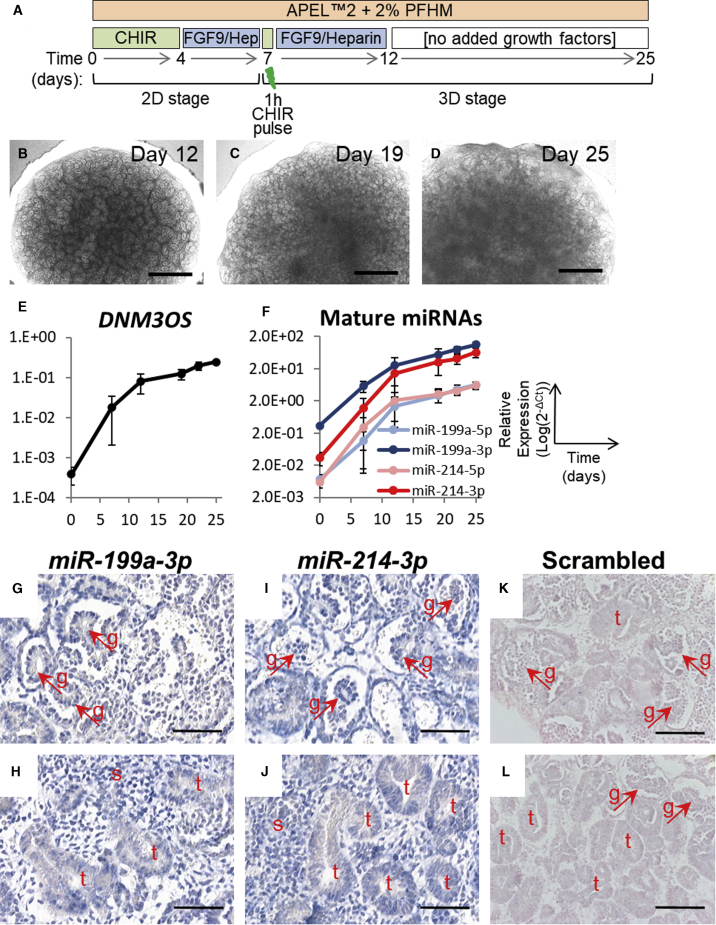
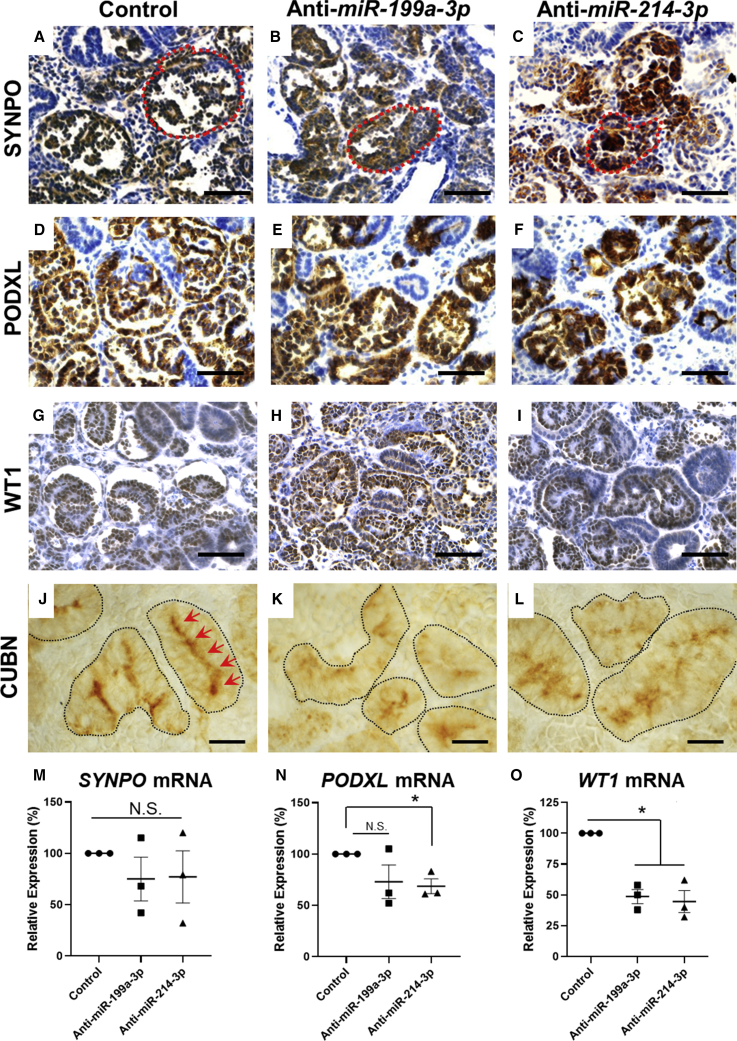
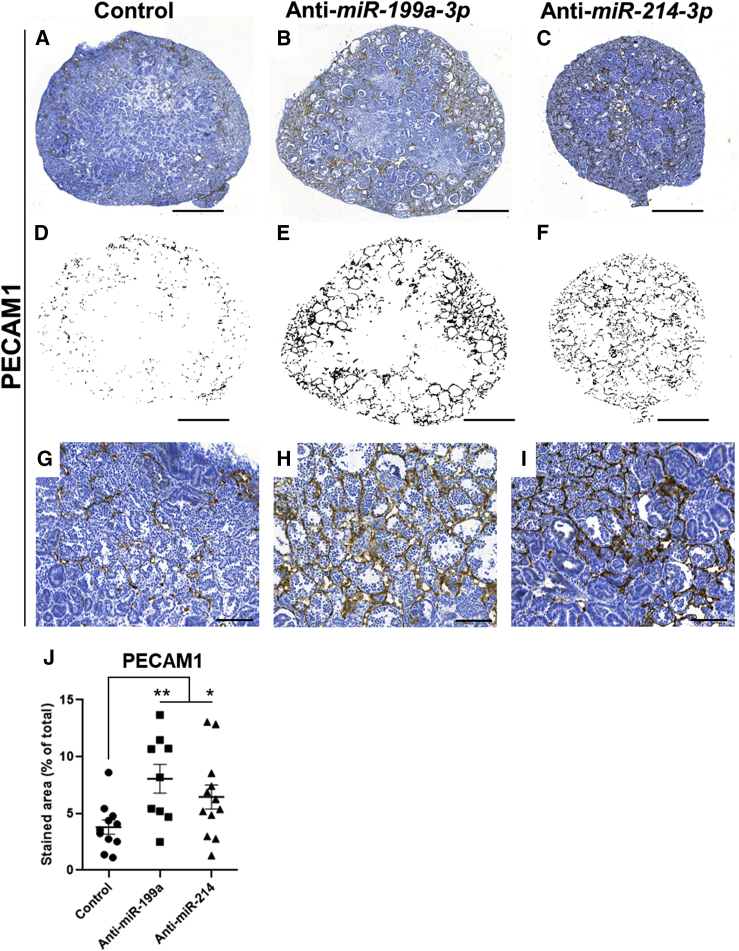
MicroRNAs (miRNAs) are gene expression regulators and they have been implicated in acquired kidney diseases and in renal development, mostly through animal studies. We hypothesized that the miR-199a/214 cluster regulates human kidney development. We detected its expression in human embryonic kidneys by in situ hybridization. To mechanistically study the cluster, we used 2D and 3D human embryonic stem cell (hESC) models of kidney development. After confirming expression in each model, we inhibited the miRNAs using lentivirally transduced miRNA sponges. This reduced the WT1+ metanephric mesenchyme domain in 2D cultures. Sponges did not prevent the formation of 3D kidney-like organoids. These organoids, however, contained dysmorphic glomeruli, downregulated WT1, aberrant proximal tubules, and increased interstitial capillaries. Thus, the miR-199a/214 cluster fine-tunes differentiation of both metanephric mesenchymal-derived nephrons and kidney endothelia. While clinical implications require further study, it is noted that patients with heterozygous deletions encompassing this miRNA locus can have malformed kidneys.

Keywords: development; human pluripotent stem cells; kidney; miR-199a; miR-214; microRNA; organoids.


Figures

None
Graphical abstract
Figure 1
Figure 1
In Situ Hybridization for the miR-199a/214 Cluster in Human Embryonic Kidney at Week 12 of Gestation (A–C) Low-magnification images showing part of the cortical region of week 12 human embryonic kidney sections probed with a miR-199a-3p, miR-214-3p, or scrambled control probe. Squares show the positions of the high-magnification images in (D, E, and G–J). (D–F) MiR-199a-3p was present in outer cortical, maturing (D), but not in more mature, deeper layer (E) glomeruli, and was also present in interstitial cells (F). (G–I) MiR-214-3p was also present in early maturing (G) but not more mature (H) glomeruli and was additionally expressed in interstitial cells and some tubules (I). (J) Higher-magnification view of the nephrogenic zone showing strong miR-214-3p expression. Scale bars, 100 μm (A–C); 50 μm (D, E, G, H); 200 μm (F, I); and 40 μm (J). t, tubule; s, stroma; g, glomerulus; ssb, S-shaped body. Stained areas appear purple, over Nuclear Fast Red (pink) counterstain.
Figure 2
Figure 2
Expression of Members of the miR-199a/214 Cluster in Human Embryonic Kidney at Week 7 of Gestation (A and B) In situ hybridization with LNA probes against miR-199a-3p and miR-214-3p, revealing expression of both miRNAs mainly in the stroma. Stained areas appear purple, over Nuclear Fast Red (pink) counterstain. (C–E) Sections of week 7 human embryonic kidneys were stained for different lineage markers (WT1 for MM; CDH1 for tubules; MEIS1 for stroma). Scale bars, 100 μm. s, stroma; ub, ureteric bud tip; uret, ureter. Stained areas are brown, over hematoxylin (blue) counterstain.
Figure 3
Figure 3
Expression of the miR-199a/214 Cluster in MAN13 hESC Cultures Differentiating to Kidney in 2D (A) Schematic representation of the 2D differentiation protocol. (B and C) 2D cultures immunostained for CDH1 and WT1 at day 13 (B) and day 30 (C) of the differentiation protocol, showing the eventual separation of CDH1+ (epithelial cells) and WT1+ (MM) to discrete areas of the developing structures. Scale bars, 120 μm. (D and E) Time course of the primary transcript (D) and mature miRNAs (E) of the miR-199a/214 cluster during 2D differentiation, assessed by qPCR (mean ± SEM; n = 3 independent differentiation experiments). See also Figure S1.
Figure 4
Figure 4
Inhibition of Members of the miR-199a/214 Cluster by miRNA Sponges in Differentiating 2D Cultures MAN13 hESCs transduced either with control (EGFP-only) lentiviral vectors or with vectors expressing “sponge” inhibitors against miR-199a-5p, miR199a-3p, miR-214-5p, or miR-214-3p schematically shown in (A) were differentiated in 2D and immunostained with WT1 or CDH1 antibodies at the end (day 30) of the protocol. (B–G) Inhibition of miR-199a-3p caused a significant decrease in the extent of the WT1+-stained area (MM) within developing cell aggregates (examples outlined) in differentiating cultures. Quantified in (G): mean ± SEM; n = 3 independent differentiation experiments; p < 0.05, one-sample t test; individual p values are also shown for anti-miR-199a-3p and anti-miR-214-3p). Scale bars, 120 μm. (H and I) Low-magnification images showing that inhibition of miR-214-3p results in more elongated epithelial structures (CDH1+) in the cultures. Scale bars, 600 μm. (J and K) Examples of individual CDH1+ tubules showing normal (control) versus elongated (anti-miR-214-3p) phenotype. Scale bars, 60 μm. See also Figures S2 and S3.
Figure 5
Figure 5
Endogenous Expression of miR199a/214 Cluster Members during Differentiation of MAN13 hESC-Derived 3D Kidney Organoids (A) Schematic representation of the differentiation protocol. On day 7, the cells are pelleted and transferred to Transwell membranes to continue developing as 3D organoids. (B–D) Phase contrast images showing the development of the organoids during the 3D part of the differentiation protocol; clear morphogenesis is visible in the periphery of the organoids. Scale bars, 600 μm. (E and F) Time course of the primary transcript (D) and mature miRNAs (E) of the miR-199a/214 cluster during 3D organoid differentiation, assessed by qPCR (mean ± SEM; n = 3 independent differentiation experiments, with three organoids pooled per time point in each experiment). (G–L) In situ hybridization with LNA probes against miR-199a-3p and miR-214-3p on day 30 organoids shows strong interstitial and glomerular expression as well as some often patchy expression in the tubules. Scale bars, 50 μm. t, tubules; g, glomeruli (shown by arrows). Stained areas appear purple, over Nuclear fast red (pink) counterstain.
Figure 6
Figure 6
Characterization of Glomerular and Proximal Tubule Morphology following Inhibition of miR-199a/214 Activity (A–I) MAN13-derived organoids treated with anti-miRNA sponges and control organoids were fixed at the end of differentiation (day 25) and immunostained using antibodies against glomerular markers: (A–C) SYNPO, with a typical glomerulus circled in each condition. Note the circular profiles in controls with fine fronds in the glomerular tufts, whereas the glomeruli are dysmorphic in the sponge-treated organoids; (D–F) PODXL; (G–I) WT1. Scale bars, 100 μm. Immunostaining is brown over hematoxylin (blue) counterstain. (J–L) Organoids immunostained for CUBN (brown; no counterstain), marking proximal tubules (individual tubules outlined) revealed a continuous linear apical pattern in control tubules (J) (marked by arrows), which is disorganized in the anti-miRNA sponge organoids (K, L). Scale bars, 20 μm. (M–O) Quantification of transcripts encoding SYNPO, PODXL, and WT1 by qPCR at day 25 of differentiation (mean ± SEM; n = 3 independent differentiation experiments; each dot represents a pooled RNA sample from three organoids; N.S., not significant; p < 0.05, one-sample t test). See also Figures S4–S7.
Figure 7
Figure 7
Inhibition of miR-199a or miR-214 Increases Vascular Density in Kidney Organoids (A–C) MAN13-derived organoid sections were immunostained for PECAM1 (marking vascular endothelial cells). Scale bars, 500 μm. (D–F) PECAM1+ areas of the organoids in (A–C) are highlighted in each case showing the increased extent of staining in the anti-miRNA organoids. (G–I) High-power images showing the denser network of blood vessels in the anti-miRNA organoids compared with controls. Scale bars, 100 μm. Immunostaining is brown over hematoxylin (blue) counterstain. (J) Quantification of the extent PECAM1 staining in organoids (mean ± SEM; each dot represents a separate organoid; organoids from three independent experiments were used p < 0.05, ∗∗p < 0.01 ANOVA, followed by post-hoc t tests). See also Figures S4–S7.

References

    1. Alexander M.S., Kawahara G., Motohashi N., Casar J.C., Eisenberg I., Myers J.A., Gasperini M.J., Estrella E.A., Kho A.T., Mitsuhashi S. MicroRNA-199a is induced in dystrophic muscle and affects WNT signaling, cell proliferation, and myogenic differentiation. Cell Death Differ. 2013;20:1194–1208. - PMC - PubMed
    1. Aurora A.B., Mahmoud A.I., Luo X., Johnson B.A., van Rooij E., Matsuzaki S., Humphries K.M., Hill J.A., Bassel-Duby R., Sadek H.A. MicroRNA-214 protects the mouse heart from ischemic injury by controlling Ca(2)(+) overload and cell death. J. Clin. Invest. 2012;122:1222–1232. - PMC - PubMed
    1. Bantounas I., Ranjzad P., Tengku F., Silajdzic E., Forster D., Asselin M.C., Lewis P., Lennon R., Plagge A., Wang Q. Generation of functioning nephrons by implanting human pluripotent stem cell-derived kidney progenitors. Stem Cell Reports. 2018;10:766–779. - PMC - PubMed
    1. Bartel D.P. MicroRNAs: target recognition and regulatory functions. Cell. 2009;136:215–233. - PMC - PubMed
    1. Carroll T.J., Park J.S., Hayashi S., Majumdar A., McMahon A.P. Wnt9b plays a central role in the regulation of mesenchymal to epithelial transitions underlying organogenesis of the mammalian urogenital system. Dev. Cell. 2005;9:283–292. - PubMed

Publication types

MeSH terms