. 2021 Apr;19(2):223-242.
doi: 10.1016/j.gpb.2020.08.002. Epub 2020 Dec 8.

Transcriptomic Profiling of Human Pluripotent Stem Cell-derived Retinal Pigment Epithelium over Time

Affiliations

Transcriptomic Profiling of Human Pluripotent Stem Cell-derived Retinal Pigment Epithelium over Time

Grace E Lidgerwood et al. Genomics Proteomics Bioinformatics. 2021 Apr.

Abstract

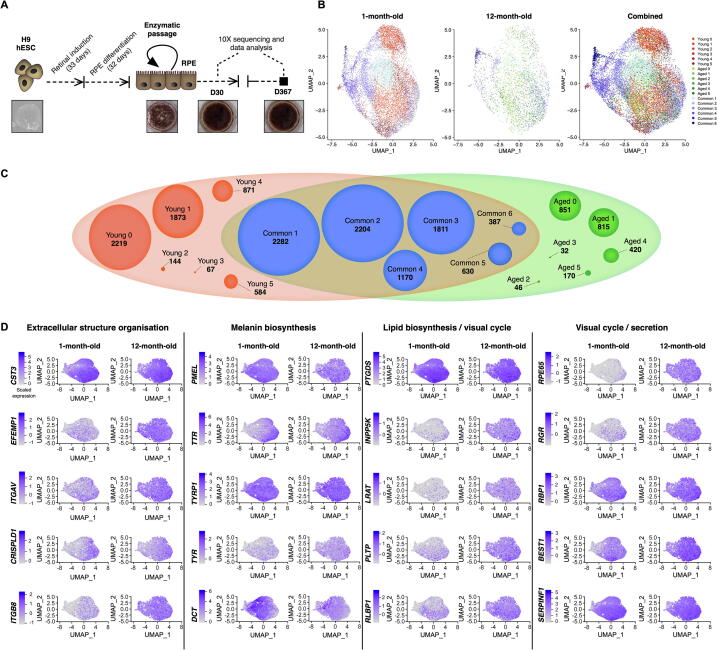
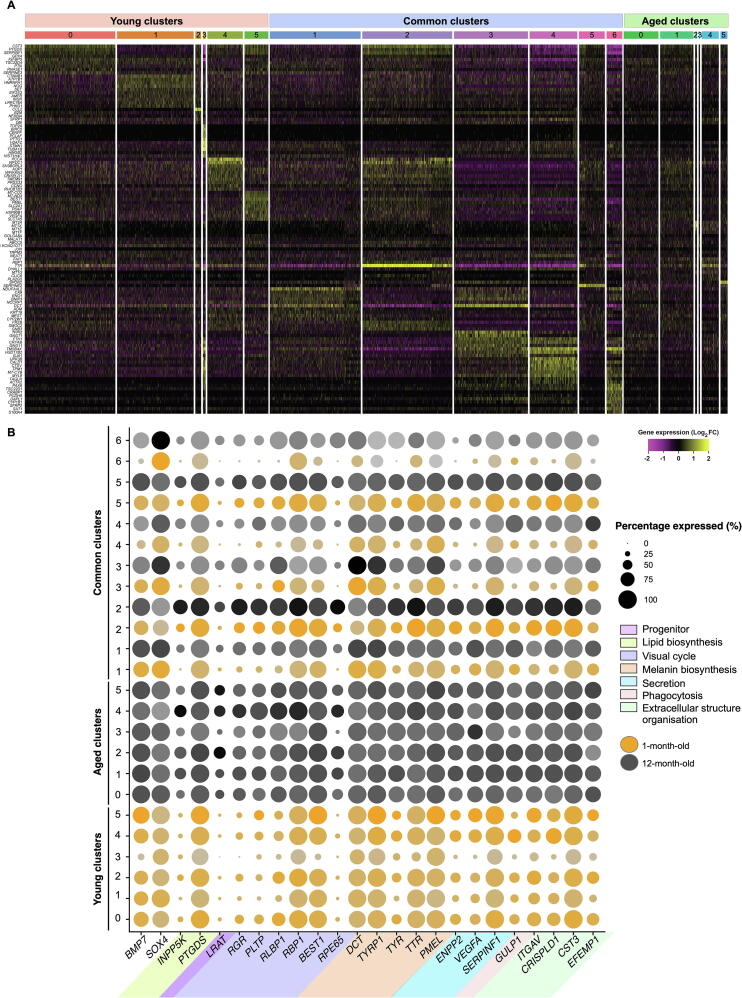
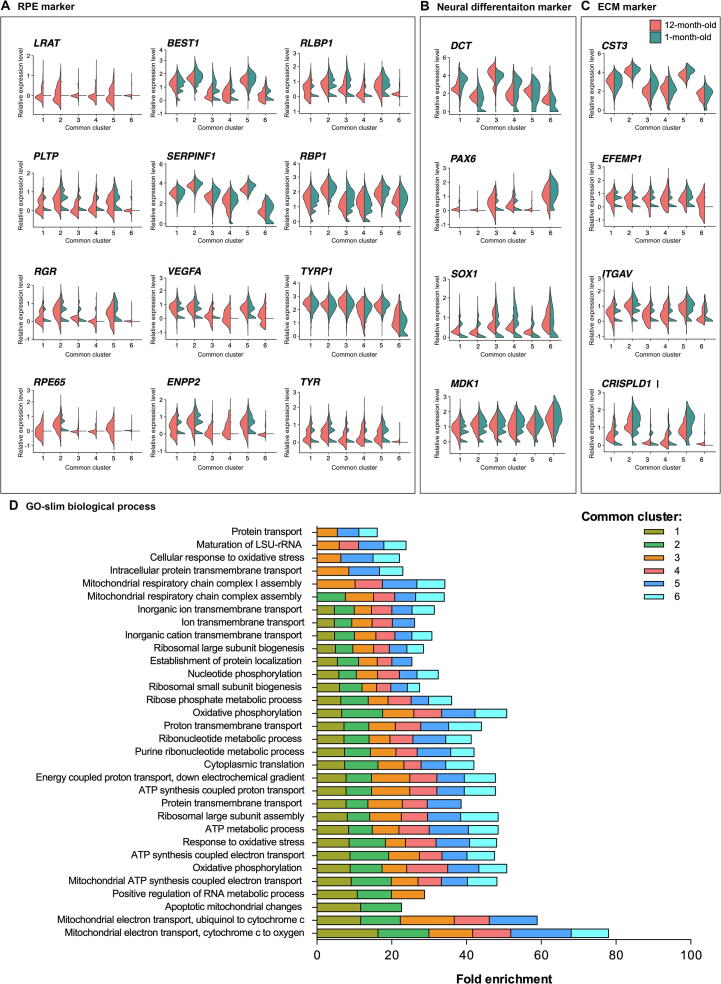
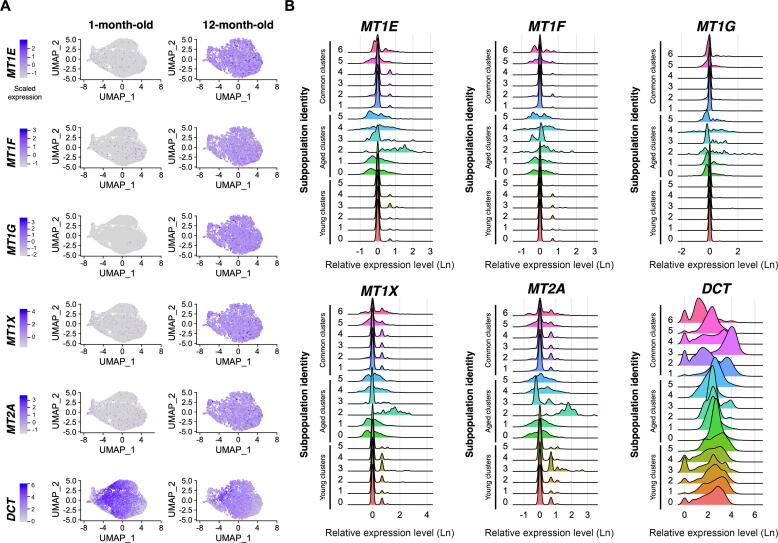
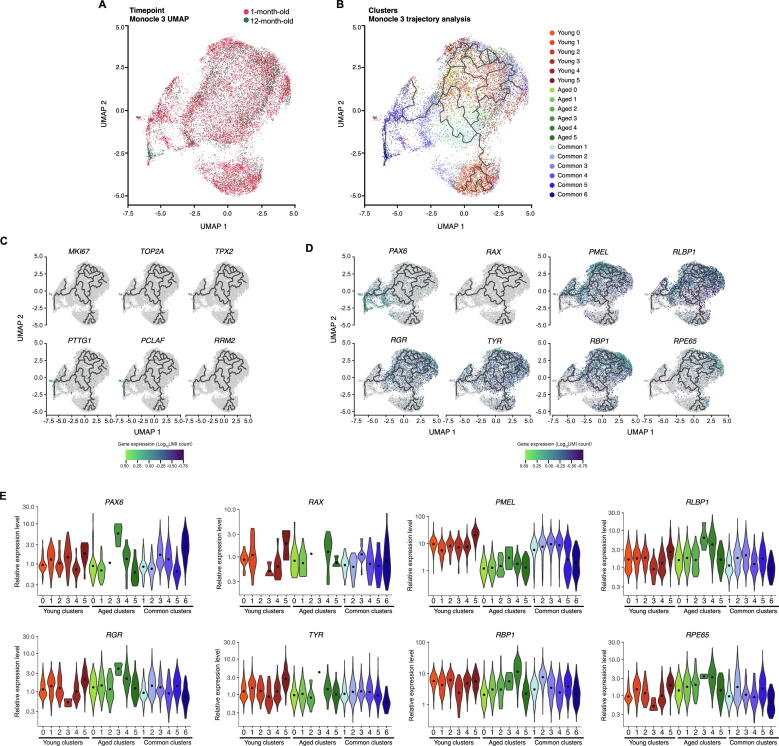
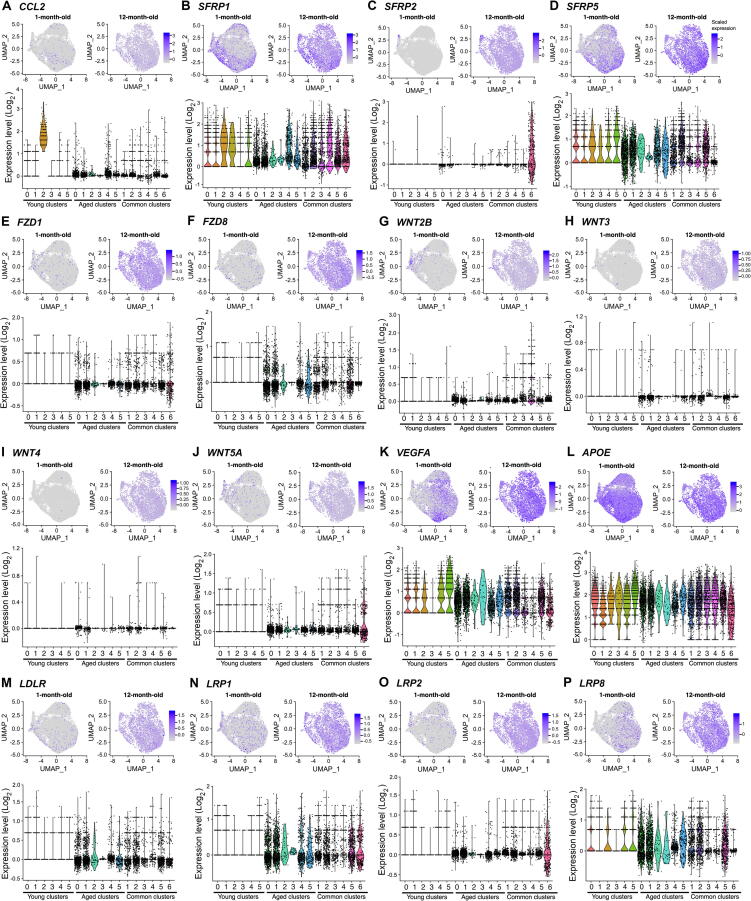
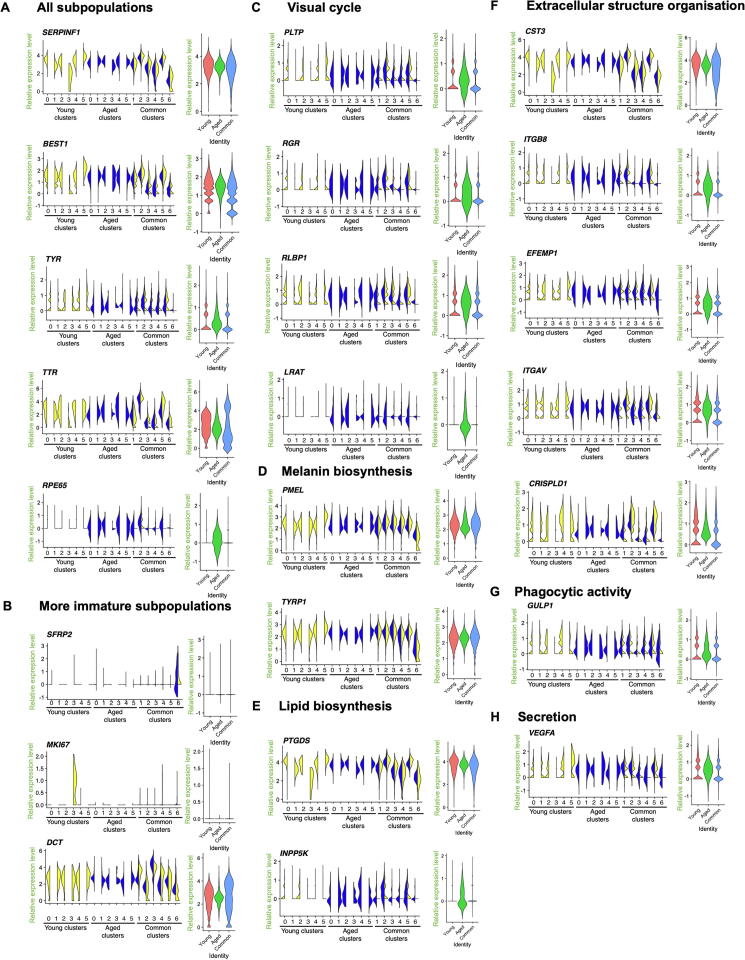
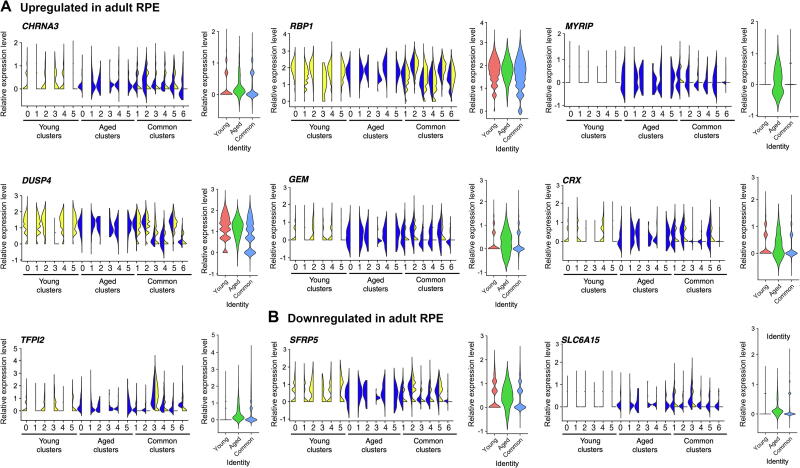
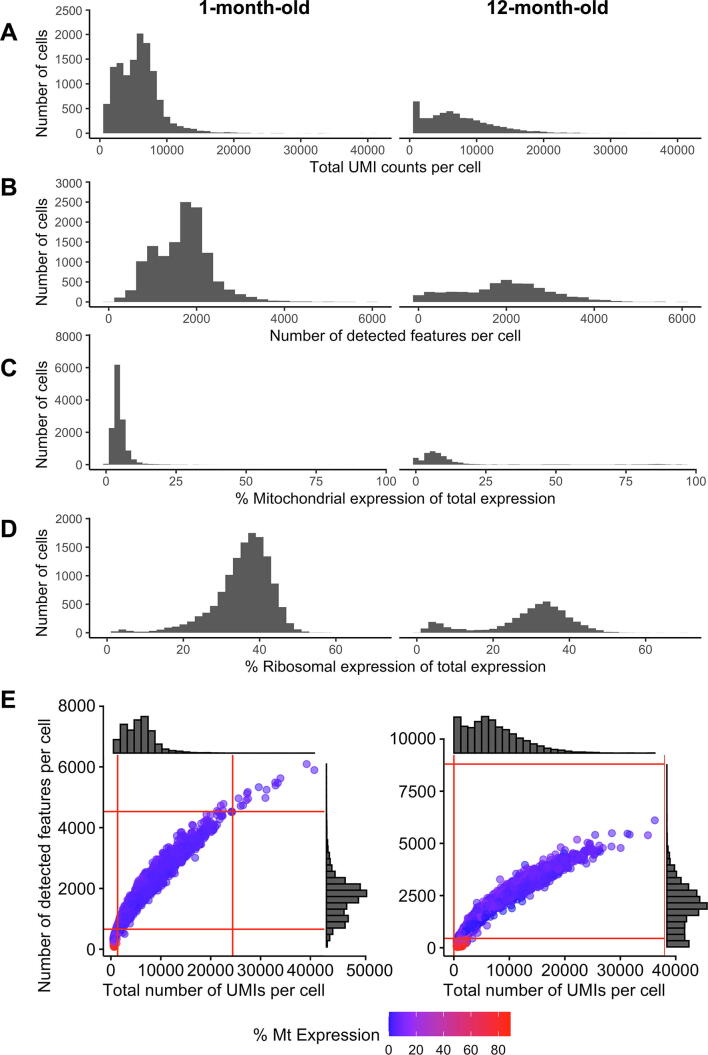
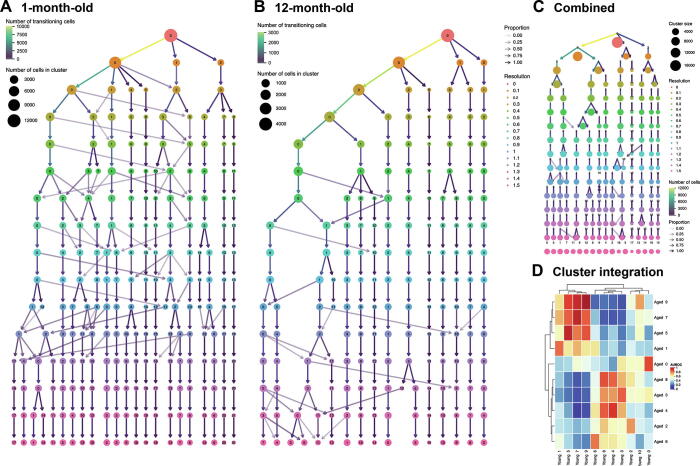
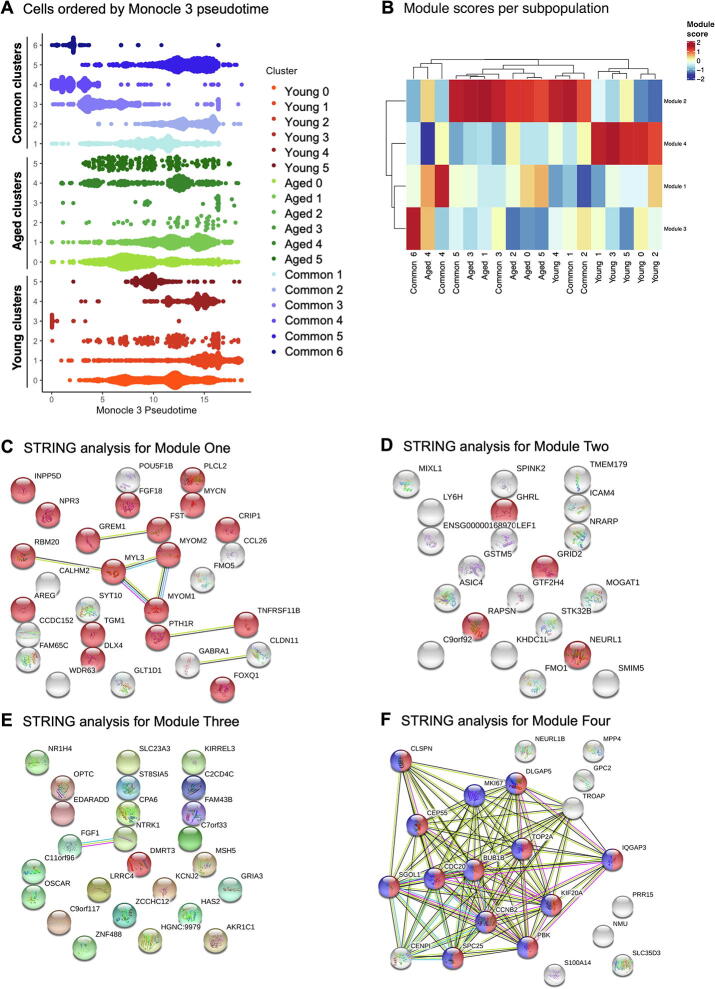
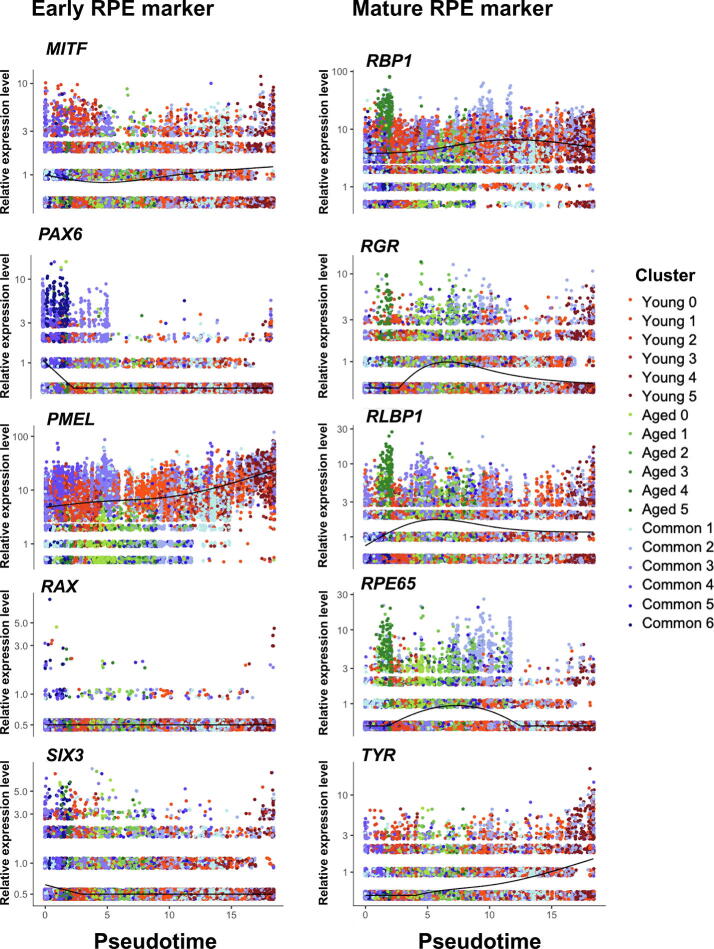
Human pluripotent stem cell (hPSC)-derived progenies are immature versions of cells, presenting a potential limitation to the accurate modelling of diseases associated with maturity or age. Hence, it is important to characterise how closely cells used in culture resemble their native counterparts. In order to select appropriate time points of retinal pigment epithelium (RPE) cultures that reflect native counterparts, we characterised the transcriptomic profiles of the hPSC-derived RPE cells from 1- and 12-month cultures. We differentiated the human embryonic stem cell line H9 into RPE cells, performed single-cell RNA-sequencing of a total of 16,576 cells to assess the molecular changes of the RPE cells across these two culture time points. Our results indicate the stability of the RPE transcriptomic signature, with no evidence of an epithelial-mesenchymal transition, and with the maturing populations of the RPE observed with time in culture. Assessment of Gene Ontology pathways revealed that as the cultures age, RPE cells upregulate expression of genes involved in metal binding and antioxidant functions. This might reflect an increased ability to handle oxidative stress as cells mature. Comparison with native human RPE data confirms a maturing transcriptional profile of RPE cells in culture. These results suggest that long-term in vitro culture of RPE cells allows the modelling of specific phenotypes observed in native mature tissues. Our work highlights the transcriptional landscape of hPSC-derived RPE cells as they age in culture, which provides a reference for native and patient samples to be benchmarked against.

Keywords: Ageing; Human embryonic stem cell; Human pluripotent stem cell; Retinal pigment epithelium; Single-cell RNA sequencing.


Figures

Figure 1
Figure 1
scRNA-seq transcriptome profiling of hPSC-derived RPE cells reveals 18 subpopulations A. Schematic representations of the experimental flow. B. UMAP of single-cell expression profile from 16,576 cells, clustered into 18 subpopulations, split by condition (1-month-old and 12-month-old) and combined. C. Cluster grouping represented by a Venn diagram, identifying 18 subpopulations, showing Young (red), Aged (green), and their common subpopulations (blue). Number of cells for each subpopulation is indicated in bold below the subpopulation name. D. UMAP of canonical RPE markers in 1-month-old and 12-month-old cultures, organised by cellular functions: extracellular structure organisation (CST3, EFEMP1, ITGAV, CRISPLD1, and ITGB8); melanin biosynthesis (PMEL, TTR, TYRP1, TYR, and DCT), lipid biosynthesis (PTGDS and INPP5K), visual cycle (LRAT, PLTP, RLBP1, RPE65, RGR, RBP1, and BEST1), as well as secretion (SERPINF1). Levels of gene expression per cell (percentage expressed) are shown with colour gradients. scRNA-seq, single-cell RNA sequencing; hPSC, human pluripotent stem cell; RPE, retinal pigment epithelium; UMAP, Uniform Manifold Approximation and Projection for Dimension Reduction.
Figure 2
Figure 2
Characterisation of hPSC-derived RPE populations A. Heatmap showing the most conserved markers (gene symbols are indicated on the left side) in all individual cells in each of the 18 subpopulations (indicated on top, with colours matching those of subpopulations shown in Figure 1C). Gene expression levels were scaled and presented as average of Log2-transformed FC. B. Dotplot representation of single-cell expression profile from 1-month-old and 12-month-old cells for selected gene markers, representative of progenitor cells, or RPE with genes linked to RPE functions. Populations arising from 1-month-old cultures are represented in orange and those from 12-month-old cultures in black. Levels of gene expression per cell are shown with colour gradients, and frequencies of cells expressing the respective gene (percentage expressed) are shown with size of dots. RPE markers are coloured according to their cellular functions. FC, fold change.
Figure 3
Figure 3
Expression patterns of selected conserved markers and GO pathway in the hPSC-derived RPE cells Expression values are measured as normalised UMI counts. A. Violin plot of selected conserved markers in each Common subpopulation characteristic of the RPE. B. Violin plot of selected conserved markers in each Common subpopulation characteristic of the neural differentiation. C. Violin plot of selected conserved markers in each Common subpopulation characteristic of the ECM. The plots describe the distribution and relative expression of each transcript in each common subpopulation, with separation of cells belonging to the 1-month-old (blue) and 12-month-old (brown) cultures. D. PANTHER GO-slim (biological process) pathways associated with each of the Common subpopulations (Common 1–6; colour-coded) identified via over-representation analysis. Association is measured by fold enrichment, that is calculated from the number of genes observed, divided by the expected number of genes to be present by chance. UMI, unique molecular identifier; ECM, extracellular matrix.
Figure 4
Figure 4
Aged RPE subpopulations likely increase their handling of metals and antioxidant abilities A. Feature plots of expression profiles of DCT and genes encoding key metallothioneins (including MT1E, MT1F, MT1G, MT1X, and MT2A) across the 1-month-old and 12-month-old cells. The intensity of gene expression is indicated by colour gradient. B. Ridge plots of expression profiles (measured in natural log-normalised UMI counts) of DCT and genes encoding key metallothioneins and across all subpopulations. Different colours are used for each subpopulation for ease of reading.
Figure 5
Figure 5
Only a few cells retain a proliferative profile Highly dimensional expression data were reduced into two dimensions using UMAP. Plot axes (UMAP1 and UMAP2) represent coordinates in the resulting 2D space. A. UMAP of single cell expression profile split by conditions (1-month-old and 12-month-old). B. UMAP of single cell expression profile for trajectory analysis using Monocle 3. C. UMAP of single cell expression profile for markers associated with proliferation (MKI67, TOP2A, PCLAF, RRM2, TPX2, and PTTG1) across all cells. Expression levels measured as Log10 normalised UMI counts are represented by colour intensity. Lines represent differentiation trajectories as calculated by Monocle3. D. Pseudotime analysis of early retinal markers (PAX6 and RAX) and RPE genes (PMEL, RLBP1, RGR, TYR, RBP1, and RPE65) across the 1-month-old and 12-month-old cells. Expression levels measured as Log10 normalised UMI counts are represented by colour intensity. Lines represent differentiation trajectories as calculated by Monocle3. E. Violin plots of normalised UMI counts of early retinal markers and RPE genes across all subpopulations showing variations in expression across cluster groups.
Figure 6
Figure 6
RPE subpopulations contribute to paracrine signalling UMAP of single-cell expression profile of markers for 1-month-old and 12-month-old cultures, with associated violin plots, representing Log2 UMI counts across all populations for CCL2 (A); SFRPs, FZDs, and WNTS (B); VEGFA (C); APOE, LDLR, and LRPs (D). In the UMAPs, the intensity of gene expression is indicated by colour gradient. UMAP of single-cell expression profile of markers for 1-month-old and 12-month-old cultures, with associated violin plots across all populations for CCL2 (A), SFRP1 (B), SFRP2 (C), SFRP5 (D), FZD1 (E), FZD8 (F), WNT2B (G), WNT3 (H), WNT4 (I), WNT5A (J), VEGFA (K), APOE (L), LDLR (M), LRP1 (N), LRP2 (O), LRP8 (P). In the UMAP plots, the intensity of gene expression is indicated by colour gradient. In the violin plots, different colours are used for each subpopulation for ease of reading.
Figure 7
Figure 7
hPSC-derived RPE subpopulations express native RPE markers with different patterns Violin plots of selected markers representative of native RPE cells (obtained from [28]) across all subpopulations and in the three main populations “Young”, “Aged”, “Common”, represented in different colours. Subpopulations arising from the 1-month-old culture are indicated in yellow; subpopulations arising from the 12-monht-old culture are indicated in blue. A. Genes found in all subpopulations (SERPINF1, BEST1, TYR, TTR, and RPE65). B. Genes found in more immature subpopulations (SFRP2, MKI67, and DCT). C. Genes with varied expression associated with visual cycle (PLTP, RGR, RLBP1, and LRAT). D. Genes with varied expression associated with melanin biosynthesis (PMEL and TYRP1). E. Genes with varied expression associated with lipid biosynthesis (PTGDS and INPP5K). F. Genes with varied expression associated with extracellular structure organisation (CST3, ITGB8, EFEMP1, ITGAV, and CRISPLD1). G. Genes with varied expression associated with phagocytic activity (GULP1). H. Genes with varied expression associated with secretion (VEGFA). The plots describe the distribution and relative expression of each gene in the subpopulations, measured as normalised UMI counts.
Figure 8
Figure 8
Some hPSC-derived RPE subpopulations acquire a gene expression profile closer to adult native RPE with time in culture Violin plots of selected markers representative of native adult RPE cells (obtained from [28]) across all subpopulations and in the three main populations “Young”, “Aged”, “Common”, represented in different colours. Subpopulations arising from the 1-month-old culture are indicated in yellow; subpopulations arising from the 12-monht-old culture are indicated in blue. A. Genes with upregulated expression in adult RPE (CHRNA3, RBP1, MYRIP, DUSP4, GEM, CRX, and TFPI2). B. Genes with downregulated expression in adult RPE (SFRP5 and SLC6A15). The plots describe the distribution and relative expression of each gene in the subpopulations, measured as normalised UMI counts.
Supplementary figure S1
Filtering of cells based on quality control metrics. A. Total number of UMIs per cell. B. Total number of features per cell. C. Percentage of mitochondrial gene expression relative to total expression. D. Percentage of ribosomal gene expression relative to total expression. E. Relationship between total UMIs, detected genes, and percentage of mitochondrial gene expression. Histograms for total UMIs and detected features are located on X and Y margins of scatter plot, respectively. Scatter plot represents the relationships between the two metrics and are coloured by percentage of mitochondrial expression. Plots for 1-month-old culture and 12-month-old culture are shown on the left and right, respectively. UMI, unique molecular identifier; MAD, median absolute deviation.
Supplementary figure S2
Characterisation of stable cell subpopulations. Graph-based clustering was performed at different resolutions ranging from 0 to 1.5, in increments of 0.1 for 1-month-old (A), 12-month-old (B), and combined (C) datasets using clustree. Regions of stability are represented by minimal branching. Values within circles are arbitrary cluster identifiers and arrows indicate the proportion of cells moving from one group to another (transitioning cells, colour coded). D. Integration of clusters identified in 1-month-old and 12-month-old cells via MetaNeighbor. Heatmap represents degree of similarity of clusters as AUROC values. AUROC, area under receiver operating characteristic curve.
Supplementary figure S3
Residual trajectory genes modules analyses measured with Monocle 3. A. Monocle 3 pseudotime represented in beeswarm plots. Different colours are used for each subpopulation for ease of reading. B. Heatmap of module scores for each subpopulation. Modules were identified via Monocle 3 gene trajectory analysis, and module scores were calculated via differential expression of genes from each module. C. STRING analysis of genes from Table S6 for Module 1. Genes involved in regulation of development are shown in red. D. STRING analysis of genes from Table S6 for Module 2. Genes involved in regulation of synapse organisation are shown in red. E. STRING analysis of genes from Table S6 for Module 3. No relevant biological processes was revealed. F. STRING analysis of genes from Table S6 for Module 4. Genes involved in regulation of cell cycle and mitosis are shown in blue and red, respectively.
Supplementary figure S4
Gene trajectory by pseudotime analyses of early and mature RPE markers. Gene expression (measured as normalised UMI count) of early (MITF, PAX6, PMEL, RAX, and SIX3) and mature RPE markers (RBP1, RGR, RLBP1, RPE65, and TYR) using Monocle 3, with each subpopulation coded in colour as indicated. Trend of expression is represented by a black line within each panel.

References

    1. Perez V.L., Saeed A.M., Tan Y., Urbieta M., Cruz-Guilloty F. The eye: a window to the soul of the immune system. J Autoimmun. 2013;45:7–14. - PubMed
    1. Xu H., Chen M., Forrester J.V. Para-inflammation in the aging retina. Prog Retin Eye Res. 2009;28:348–368. - PubMed
    1. Lidgerwood G.E., Morris A.J., Conquest A., Daniszewski M., Rooney L.A., Lim S.Y., et al. Role of lysophosphatidic acid in the retinal pigment epithelium and photoreceptors. Biochim Biophys Acta Mol Cell Biol Lipids. 2018;1863:750–761. - PubMed
    1. Lidgerwood G.E., Lim S.Y., Crombie D.E., Ali R., Gill K.P., Hernández D., et al. Defined medium conditions for the induction and expansion of human pluripotent stem cell-derived retinal pigment epithelium. Stem Cell Rev Rep. 2016;12:179–188. - PubMed
    1. Kamao H., Mandai M., Okamoto S., Sakai N., Suga A., Sugita S., et al. Characterization of human induced pluripotent stem cell-derived retinal pigment epithelium cell sheets aiming for clinical application. Stem Cell Rep. 2014;2:205–218. - PMC - PubMed

Publication types