. 2020 Dec 14;21(Suppl 17):508.
doi: 10.1186/s12859-020-03763-4.

Potential predictors of type-2 diabetes risk: machine learning, synthetic data and wearable health devices

Affiliations

Potential predictors of type-2 diabetes risk: machine learning, synthetic data and wearable health devices

Paola Stolfi et al. BMC Bioinformatics. .

Abstract

Background: The aim of a recent research project was the investigation of the mechanisms involved in the onset of type 2 diabetes in the absence of familiarity. This has led to the development of a computational model that recapitulates the aetiology of the disease and simulates the immunological and metabolic alterations linked to type-2 diabetes subjected to clinical, physiological, and behavioural features of prototypical human individuals.

Results: We analysed the time course of 46,170 virtual subjects, experiencing different lifestyle conditions. We then set up a statistical model able to recapitulate the simulated outcomes.

Conclusions: The resulting machine learning model adequately predicts the synthetic dataset and can, therefore, be used as a computationally-cheaper version of the detailed mathematical model, ready to be implemented on mobile devices to allow self-assessment by informed and aware individuals. The computational model used to generate the dataset of this work is available as a web-service at the following address: http://kraken.iac.rm.cnr.it/T2DM .

Keywords: Computational modeling; Emulator; Machine learning; Random forest; Synthetic data; T2D.


Conflict of interest statement

The authors declare that they have no competing interests.

Figures
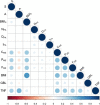
Fig. 1
Fig. 1
The dots represent the correlations between each couple of variables: the bigger the dots the higher the correlation in absolute value. Numerical value follows the color code in the bar.
Fig. 2
Fig. 2
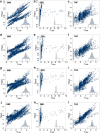
Scatter plots of the independent versus the dependent variables, together with a polynomial fit in orange
Fig. 2
Fig. 2
Scatter plots of the independent versus the dependent variables, together with a polynomial fit in orange
Fig. 3
Fig. 3
Each row shows the out-of-sample (i.e. in the test set) scatter plots of the true and fitted (i.e. predicted) values of the variables specified in each panel’s caption (from left to right, BMI, GBL and TNF). Inset plots show the histogram of the out-of-sample residues’ (i.e. the prediction error). The last row shows that multivariate random forest performs better predictions when compared to the linear or polynomial regression
Fig. 3
Fig. 3
Each row shows the out-of-sample (i.e. in the test set) scatter plots of the true and fitted (i.e. predicted) values of the variables specified in each panel’s caption (from left to right, BMI, GBL and TNF). Inset plots show the histogram of the out-of-sample residues’ (i.e. the prediction error). The last row shows that multivariate random forest performs better predictions when compared to the linear or polynomial regression
Fig. 4
Fig. 4
Impact of each input variable x on the output y. Inset plot shows the same data in y-log scale to increase readability (y-scale is in arbitrary units). This plot offers a one-sight readout of the impact of subjects anthropometric measures and lifestyle patterns on the likelihood to progress toward a state of higher risk of development of diabetes
Fig. 5
Fig. 5
Top twelve pairwise co-influence on y calculated by method in [62]

References

    1. Organization, W.H. Media Centre. http://who.int/mediacentre/factsheets/fs312/en/. Accessed 27 Sept 2016
    1. Donath MY, Schumann DM, Faulenbach M, Ellingsgaard H, Perren A, Ehses JA. Islet inflammation in type 2 diabetes. Diabetes Care. 2008;31(Supplement 2):161–164. doi: 10.2337/dc08-s243. - DOI - PubMed
    1. Donath MY, Shoelson SE. Type 2 diabetes as an inflammatory disease. Nat Rev Immunol. 2011;11(2):98–107. doi: 10.1038/nri2925. - DOI - PubMed
    1. Gregor MF, Hotamisligil GS. Inflammatory mechanisms in obesity. Annu Rev Immunol. 2011;29(1):415–445. doi: 10.1146/annurev-immunol-031210-101322. - DOI - PubMed
    1. Akash MSH, Rehman K, Chen S. Role of inflammatory mechanisms in pathogenesis of type 2 diabetes mellitus. J Cell Biochem. 2013;114(3):525–531. doi: 10.1002/jcb.24402. - DOI - PubMed