. 2021 Jan 7;108(1):115-133.
doi: 10.1016/j.ajhg.2020.11.015. Epub 2020 Dec 11.

SCUBE3 loss-of-function causes a recognizable recessive developmental disorder due to defective bone morphogenetic protein signaling

Affiliations

SCUBE3 loss-of-function causes a recognizable recessive developmental disorder due to defective bone morphogenetic protein signaling

Yuh-Charn Lin et al. Am J Hum Genet. .

Abstract

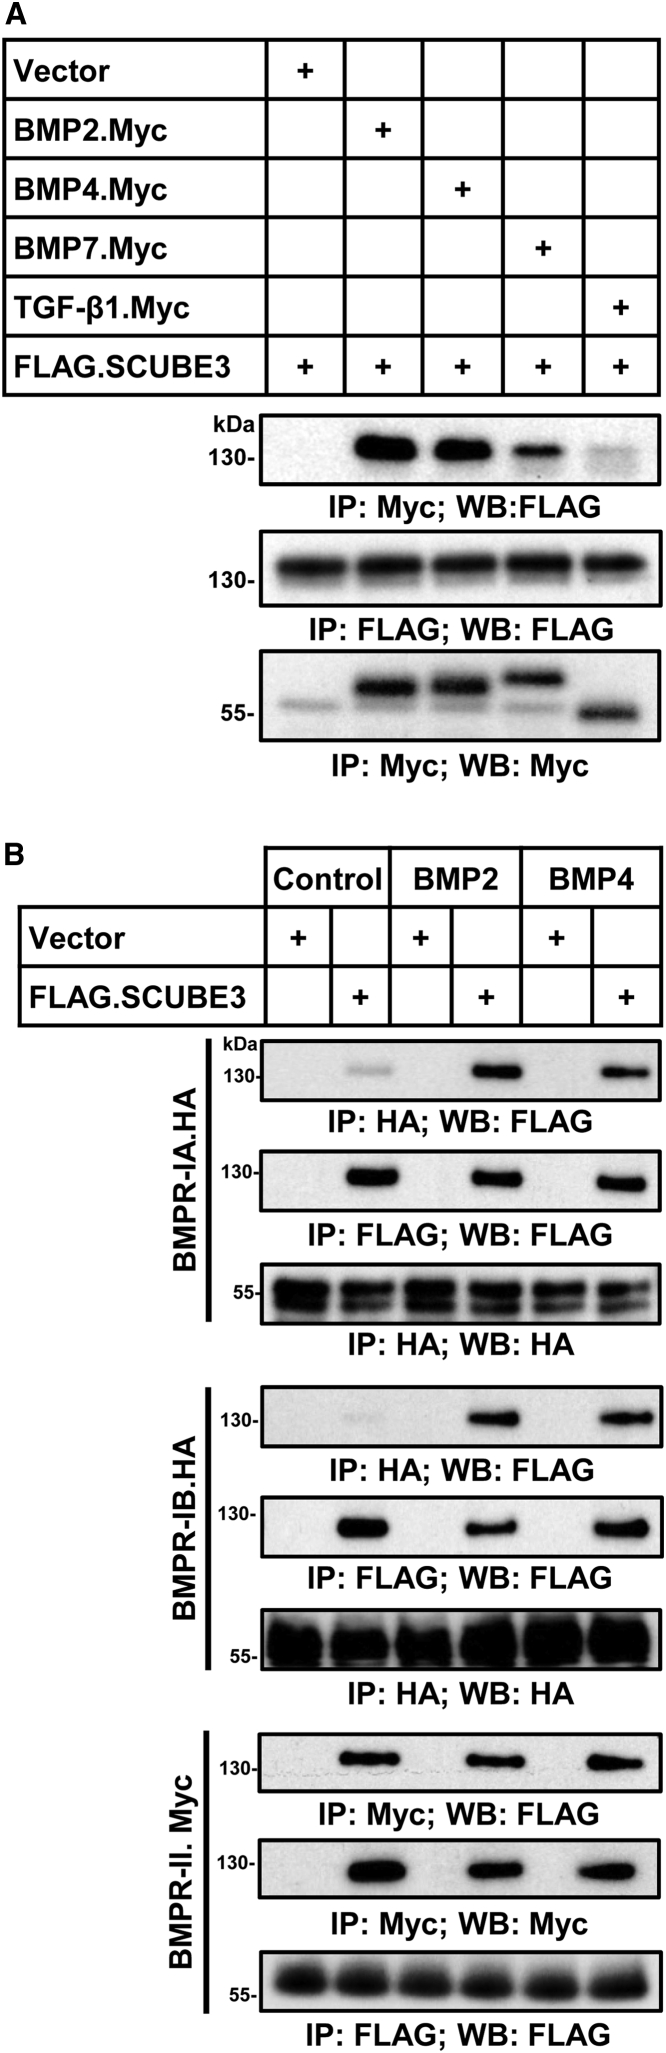
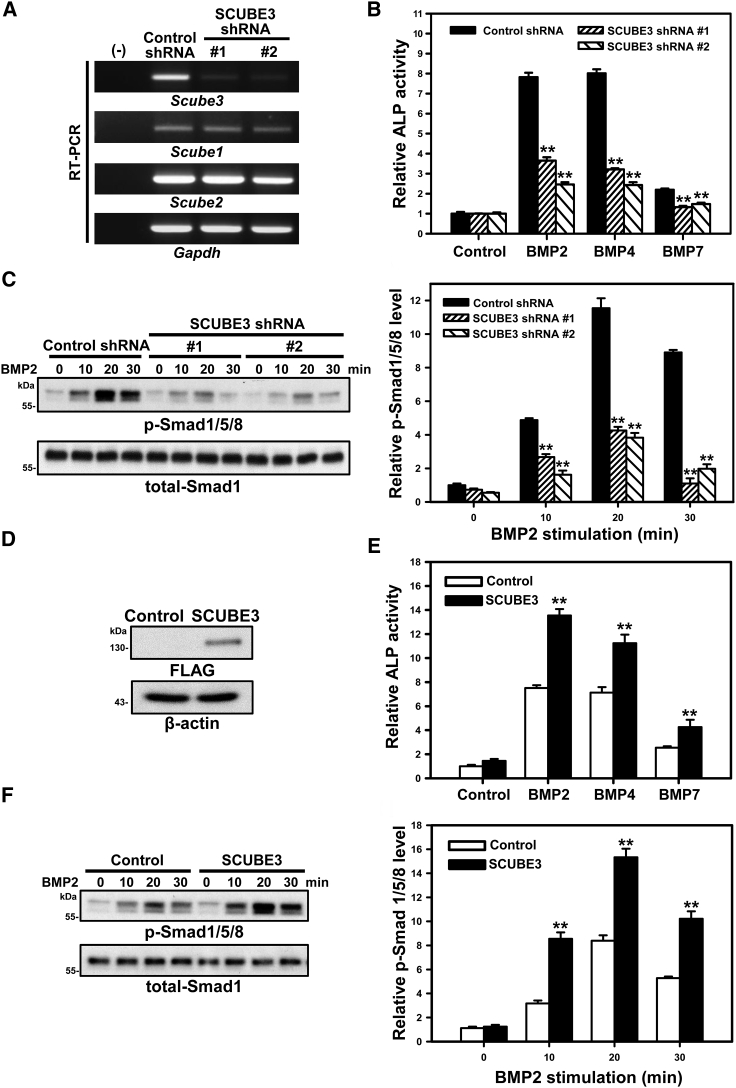
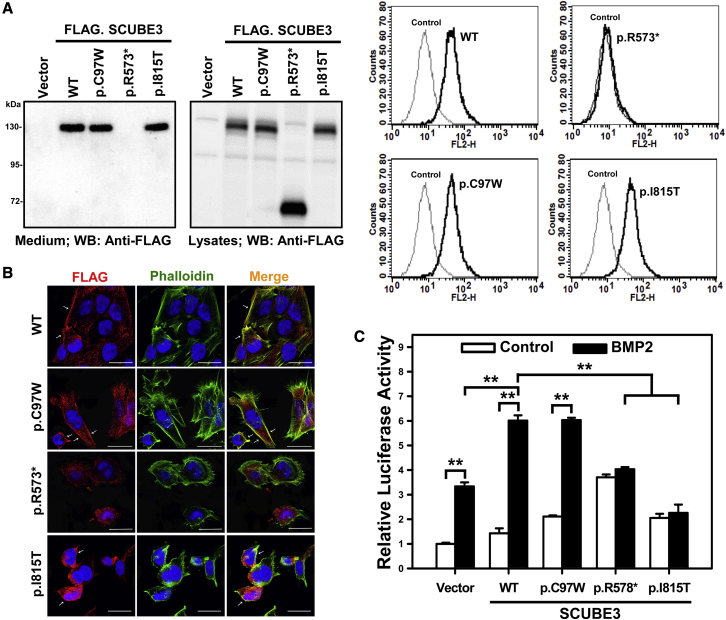
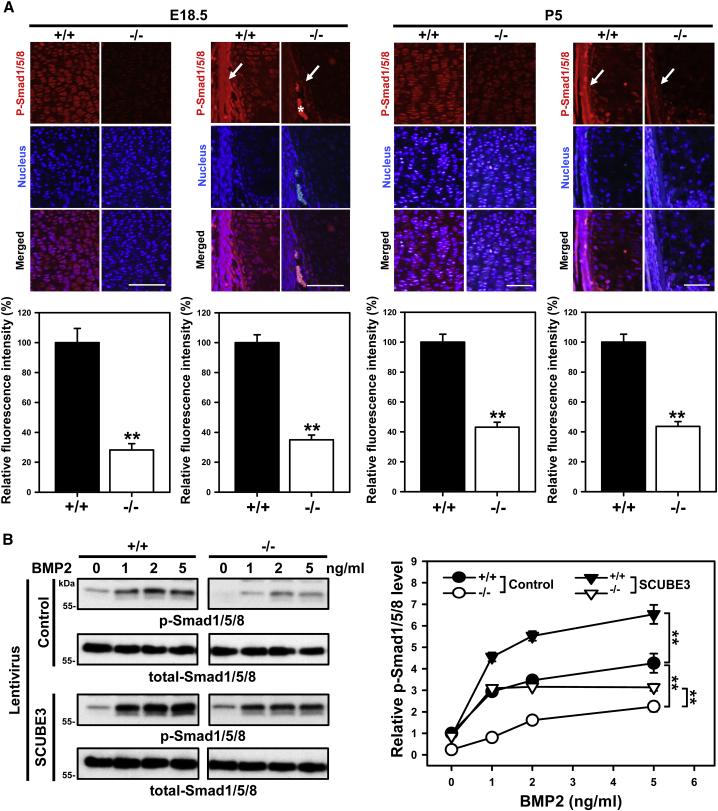
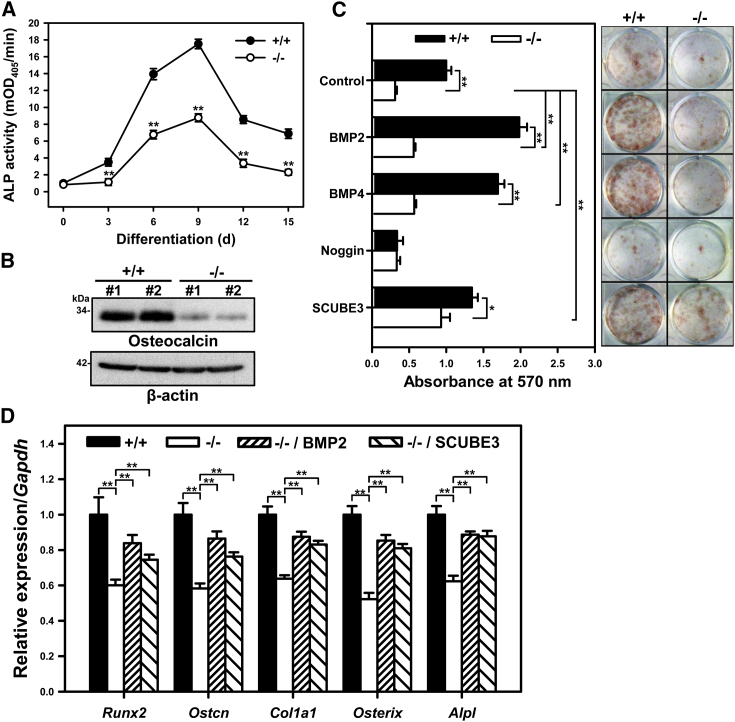
Signal peptide-CUB-EGF domain-containing protein 3 (SCUBE3) is a member of a small family of multifunctional cell surface-anchored glycoproteins functioning as co-receptors for a variety of growth factors. Here we report that bi-allelic inactivating variants in SCUBE3 have pleiotropic consequences on development and cause a previously unrecognized syndromic disorder. Eighteen affected individuals from nine unrelated families showed a consistent phenotype characterized by reduced growth, skeletal features, distinctive craniofacial appearance, and dental anomalies. In vitro functional validation studies demonstrated a variable impact of disease-causing variants on transcript processing, protein secretion and function, and their dysregulating effect on bone morphogenetic protein (BMP) signaling. We show that SCUBE3 acts as a BMP2/BMP4 co-receptor, recruits the BMP receptor complexes into raft microdomains, and positively modulates signaling possibly by augmenting the specific interactions between BMPs and BMP type I receptors. Scube3-/- mice showed craniofacial and dental defects, reduced body size, and defective endochondral bone growth due to impaired BMP-mediated chondrogenesis and osteogenesis, recapitulating the human disorder. Our findings identify a human disease caused by defective function of a member of the SCUBE family, and link SCUBE3 to processes controlling growth, morphogenesis, and bone and teeth development through modulation of BMP signaling.

Keywords: BMP; BMP receptors; SCUBE; bone morphogenetic protein; genomic sequencing; intracellular signaling; mechanism of disease; morphogenesis; skeletal development.


Conflict of interest statement

C.B., P.B., and N.-M.G. declare no additional conflicts of interest beyond their employment affiliation. All the other authors declare no competing interests.

Figures

Figure 1
Figure 1
Pedigrees of the families included in the study, domain structure of SCUBE3, and clinical features of subjects with bi-allelic pathogenic SCUBE3 variants (A) Pedigrees and segregation data for the nine families included in the study. Affected and unaffected subjects are indicated by filled and open squares/circles, respectively. (B) Cartoons showing the genomic organization of SCUBE3 and functional domains of its encoded protein. Location of the disease-causing variants is shown. c.2599+2T>C is predicted to result in multiple aberrantly processed transcripts, with p.Asn801Thrfs127 representing the prevalent out-of-frame product (see Figure S3). (C) Clinical features of affected individuals. (1a) Whole body appearance of subject F1S1; (1b, 1c) facies of subjects F1S1 and F1S2; (1d) dental anomalies in F1S2; (2a–2c) facies of subjects F2S1 and F2S2; (2d) dental anomalies in F2S1; (3a) facies of subject F3S3; (3b) finger joint swelling in F3S3; (3c) dental anomalies in F3S3; (4a, 4b) facies of subject F4S1; (4c) 5th finger camptodactyly in F4S1; (4d) dental anomalies in F4S1; (5a–5d) facies of subjects F5S1 and F5S2; (6a) facies of subject F6S1; (7a) facies of subject F7S1; (8a, 8b) facies of subject F8S1; (8c) bilateral shortening of 4th and 5th toes in F8S1; (9a–9c) facies of subjects F9S1 and F9S2. (D) Radiological findings in affected subjects. (1) dental anomalies in F1S2 shown by panoramic dental X-ray; (2) bowed radius in F2S1; (3) reduced epiphyses including the metacarpal heads, capitate-3rd-metacarpal and trapezoid-2nd-metacarpal coalitions and camptodactyly in F3S1; (4) trapezoid-2nd metacarpal coalition and cuneiform bones-2nd and 3rd metatarsals coalitions in F8S1; (5) absent 12th rib pair in F3S1; (6–7) partial fusion of C5-C6 and failure of the posterior arch fusion in C7-T1 in F8S1; (8) narrow iliac wings in F3S1; (9) squared vertebral bodies in F2S1; (10) tarsal-metatarsal coalition in both feet in F2S1.
Figure 2
Figure 2
SCUBE3 interacts with ligands and receptors of the BMP signaling pathway (A) SCUBE3 specifically interacts with BMP proteins but not TGF-β1. The expression plasmids encoding Myc-tagged BMP2, BMP4, BMP7, and TGF-β1 were co-transfected with a FLAG-tagged SCUBE3 construct in HEK293T cells. After 48 h, cell lysates underwent immunoprecipitation (IP), followed by western blot (WB) analysis with indicated antibodies to determine protein-protein interactions. Representative blots from one experiment of three performed are shown. (B) SCUBE3 interacts with the receptors of the BMP signaling pathway. Plasmids encoding FLAG-tagged SCUBE3 were co-transfected with a HA-tagged BMPRIA, HA-tagged BMPRIB, or Myc-tagged BMPRII construct in HEK293T cells. After 48 h, transfected cells were stimulated with recombinant BMP2 or BMP4 protein for 20 min, and cell lysates were immunoprecipitated. Western blot analysis with the indicated antibodies was performed to determine protein protein interactions. Representative blots from one experiment of three performed are shown.
Figure 3
Figure 3
SCUBE3 is an enhancer of BMP signaling and is involved in BMP-induced osteoblast differentiation (A) Endogenous SCUBE3 expression was suppressed by two different SCUBE3-targeting short hairpin RNA (shRNA) lentiviruses (SCUBE3-shRNA #1 or #2). A luciferase shRNA lentivirus was used as a negative control (Control-shRNA). The efficiency and specificity of Scube3 mRNA knockdown was confirmed by RT-PCR. Gapdh mRNA level was used as internal control. Expression levels from one experiment of three performed are shown. (B) C3H10T1/2 cells expressing control-shRNA or SCUBE3-targeting shRNAs were cultured without or with BMP (50 ng/mL) for 7 days. Relative ALP activity normalized with control values is shown. The experiments were performed 3 times in triplicate. Data are mean ± SD. ∗∗p < 0.01. (C) Effect of SCUBE3 knockdown on the BMP2-stimulated phosphorylation of Smad1/5/8 were assessed by western blot analysis, and total-Smad1 expression was used as an internal control (left panel). Quantification by densitometric analysis of BMP2-induced phosphorylation of Smad1/5/8 in control or SCUBE3 knockdown C3H10T1/2 cells. Data are mean ± SD from 3 independent experiments. ∗∗p < 0.01 (right panel). (D) Exogenous expression of FLAG-tagged SCUBE3 in C3H10T1/2 cells by a recombinant lentivirus. Protein overexpression of SCUBE3 was confirmed by western blot analysis. β-actin was used as internal control. Representative blots from one experiment of three performed are shown. (E) SCUBE3 overexpression enhances BMP2-stimulated osteoblast differentiation in C3H10T1/2 cells. C3H10T1/2 control (empty lentivirus) or SCUBE3-overexpressing cells were cultured with or without BMP (50 ng/mL) for 7 days. Relative ALP activity was calculated by normalizing with the respective control value. The experiments were performed 3 times in triplicate. Data are mean ± SD. ∗∗p < 0.01. (F) SCUBE3 overexpression enhances BMP2 downstream signaling in C3H10T1/2 cells. Western blot analysis (left panel) and quantification (right panel) of BMP2-induced phosphorylation of Smad1/5/8 with control and SCUBE3 overexpression in C3H10T1/2 cells. Data are mean ± SD from three independent experiments. ∗∗p < 0.01.
Figure 4
Figure 4
Effect of disease-causing SCUBE3 variants on cell-surface protein levels and secretion and on BMP2 signaling (A) SCUBE3 levels were analyzed in HEK293T cells. Samples from conditioned media and total cell lysates were collected and analyzed by western blot analysis using an anti-FLAG antibody (left panel). Empty vector-transfected cells were used as control. Representative blots from single experiments of three performed each are shown. A set of transfected cells was stained with anti-FLAG antibody and underwent flow cytometry (right panel). (B) SAOS-2 cells were transfected with the expression plasmids encoding wild-type (WT) SCUBE3 and disease-associated variants (p.Cys97Trp, p.Arg573, and p.Ile815Thr). After 48 h, transfected cells were stained with mouse anti-FLAG antibody, Alexa Fluor 594 goat anti-mouse secondary antibody (red) and were analyzed by confocal microscopy. Alexa Fluor 488 phalloidin dye was used to stain the cortical actin associated with the plasma membrane (green). Nuclei are DAPI stained (blue). Merged images are shown in the right panels. White arrows indicate the distribution of the SCUBE3 proteins on the cellular surface in transfected cells. Red arrows indicate the dispersed localization of the p.Arg573 SCUBE3 variant in transfected cells. Scale bars represent 25 μm. (C) HepG2 cells were transfected with the BMP-responsive luciferase reporter (BRE-luc) and pRL-TK alone or with the indicated expression plasmids. After 24 h, transfected cells were incubated for another 24 h with and without BMP2 (50 ng/mL), then luciferase activity was measured. Relative luciferase activity represents firefly luciferase values normalized to Renilla activity. The experiments were performed 3 times in triplicate. Data are mean ± SD. ∗∗p < 0.01.
Figure 5
Figure 5
Impaired endochondral bone formation and chondrogenesis in Scube3-deficient mice (A) Skeletons of WT Scube3 (+/+) and Scube3 KO (−/−) newborns (P1) stained with Alizarin red (calcified tissue) and Alcian blue (cartilage). Scale bar = 1 cm. (B) Misaligned incisors observed in −/− 8-week-old mice. (C) Small lower jaw in −/− 8-week-old mice. (D) Hunchback spine in −/− 8-week-old mice. (E) Thoracic cavity of +/+ and −/− animals (P1) stained with Alizarin red and Alcian blue. The asterisk shows the sternum protrusion in −/− mice. (F) RT-PCT analysis of Scube1/2/3 expression in kidney, testis and femur from +/+ and −/− adult animals (8 week-old). Expression of Gapdh was used as an internal control. The experiments were performed 3 times. (G) Forelimb of +/+ and −/− animals (P1) stained with Alizarin red and Alcian blue. The dotted line indicates the corresponding length. (H) Hindlimbs of +/+ and −/− animals (P1) stained with Alizarin red and Alcian blue. fe, femur; t, tibia; fi, fibula. Tibial lengths are marked (upper panel) and quantified (lower panel). Data are mean ± SD (n = 5 in each group). ∗∗p < 0.01. (I) Photographs of adult (8-week-old) +/+ and −/− mice (nose-to-anus was marked). Scale bar = 1 cm. (J) Whole-body radiographs. X-ray images of 8-week-old +/+ and −/− male mice. (K) Body weight from 4- to 8-week-old +/+ (n = 7) and −/− (n = 9) mice. Data are mean ± SD. ∗∗p < 0.01. (L) Body length of 8-week-old +/+ (n = 7) and −/− (n = 9) mice. Data are mean ± SD. ∗∗p < 0.01. (M) Femur and tibia length of 8-week-old +/+ (n = 8) and −/− (n = 7) mice. Data are mean ± SD. ∗∗p < 0.01. (N) Graphic illustration showing the structure of the growth plate, including resting chondrocytes (a), proliferative chondrocytes (b), prehypertrophic chondrocytes (c), hypertrophic chondrocytes (d), and osteoblast/blood vessel (e). (O) Alcian blue hematoxylin/orange G staining showing a shorter growth plate in E16.5 (n = 5) and P1 (n = 6) −/− mice. Scale bar = 100 μm. (P) Quantification of different chondrocyte layer lengths in growth plates of P1 +/+ and −/− animals (n = 6). (Q and R) Chondrocyte micromass cultures of mesenchymal cells from E12.5 +/+ (n = 5) and −/− (n = 5) mouse limbs treated with/without BMP signaling inhibitor (noggin) (50 ng/mL), BMP2 or BMP7 for 9 d (Q). Alcian blue staining was quantified by solubilizing the sample in 6 M guanidine hydrochloride, followed by OD620 measurement by spectrophotometry (R). Data are mean ± SD (n = 5). ∗∗p < 0.01.
Figure 6
Figure 6
Reduction of Smad1/5/8 phosphorylation in Scube3-deficient proliferative chondrocytes and periosteal osteoprogenitor cells (A) Immunohistochemical analysis of p-Smad1/5/8 in proliferative chondrocytes (left panel) and periosteal osteoprogenitor cells (right panel) of E18.5 or P5 Scube3 wild-type (+/+) or knock-out (−/−) mouse bone tissues. Sections of tibiae were stained with a rabbit polyclonal antibody for p-Smad1/5/8. Arrows marked p-Smad1/5/8 signal within periosteal osteoprogenitor cells. The asterisk indicates red blood cell autofluorescence. Scale bar = 100 μm. Fluorescence intensity of p-Smad1/5/8 signals was quantified by ImageJ. Data are mean ± SD (n = 5 in each group). ∗∗p < 0.01. (B) SCUBE3 modulates BMP2 signaling in primary cultured chondrocytes. Chondrocytes were isolated from +/+ and −/− mice (P2). Exogenous SCUBE3 expression was produced by SCUBE3 lentiviruses. Chondrocytes were serum-starved overnight, then stimulated with indicated doses of BMP2 for 20 min. Western blot analysis (left panel) and quantification (right panel) of BMP2-induced phosphorylation of Smad1/5/8 in chondrocytes. Data are mean ± SD from 3 independent experiments. ∗∗p < 0.01.
Figure 7
Figure 7
Ex vivo osteogenic differentiation of Scube3+/+ and Scube3−/− bone-marrow stromal cell (BMSCs) assessed by ALP activity, osteocalcin expression, and Alizarin red staining (A) ALP activity of Scube3 wild-type (+/+) and knock-out (−/−) BMSCs under osteoblast differentiation conditions at days 3, 6, 9, 12, and 15. The experiments were performed 3 times in triplicate. Data are mean ± SD mOD405, milli-absorbance units at 405 nm. ∗∗p < 0.01. (B) The protein expression of osteocalcin in +/+ and −/− BMSCs under osteoblast differentiation conditions at day 9. Two independent BMSC cultures (#1 and #2) were used for western blot analysis, and each experiment was performed 3 times. (C) Bone nodule formation in BMSC cultures under osteoblast differentiation conditions (right panel). Quantification of Alizarin red staining (left panel). The experiments were performed 3 times in triplicate. Data are mean ± SD. p < 0.05; ∗∗p < 0.01. (D) The mRNA expression of direct targets of BMP signal activity and osteoblast marker genes in +/+ and −/− BMSCs under osteoblast differentiation conditions at day 9. The experiments were performed 3 times in triplicate. Data are mean ± SD. ∗∗p < 0.01.

References

    1. Hynes R.O. The extracellular matrix: not just pretty fibrils. Science. 2009;326:1216–1219. - PMC - PubMed
    1. Walma D.A.C., Yamada K.M. The extracellular matrix in development. Development. 2020;147:dev175596. - PMC - PubMed
    1. Bonnans C., Chou J., Werb Z. Remodelling the extracellular matrix in development and disease. Nat. Rev. Mol. Cell Biol. 2014;15:786–801. - PMC - PubMed
    1. Wu M., Chen G., Li Y.P. TGF-β and BMP signaling in osteoblast, skeletal development, and bone formation, homeostasis and disease. Bone Res. 2016;4:16009. - PMC - PubMed
    1. Salazar V.S., Gamer L.W., Rosen V. BMP signalling in skeletal development, disease and repair. Nat. Rev. Endocrinol. 2016;12:203–221. - PubMed

Publication types

MeSH terms

Substances