. 2020 Dec 23;183(7):2003-2019.e16.
doi: 10.1016/j.cell.2020.11.015. Epub 2020 Dec 11.

A Molecular Calcium Integrator Reveals a Striatal Cell Type Driving Aversion

Affiliations

A Molecular Calcium Integrator Reveals a Striatal Cell Type Driving Aversion

Christina K Kim et al. Cell. .

Abstract

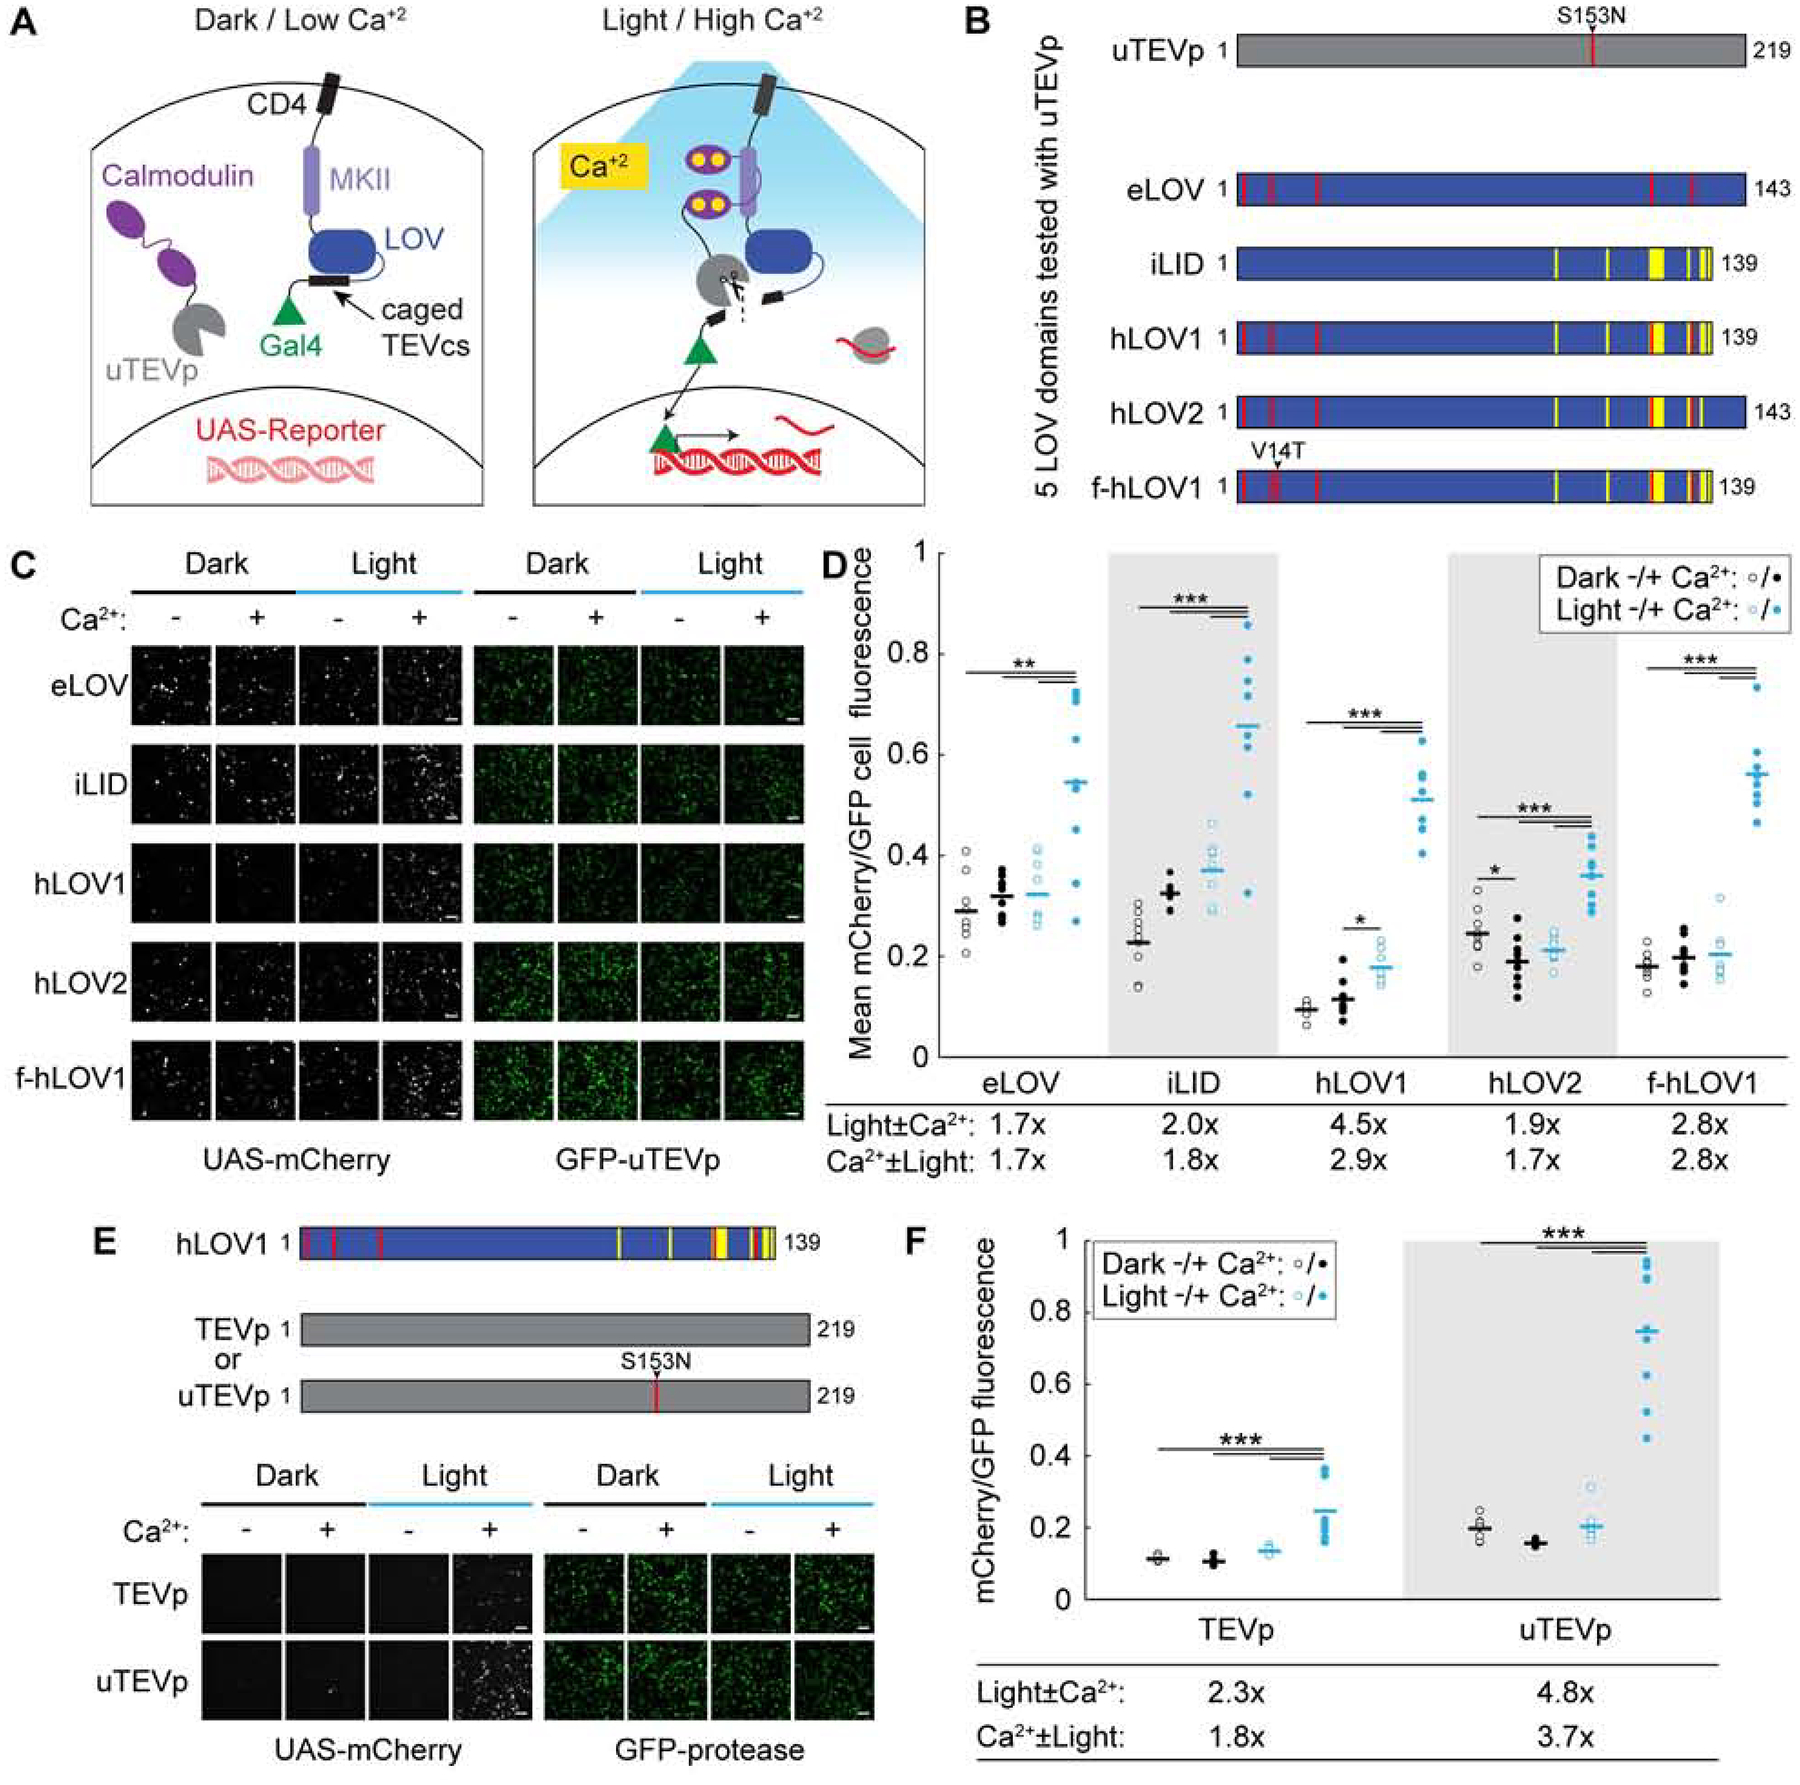
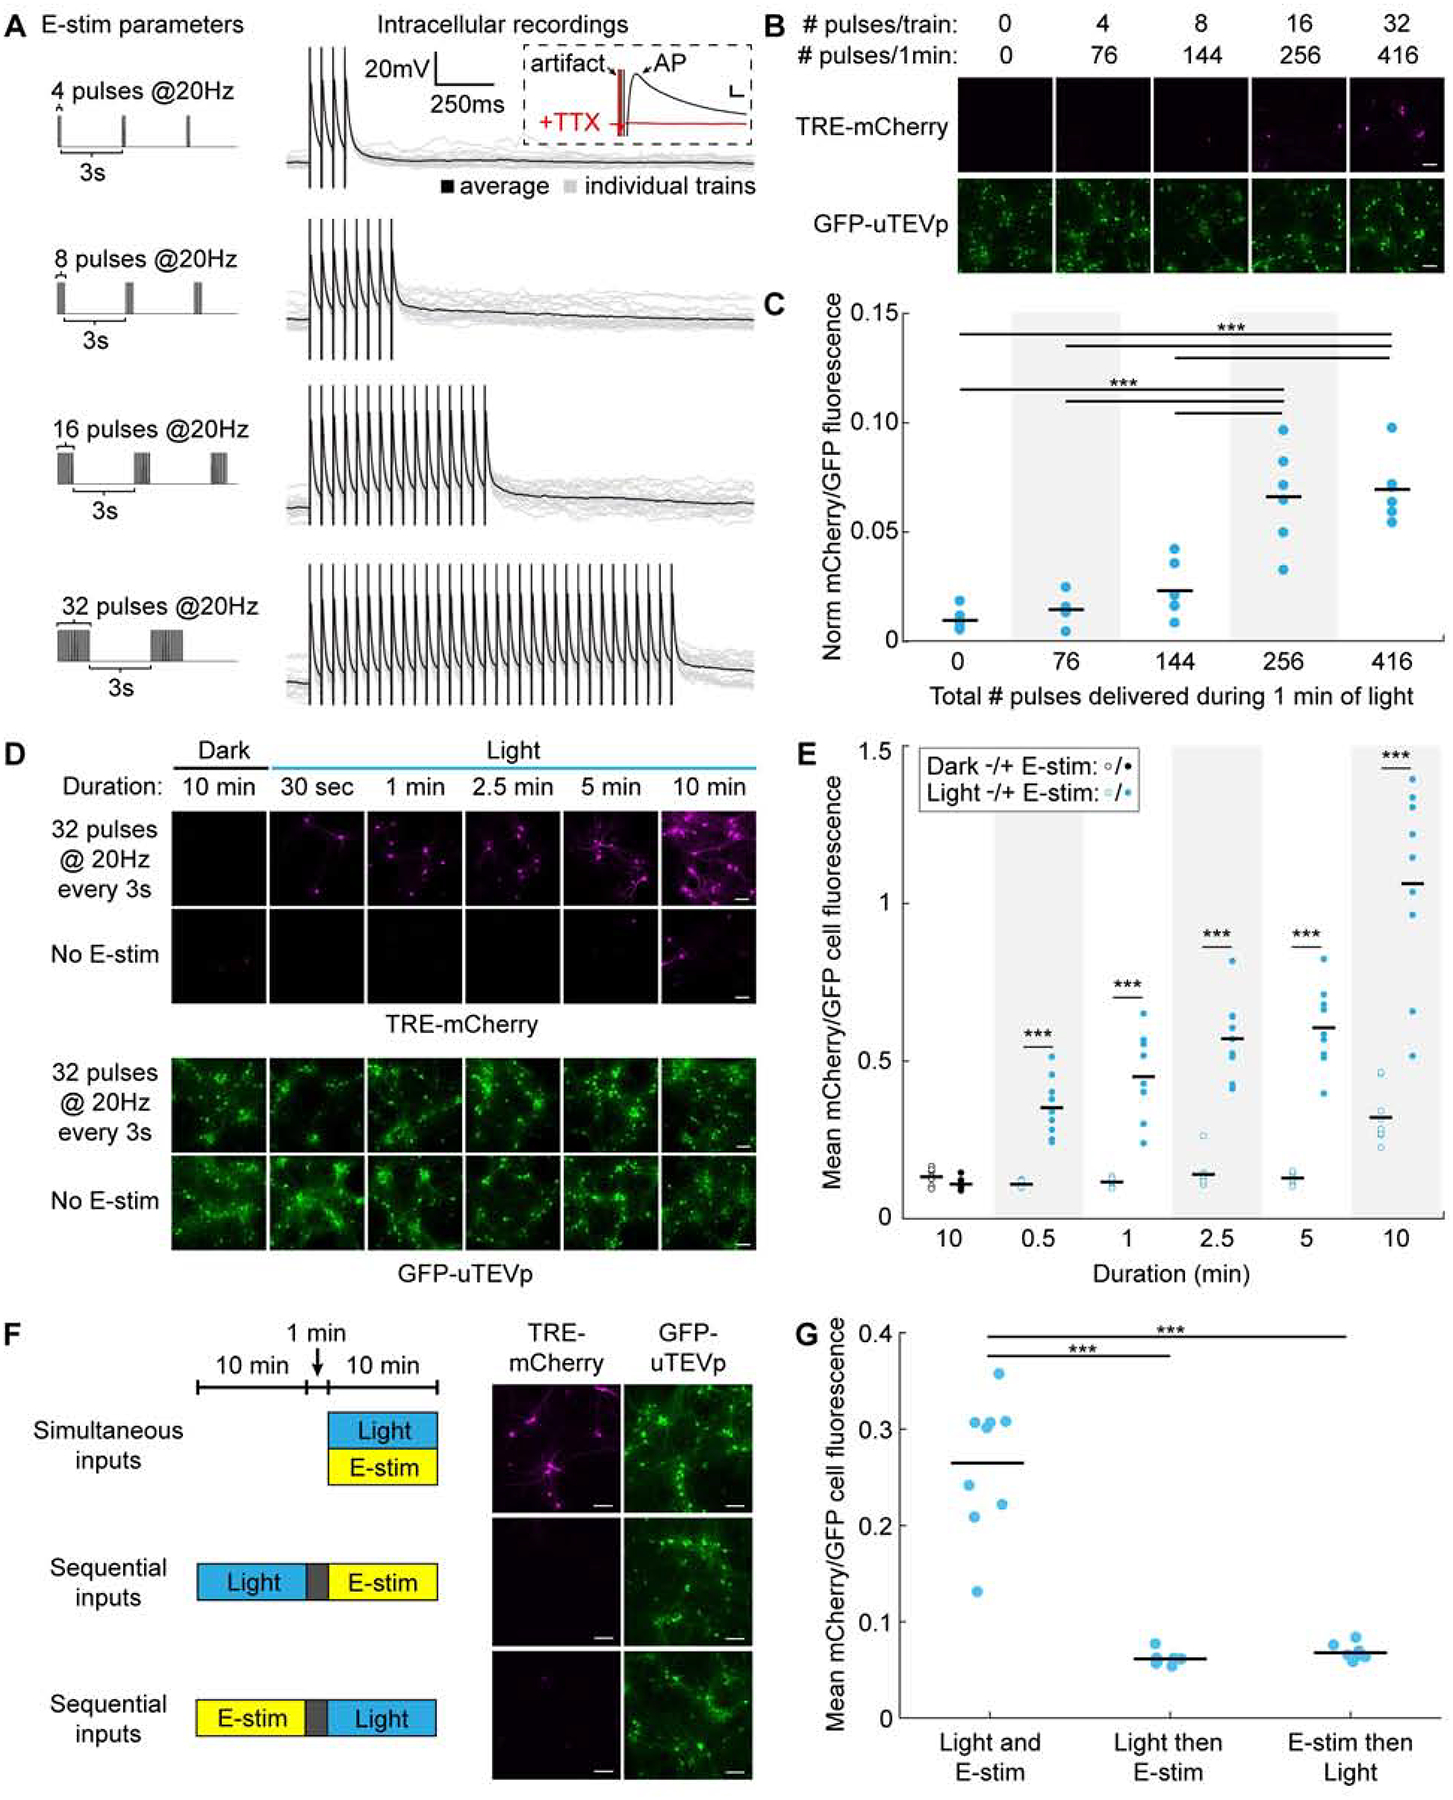
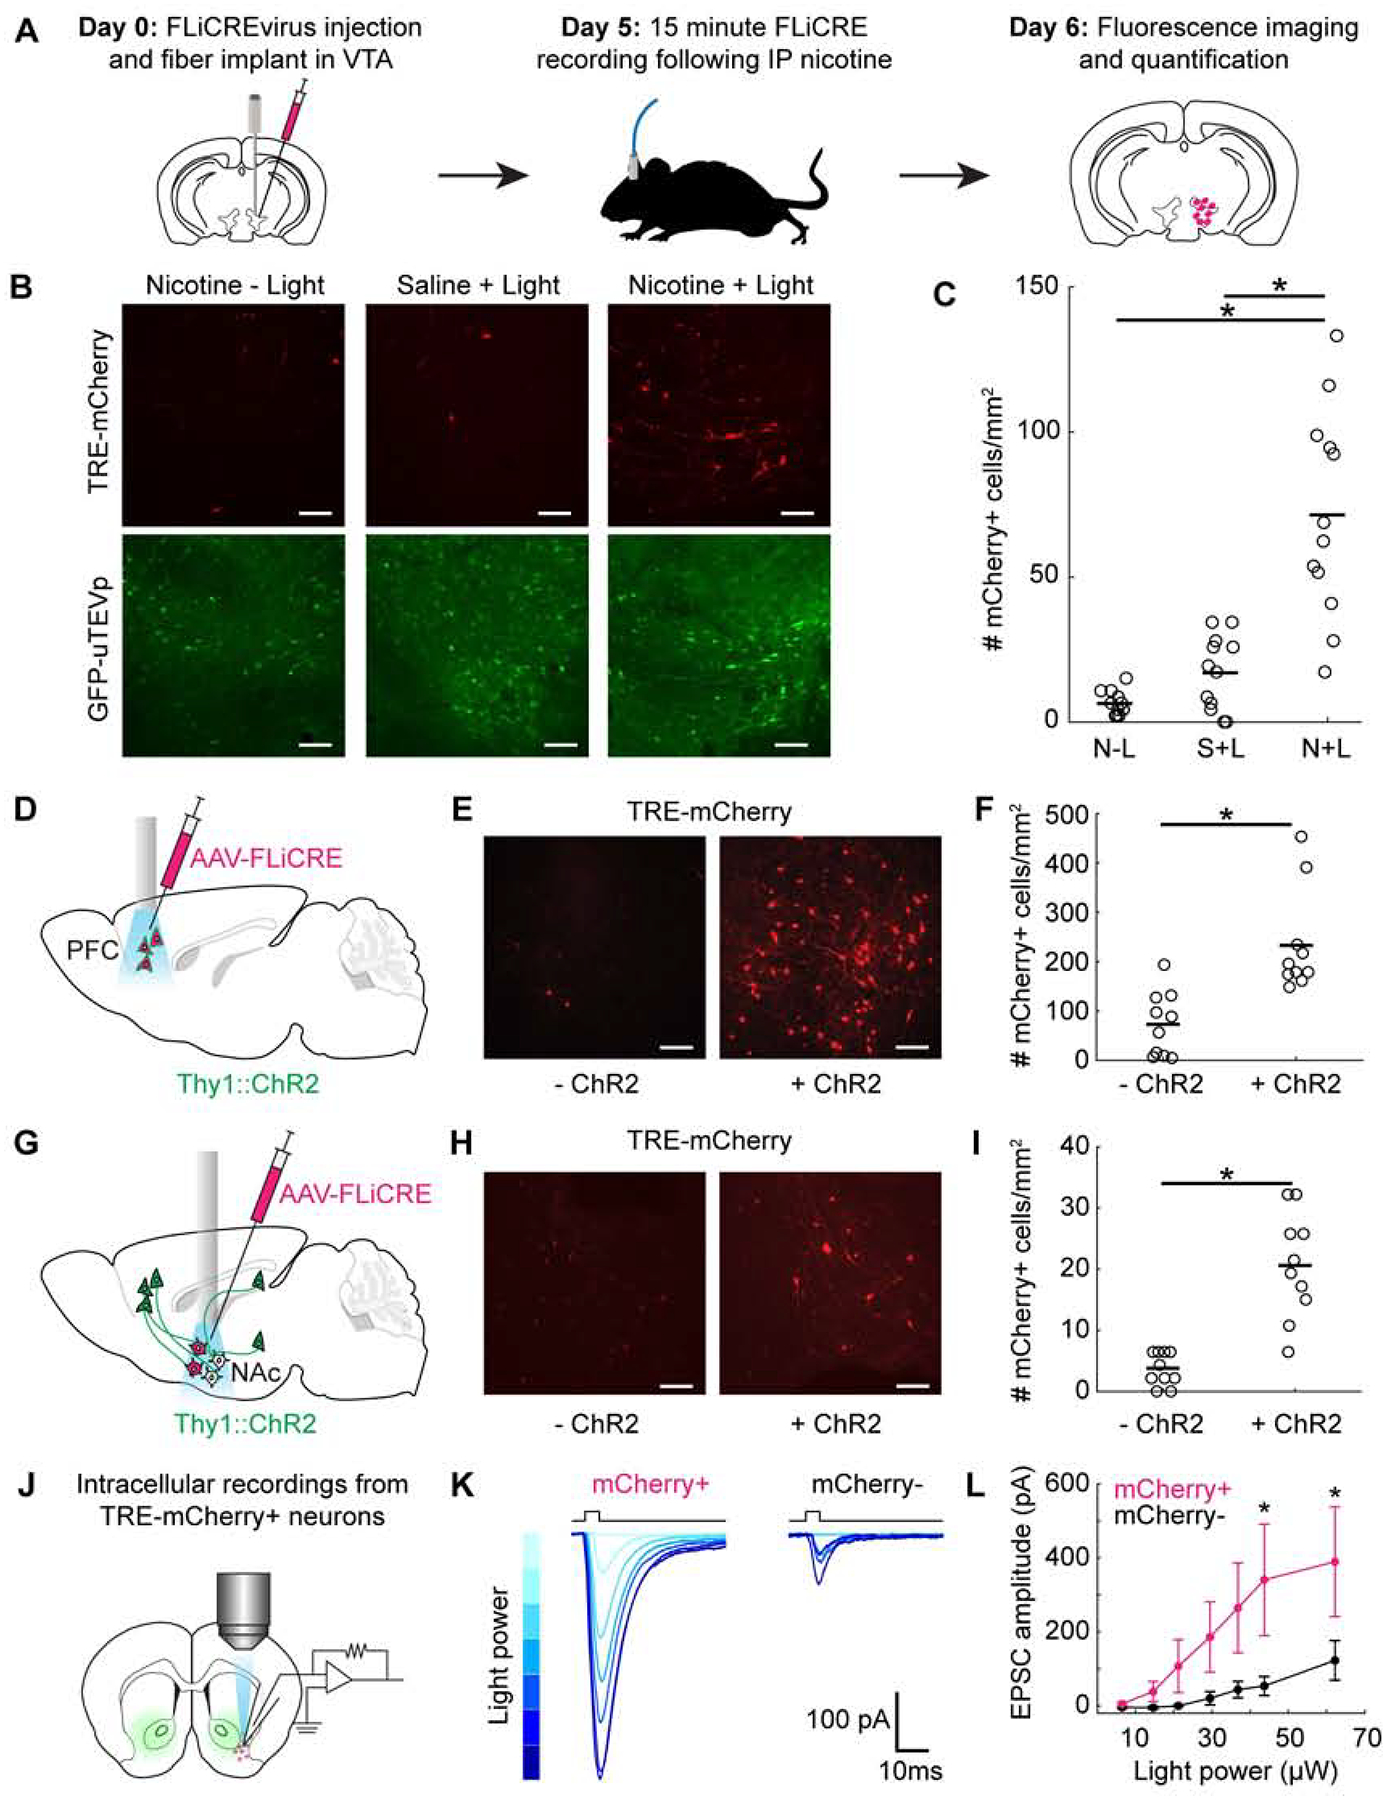
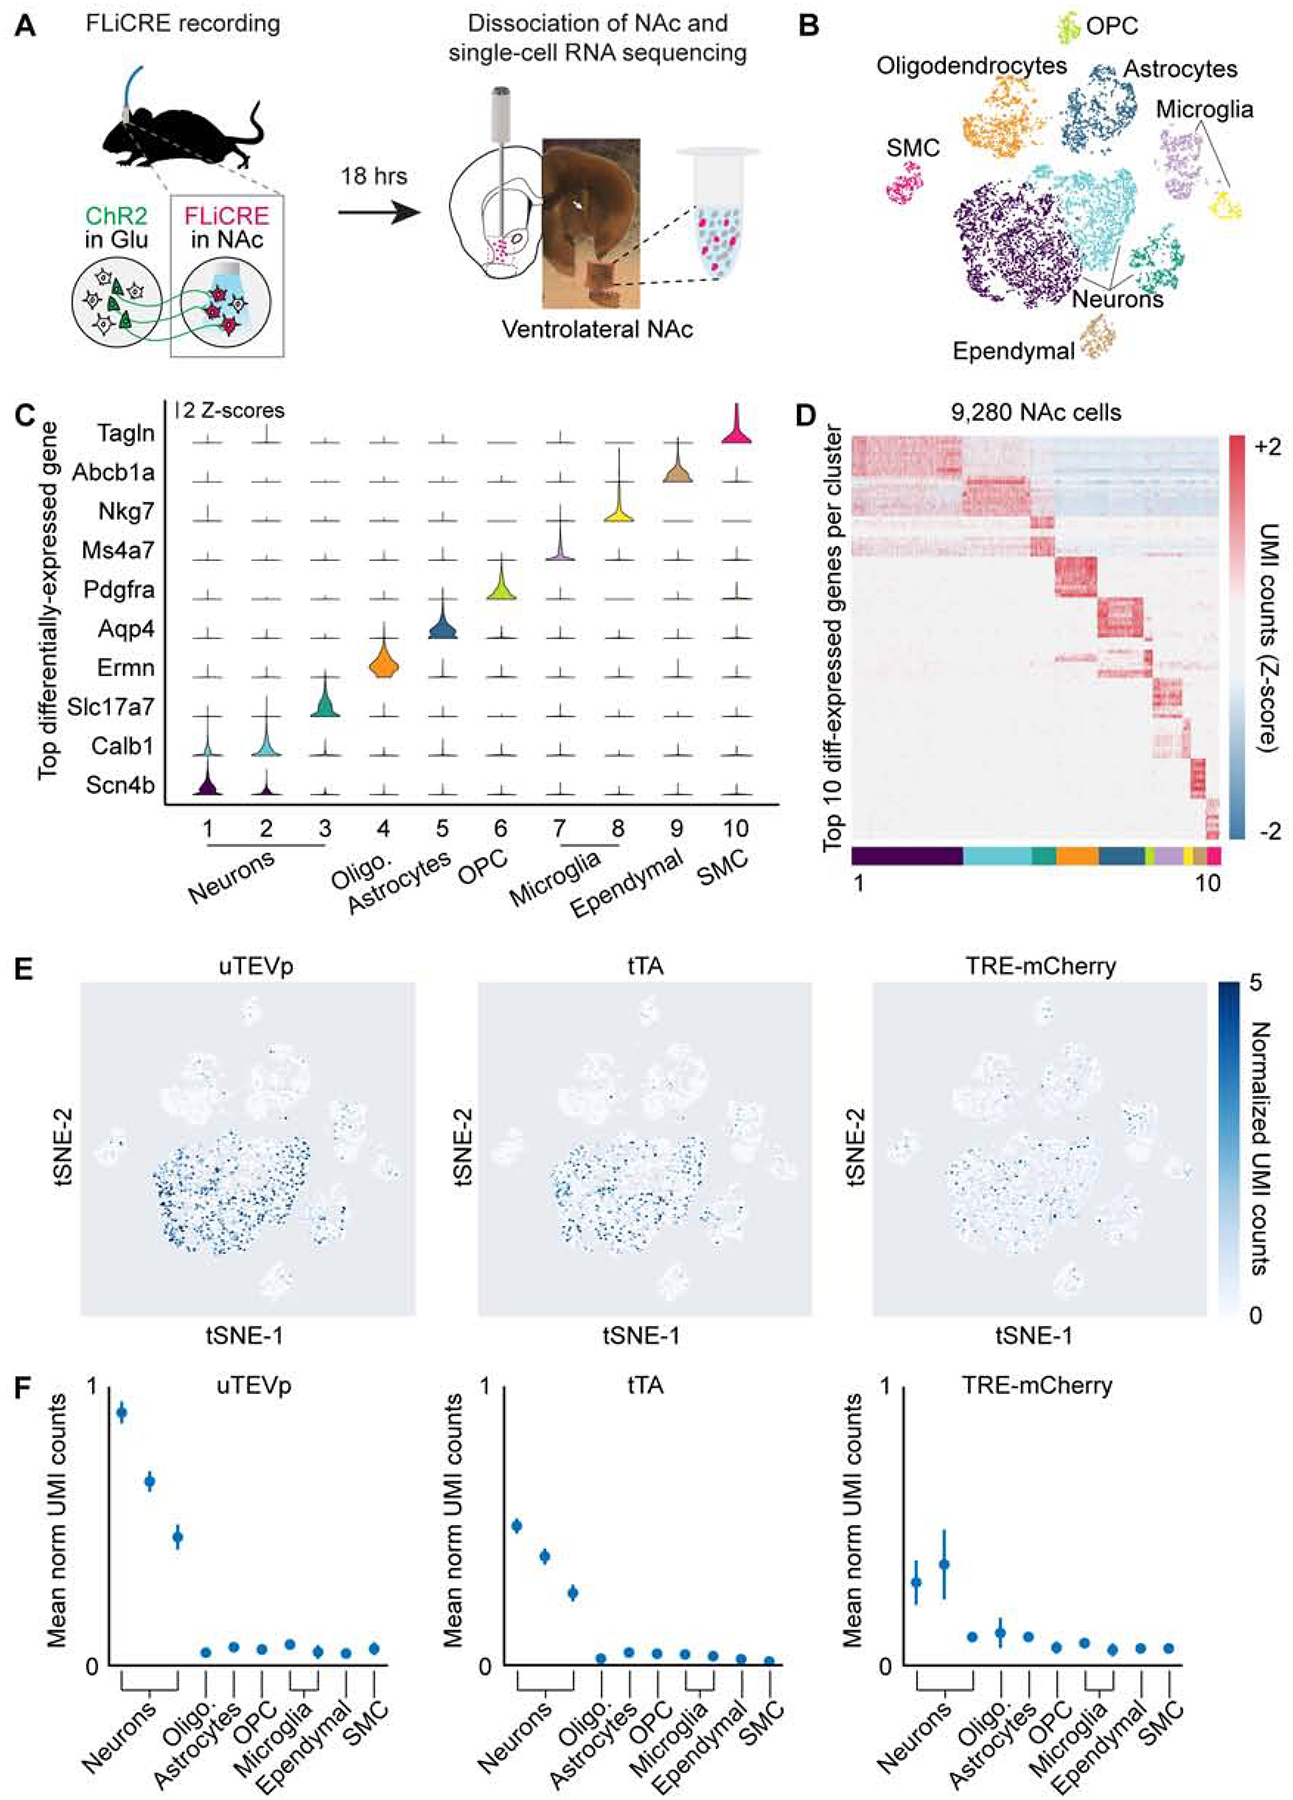
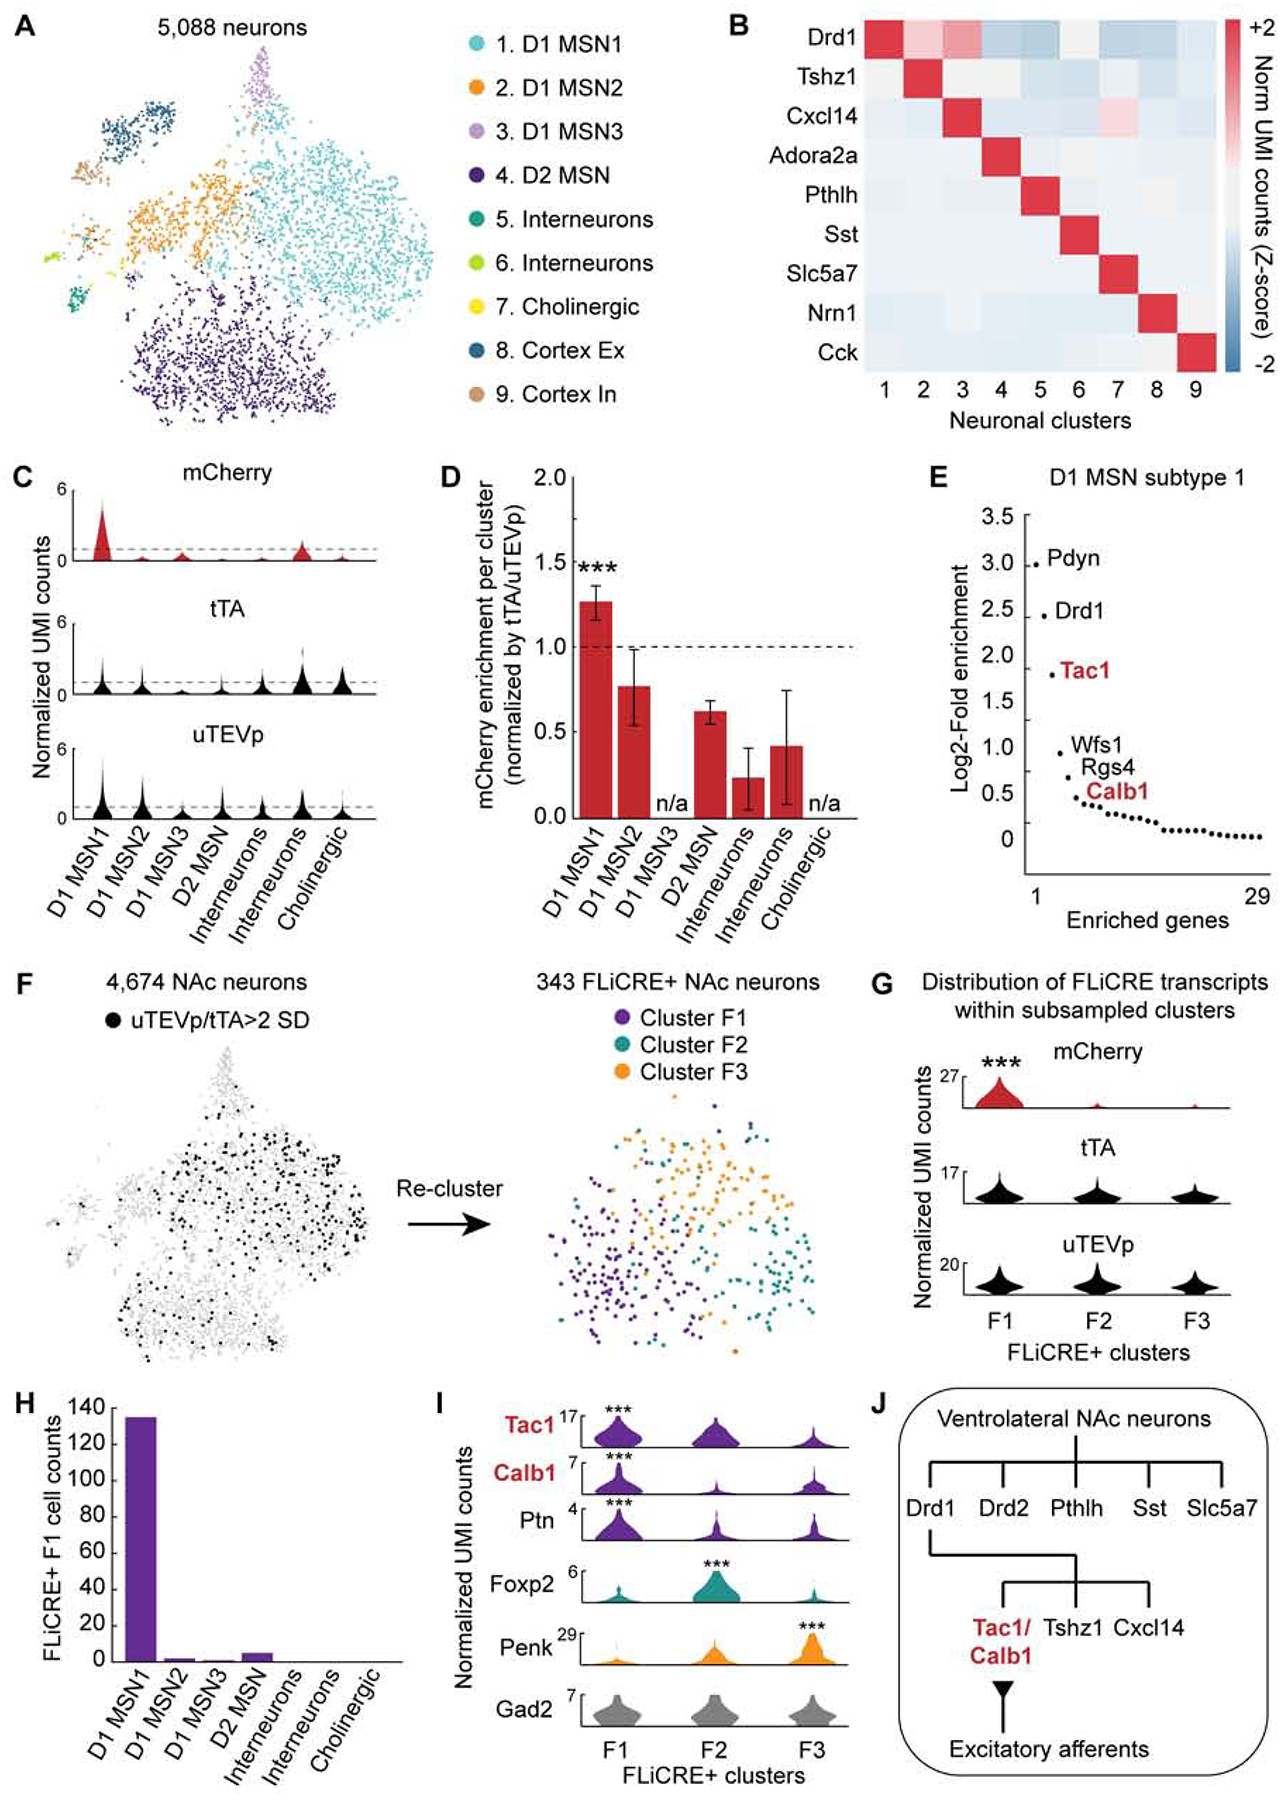
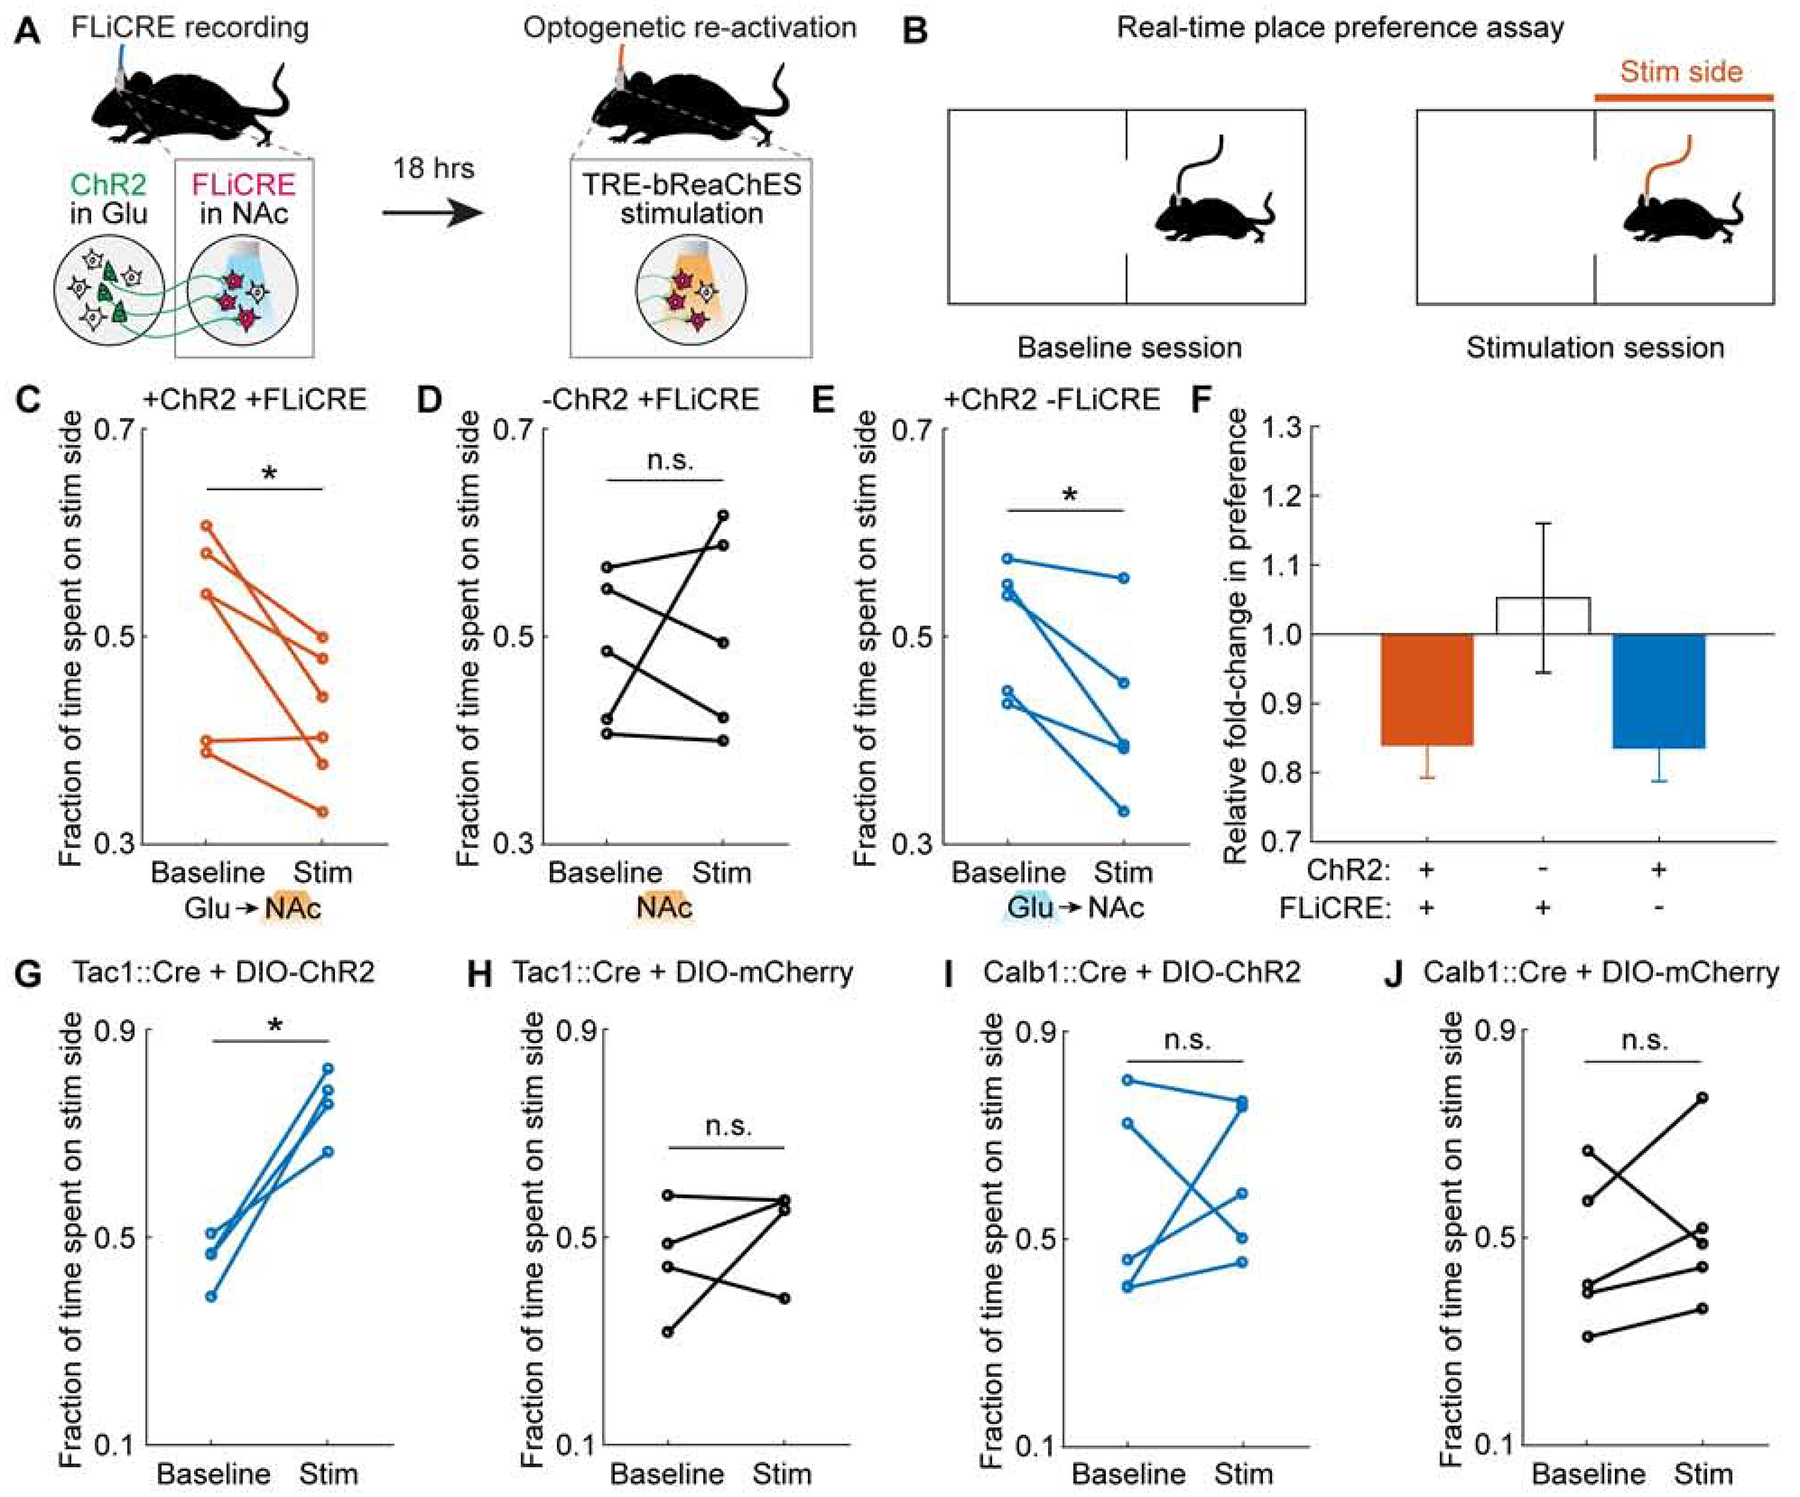
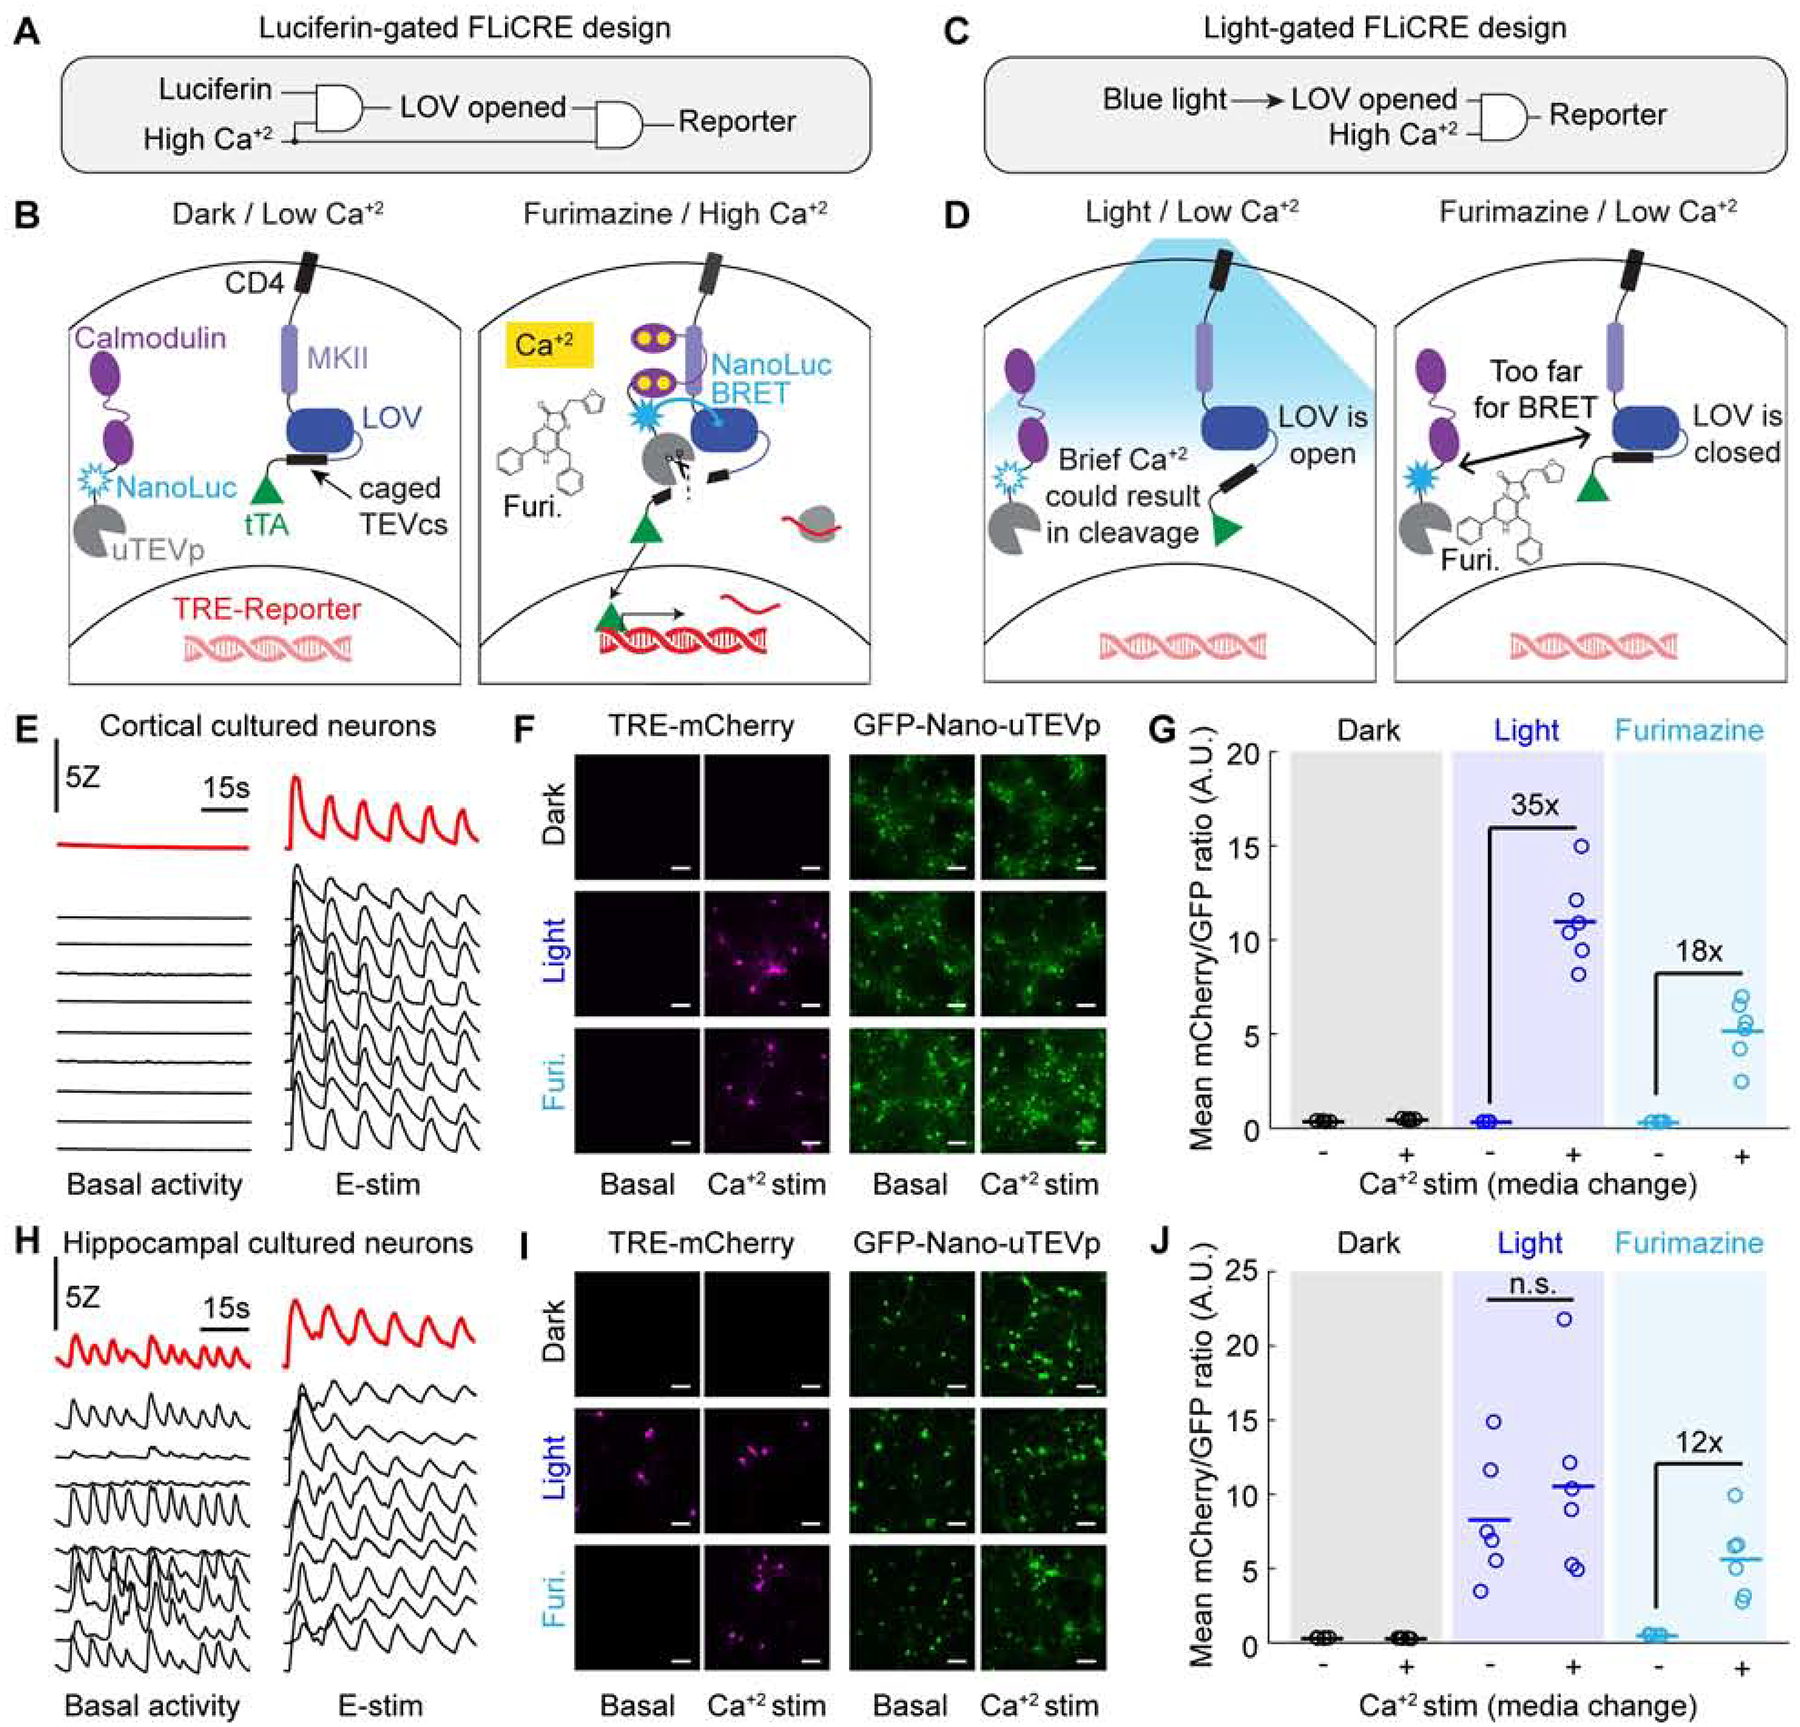
The ability to record transient cellular events in the DNA or RNA of cells would enable precise, large-scale analysis, selection, and reprogramming of heterogeneous cell populations. Here, we report a molecular technology for stable genetic tagging of cells that exhibit activity-related increases in intracellular calcium concentration (FLiCRE). We used FLiCRE to transcriptionally label activated neural ensembles in the nucleus accumbens of the mouse brain during brief stimulation of aversive inputs. Using single-cell RNA sequencing, we detected FLiCRE transcripts among the endogenous transcriptome, providing simultaneous readout of both cell-type and calcium activation history. We identified a cell type in the nucleus accumbens activated downstream of long-range excitatory projections. Taking advantage of FLiCRE's modular design, we expressed an optogenetic channel selectively in this cell type and showed that direct recruitment of this otherwise genetically inaccessible population elicits behavioral aversion. The specificity and minute resolution of FLiCRE enables molecularly informed characterization, manipulation, and reprogramming of activated cellular ensembles.

Keywords: aversion; calcium; light; neural activity; optogenetics; single-cell RNA sequencing; striatum; transcription factor.


Conflict of interest statement

Declaration of Interests A.Y.T. and M.I.S. have filed a patent covering some components used in this study (US provisional application 62/906,373; CZB file CZB-123S-P1; Stanford file S19-269; KT file 103182-1132922-002400PR).

Figures

Figure 1.
Figure 1.. Design and characterization of FLiCRE in cultured HEK293T cells.
(A) Schematic of FLiCRE. In the basal state (dark/low Ca2+), a non-native transcription factor (Gal4) is tethered to the cell membrane via CD4, MKII, LOV, and TEVcs (TEV cleavage site). LOV cages the TEVcs in its inactivated dark state. An evolved TEV protease (uTEVp) is fused to calmodulin (CaM) and expressed cytosolically. In the presence of high Ca2+, CaM and MKII interact, bringing uTEVp into proximity of TEVcs, which is only accessible for cleavage when LOV is activated by blue light. Thus both high intracellular Ca2+ and blue light are required for Gal4 release and translocation to the nucleus to drive expression of a UAS-reporter. (B) Optimization of FLiCRE’s LOV domain. Construct designs of five different LOV domains tested with uTEVp (S153N mutation) in FLiCRE. (C) FLiCRE’s performance in HEK293T cells transfected with GFP-CaM-uTEVp, UAS-mCherry, and a transmembrane CD4-MKII-LOV-TEVcs-Gal4 component where LOV is one of the 5 LOV variants in panel B. Example fluorescence images of UAS-mCherry activation expression (left) and GFP-CaM-uTEVp expression (right), taken ~8 hrs after 10 min of treatment with Ca2+ and blue light, alongside control conditions. Scale bars, 100 μm. (D) Quantification of experiment in panel C. Data represent the mCherry/GFP fluorescence intensity ratio averaged across all cells in a FOV. For all LOV variants, there was a higher mCherry/GFP ratio in the light + Ca2+ condition compared to control conditions (N = 9 FOVs per condition, 2-way ANOVA interaction F(1,32)eLOV=8.97, F(1,32)iLID=9.87, F(1,32)hLOV1=115.35, F(1,32)hLOV2=48.84, F(1,32)f-hLOV1=99.74, P < 0.01; Tukey’s multiple comparison’s test, ***P < 0.001, *P < 0.05). (E) Comparison of FLiCRE performance in HEK293T cells transfected with CD4-MKII-hLOV1-TEVcs-Gal4, UAS-mCherry, and either GFP-CaM-TEVp or -uTEVp. Fluorescence images of UAS-mCherry activation and GFP-CaM-TEVp/uTEVp expression following 5 min of Ca2+ and blue light. Scale bars, 100 μm. (F) Quantification of experiment in panel E. For both TEVp and uTEVp, there was a higher mCherry/GFP fluorescence ratio in the light + Ca2+ condition compared to control conditions (N = 9 FOVs per condition, 2-way ANOVA interaction F(1,32)TEVp=17.41, F(1,32)uTEVp=84.73, P < 0.001; Tukey’s multiple comparison’s test, ***P < 0.0001). See also Figure S1.
Figure 2.
Figure 2.. Characterization of FLiCRE’s sensitivity and reversibility in cultured neurons.
(A) Left: Electric field stimulation (E-stim) parameters used to elicit action potentials during FLiCRE recordings. Right: Intracellular patchclamp recordings in uninfected neurons showing that E-stim pulses elicit single action potentials (100% fidelity in spiking across N = 4 cells and 20 trials each). Inset: action potentials were blocked with TTX. Scale bars, 10mV and 5ms. (B) Relationship between action potential firing and FLiCRE activation. For FLiCRE expression in neurons, CD4 was replaced with a truncated Neurexin3B fragment, Gal4 replaced with tTA, and a TRE-mCherry reporter gene was used. Fluorescence images of TRE-mCherry activation and GFP-CaM-uTEVp expression were taken ~18 hrs following 1min of light and E-stim (same parameters as in panel A). Scale bars, 100 μm. (C) Quantification of experiment in panel B. Data represent the mCherry/GFP fluorescence intensity ratio averaged across all cells in a FOV, normalized by subtracting the background mCherry channel value. There was a higher mCherry/GFP fluorescence ratio in the light + Ca2+ compared to light − Ca2+ condition when 256 and 416 pulses were delivered (N = 6 FOVs per condition, 1-way ANOVA F(4,25)=25.43, P = 1.70e-8; Sidak’s multiple comparison’s test, ***P < 0.001). (D) Relationship between duration of recording and FLiCRE activation. Fluorescence images of TRE-mCherry activation and GFP-CaM-uTEVp expression following light and E-stim (32 pulses at 20Hz every 3s) delivered for varying times. Scale bars, 100 μm. (E) Quantification of experiment in panel D. There was a higher mCherry/GFP fluorescence ratio in the light + E-stim condition compared to light − E-stim condition across all durations tested (N = 9 FOVs per condition, 2-way ANOVA interaction F(4,64)=10.63, P < 0.0001; Sidak’s multiple comparison’s test, ***P < 0.001). (F) Testing the temporal resolution of FLiCRE. Light and E-stim were delivered either simultaneously for 10 min or staggered by 1 min in either direction. Fluorescence images of TRE-mCherry activation and GFP-CaM-uTEVp expression marker. Scale bars, 100 μm. (G) Quantification of experiment in panel F. The mCherry/GFP fluorescence ratio was higher in the simultaneous light and E-stim condition compared to the temporally staggered conditions (N = 9 FOVs per condition, 1-way ANOVA F(2,24)=72.6, P = 6.30e-11; Tukey’s multiple comparison’s test, ***P < 0.0001). See also Figures S1,S2.
Figure 3.
Figure 3.. Application of FLiCRE to detect activated neuronal ensembles in vivo.
(A) Timeline for in vivo FLiCRE injection, recording, and read-out in mice. hLOV1 FLiCRE viruses were injected in the VTA and an optical fiber was implanted above VTA. On day 5, mice were injected with 1.5mg/kg nicotine or saline intraperitoneally (IP), and 470nm light was delivered through an optical fiber to the VTA for 15 min. On day 6, mice were sacrificed. (B) Fluorescence images of FLiCRE TRE-mCherry reporter expression ~18 hrs following treatment with nicotine and blue light, or in control conditions omitting blue light (left) or nicotine (middle). Scale bars, 100 μm. (C) Quantification of experiment in panel B. Data show the mean number of mCherry+ cells/mm2 per FOV. There were more mCherry+ VTA cells in mice treated with nicotine and blue light compared to in control mice (N = 12 brain slices from 3 mice, each condition; 1-way ANOVA F(2,33)=, P =3.84e-8; Tukey’s multiple comparison’s test, ***P < 0.0001). (D) Injection and optical fiber implant schematic for FLiCRE recording during optogenetic stimulation of PFC cell bodies. hLOV1 FLiCRE viruses were injected in the PFC of Thy1::ChR2 transgenic mice, and an optical fiber was implanted in PFC. (E) Fluorescence images of TRE-mCherry FLiCRE reporter expression following 10 min of blue light delivered in ChR2+ and ChR2− (wildtype control) mice. Scale bars, 100 μm. (F) Quantification of experiment in panel E. Data show the mean number of mCherry+ cells/mm2 per FOV. There were more mCherry+ PFC cells in ChR2+ versus in ChR2− mice (N = 10 brain slices from 5 mice, each condition; Wilcoxon’s ranksum test, *P = 7.7e-4, U=150). (G) Injection and optical fiber implant schematic for FLiCRE recording of trans-synaptically activated neurons during optogenetic axonal stimulation. hLOV1 FLiCRE viruses were injected in the NAc of Thy1::ChR2 transgenic mice, and an optical fiber was implanted in NAc. (H) Fluorescence images of FLiCRE TRE-mCherry reporter expression following 10 min of simultaneous upstream axonal optogenetic stimulation and downstream somatic FLiCRE recording with blue light in ChR2+ and ChR2− mice. Scale bars, 100 μm. (I) Quantification of experiment in panel H. There were more mCherry+ NAc cells detected in ChR2+ versus in ChR2− mice (N = 10 brain slices from 5 mice, each condition; Wilcoxon’s ranksum test, *P = 2.9e-4, U=153). (J) Schematic for testing specificity of FLiCRE labeling of activated neurons using intracellular patching in acute ex vivo slices. An hLOV1 FLiCRE experiment was performed as in panel G. ~18 hrs later, patch clamp recordings were made from mCherry+ and mCherry− NAc neurons during brief pulses of blue light to elicit ChR2 axonal stimulation. (K) Example EPSCs from mCherry+ and mCherry− neurons recorded across increasing blue light powers. Light powers correspond to x-axis data points in panel L. (L) Quantification of experiment in panel K. mCherry+ NAc neurons had larger EPSCs than mCherry− NAc neurons at the light powers indicated (N = 6 mCherry+ and 5 mCherry− neurons; 2-way ANOVA interaction F(6,54)=2.44, P = 3.7e-2; Fisher’s LSD, *P < 0.05). See also Figure S3.
Figure 4.
Figure 4.. Detection of FLiCRE components using single-cell RNA sequencing.
(A) Schematic for scRNA-seq following hLOV1 FLiCRE recording during afferent excitatory axon stimulation in NAc (as in Figure 3E). Single-cell libraries were generated using 10X Genomics kits and sequenced using Illumina Nextseq. (B) t-distributed stochastic neighbor embedding (t-SNE) of ~10,000 cells passing quality control metrics, colored by clustering analysis. Data clustered using unsupervised K-means clustering (cells pooled across 3 experimental replicates from 5 mice). (C) Violin plots of the top-differentially expressed gene identified per cluster. Y-axis represents Z-scored normalized UMI counts (see STAR Methods). (D) Heatmap of the top 10-differentially expressed genes identified per cluster. Normalized UMI counts for each gene were Z-scored across clusters. (E) Heatmap of normalized UMI counts detecting uTEVp, tTA, and mCherry across all cells plotted in t-SNE space. (F) Mean normalized UMI counts calculated for cells in each cluster type. FLiCRE transcripts were detected in cell clusters corresponding to neurons.
Figure 5.
Figure 5.. Simultaneous transcriptomic and calcium history read-out with FLiCRE.
(A) t-SNE embedding of ~5,000 neurons, sub-clustered from cell clusters 1–3 in Figure 4C. Data re-colored and annotated across 9 identified neuronal clusters (K-means). (B) Heatmap of cell-type specific marker genes identified per cluster. Normalized UMI counts for each gene were Z-scored across clusters. (C) Violin plots of the distribution of normalized UMI counts of mCherry, tTA, and uTEVp within each cluster. The horizontal dashed line indicates a normalized UMI count of 1. (D) Enrichment of mCherry+ neurons, normalized by the number of FLiCRE+ neurons in each cluster (see STAR Methods). The D1 MSN1 cluster is enriched in mCherry+ neurons (N = 3 experimental replicates, Binomial test, 0.05 FDR corrected ***P = 3.17e-8). (E) Enriched genes in the D1 MSN1 cluster compared to all other clusters. Y-axis represents the Log2 ratio of expression in neuronal cluster 1 compared to in all other cells. (Negative binomial test, corrected for multiple comparison’s using the Benjamini-Hochberg procedure, 0.1 FDR). (F) Left: t-SNE embedding of neurons from panel A, thresholded by uTEVp or tTA transcript expression. FLiCRE+ black cells have uTEVp/tTA UMI counts > 2 standard deviations (SD) of the mean. Right: t-SNE embedding of re-clustered FLiCRE+ neurons reveals 3 sub-types, F1–F3. (G) Violin plots of the distribution of normalized UMI counts of mCherry, tTA, and uTEVp within each sub-sampled cluster (Binomial test, 0.10 FDR corrected ***P < 0.1). Y-axis represents normalized UMI counts. (H) The number of subsampled F1 cluster cells that belong to each broader neuronal cluster found in panel A. The majority of F1 cluster cells belong to D1 MSN subtype 1. (I) Violin plots of the distribution of all differentially expressed genes identified per subsampled cluster. Cluster F1 was enriched with Tac1, Calb1, and Ptn; Cluster F2 was enriched with Foxp2; and cluster F3 was enriched with Penk (Binomial test, 0.10 FDR corrected ***P < 0.1). Violin plots for control gene Gad2 are shown in grey. Y-axis represents normalized UMI counts. (J) Schematic of the summary of findings from the RNA-seq and FLiCRE experiment. See also Figures S4 and S5.
Figure 6.
Figure 6.. Control of behavioral function by manipulating previously-activated neuronal ensembles labeled with FLiCRE.
(A) Schematic of experimental timeline. hLOV1 FLiCRE recording was performed during 10 min of excitatory axonal stimulation in NAc (as in Figure 3E using Thy1::Chr2 mice); but using aTRE-mCherry-p2a-bReaChES red-shifted excitatory opsin as the reporter. ~18 hrs later, orange light was delivered to re-activate the NAc neurons labeled during the FLiCRE recording. (B) Schematic of real-time place preference (RTPP) test. During the baseline session (Baseline), mice freely explore a two-sided chamber. During the stimulation session (Stim), light is delivered through the optical fiber when the mouse is on one side of the chamber (Stim side). The time spent on the stimulation side was compared during the Stim versus Baseline session. (C) RTPP results during orange light stimulation of TRE-bReaChES-expressing NAc cell bodies (labeled by FLiCRE during axonal stimulation of Thy1::Chr2 mice as in panel A). Mice avoided the Stim side (N = 6 mice; Student’s paired t-test, *P = 2.2e-2, t(5)=3.26). (D) RTPP results during orange light delivery to NAc cell bodies in wildtype mice (FLiCRE labels spontaneously active neurons). Mice do not consistently prefer or avoid the Stim side (N = 5 mice; Student’s paired t-test, n.s. P = 0.71, t(4)=0.41). (E) RTPP results during blue light stimulation of ChR2 excitatory afferent axons in NAc of Thy1::ChR2 mice (not expressing FLiCRE). Mice avoided the Stim side (N = 5 mice; Student’s paired t-test, *P = 2.7e-2, t(4)=3.41). (F) Summary of fold-change in preference for stimulation side from data in panels C-E. (G,H) Tac1::Cre mice were injected in NAc with either Cre-dependent ChR2 (DIO-ChR2) or DIO-mCherry, and then underwent the RTPP test during blue light delivery in NAc. ChR2− expressing mice preferred the Stim side (NChR2 = 4 mice, Student’s paired t-test, *P = 0.01, t(3) = 5.71). Control mCherry-expressing mice exhibited no change in preference for the Stim side (NmCherry = 4 mice, Student’s paired t-test, n.s. P = 0.41, t(3) = 0.95). (I,J) Calb1::Cre mice were injected in NAc with either DIO-ChR2 or DIO-mCherry, and then underwent the RTPP test during blue light delivery in NAc. There was no change in preference for the Stim side in either cohort (NChR2 = 5 mice, Student’s paired t-test, n.s. P = 0.61, t(5) = 0.55; NmCherry = 5 mice, Student’s paired t-test, n.s. P = 0.50, t(3) = 0.74). See also Figure S6.
Figure 7.
Figure 7.. A versatile luciferin-gated FLiCRE design with steeper Ca2+ dependency.
(A) Logic gate schematic of luciferase-gated FLiCRE design. LOV opening is dependent on both a luciferin and high Ca2+. (B) Mechanism of luciferase-gated FLiCRE. A blue luciferase, NanoLuc, is fused between CaM and uTEVp. When NanoLuc’s chemical substrate, furimazine, is supplied to the neurons during high Ca2+ activity, NanoLuc activates LOV via proximity-induced BRET. (C) Logic gate schematic of the blue light-gated FLiCRE design. LOV opening is dependent only on blue light and not on high Ca2+. (D) Schematic of the steeper Ca2+ dependency of luciferin-gated FLiCRE compared to light-gated FLiCRE. With blue light but low Ca2+ levels, the LOV domain is always open, and brief increases in intracellular Ca2+ (such as in unstimulated hippocampal neuron cultures) can cause uTEVp cleavage. However, with luciferin-gated FLiCRE, the LOV domain remains closed when there is low Ca2+ levels even when furimazine is present. (E) GCaMP transients of cortical neurons in untreated wells (left) and wells treated with E-stim (right; 50 pulses delivered at 20Hz every 10s). Black traces represent individual cells, red traces indicate entire FOV. (F) Fluorescence images of TRE-mCherry FLiCRE reporter and GFP-CaM-NanoLuc-uTEVp expression following 15 min of high Ca2+ stimulation (fresh media change) and blue light, or high Ca2+ and furimazine. Scale bars, 100 μm. (G) Quantification of experiment in panel F. Data represent the average mCherry to GFP fluorescence intensity ratio averaged across all cells in a FOV. There was a 35-fold increase in mCherry/GFP fluorescence ratio between light ± Ca2+ conditions (N = 6 FOVs; Wilcoxon’s signrank test, *P = 0.03, W=21). There was an 18-fold increase in mCherry/GFP fluorescence ratio between furimazine ± Ca2+ conditions (N = 6 FOVs; Wilcoxon’s signrank test, *P = 0.03, W=21). (H) GCaMP transients of individual hippocampal neurons in untreated wells (left) and wells treated with E-stim (right). Black traces represent individual cells, red traces indicate entire FOV. (I) Fluorescence images of TRE-mCherry FLiCRE reporter and GFP-CaM-NanoLuc-uTEVp expression following 15 min of high Ca2+ stimulation and blue light, or high Ca2+ and furimazine, as in panel F. Scale bars, 100 μm. (J) Quantification of experiment in panel I. There was not a significant fold difference in the mCherry/GFP fluorescence ratio between light ± Ca2+ conditions (N = 6 FOVs; Wilcoxon’s signrank test, P = 0.31, W=16). There was a 12-fold increase in mCherry/GFP fluorescence ratio between furimazine ± Ca2+ conditions (N = 6 FOVs; Wilcoxon’s signrank test, *P = 0.03, W=21).

Comment in

References

    1. Al-Hasani R, McCall JG, Shin G, Gomez AM, Schmitz GP, Bernardi JM, Pyo C-O, Park SI, Marcinkiewcz CM, and Crowley NA (2015). Distinct subpopulations of nucleus accumbens dynorphin neurons drive aversion and reward. Neuron 87, 1063–1077. - PMC - PubMed
    1. Allen WE, DeNardo LA, Chen MZ, Liu CD, Loh KM, Fenno LE, Ramakrishnan C, Deisseroth K, and Luo L (2017). Thirst-associated preoptic neurons encode an aversive motivational drive. Science 357, 1149–1155. - PMC - PubMed
    1. Anzalone AV, Koblan LW, and Liu DR (2020). Genome editing with CRISPR–Cas nucleases, base editors, transposases and prime editors. Nature biotechnology, 1–21. - PubMed
    1. Arenkiel BR, Peca J, Davison IG, Feliciano C, Deisseroth K, Augustine GJ, Ehlers MD, and Feng G (2007). In vivo light-induced activation of neural circuitry in transgenic mice expressing channelrhodopsin-2. Neuron 54, 205–218. - PMC - PubMed
    1. Baylor SM, and Hollingworth S (2011). Calcium indicators and calcium signalling in skeletal muscle fibres during excitation–contraction coupling. Progress in biophysics and molecular biology 105, 162–179. - PMC - PubMed

Publication types