. 2020 Dec 21;55(6):723-736.e8.
doi: 10.1016/j.devcel.2020.11.024. Epub 2020 Dec 11.

Actin-Membrane Release Initiates Cell Protrusions

Affiliations

Actin-Membrane Release Initiates Cell Protrusions

Erik S Welf et al. Dev Cell. .

Abstract

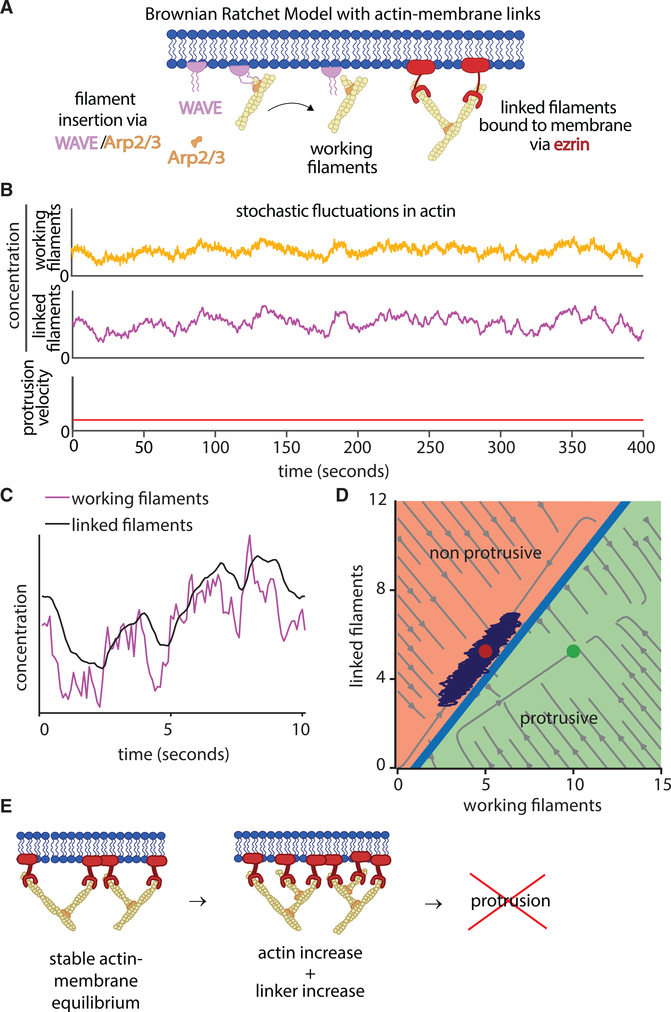
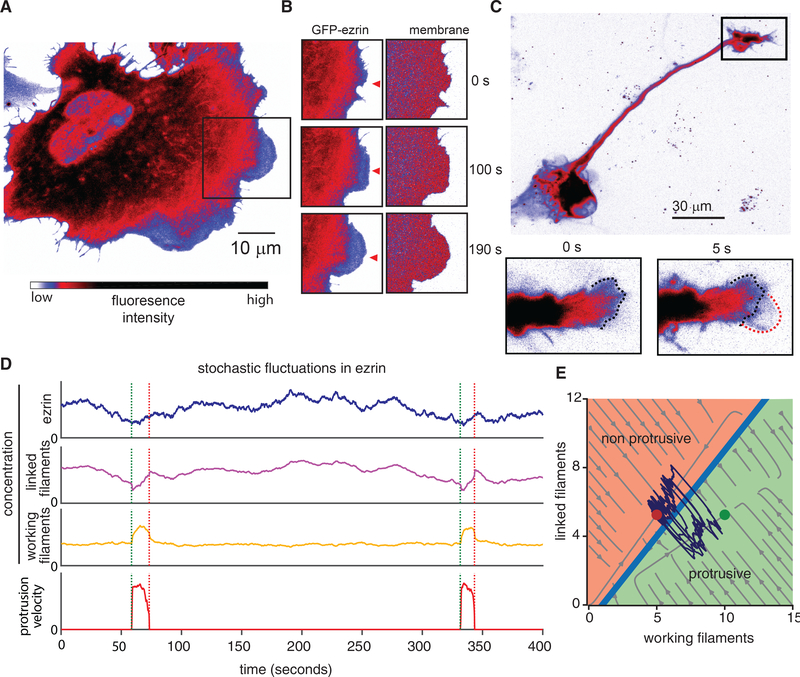
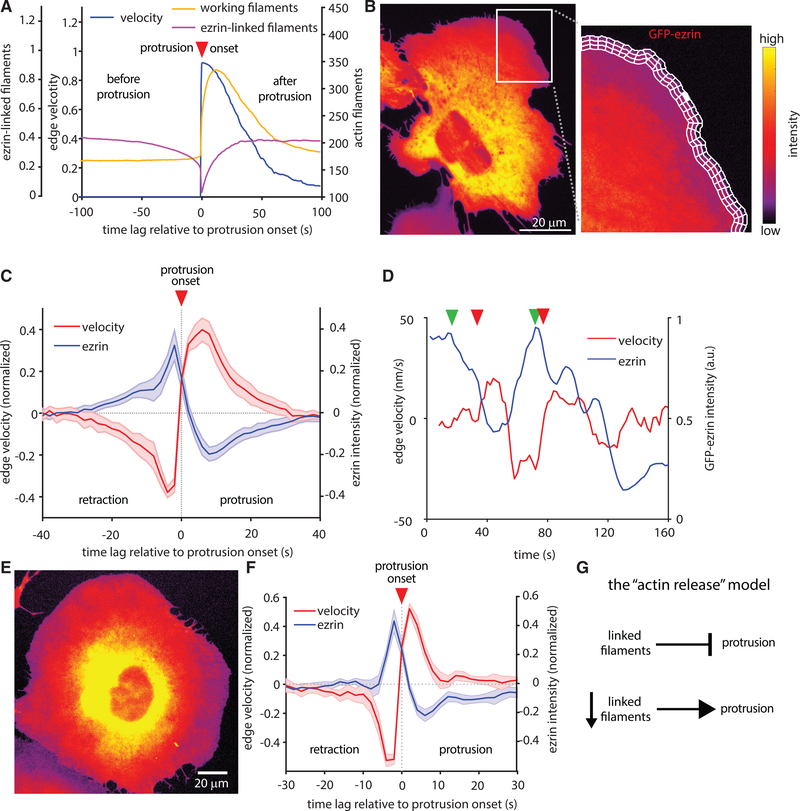
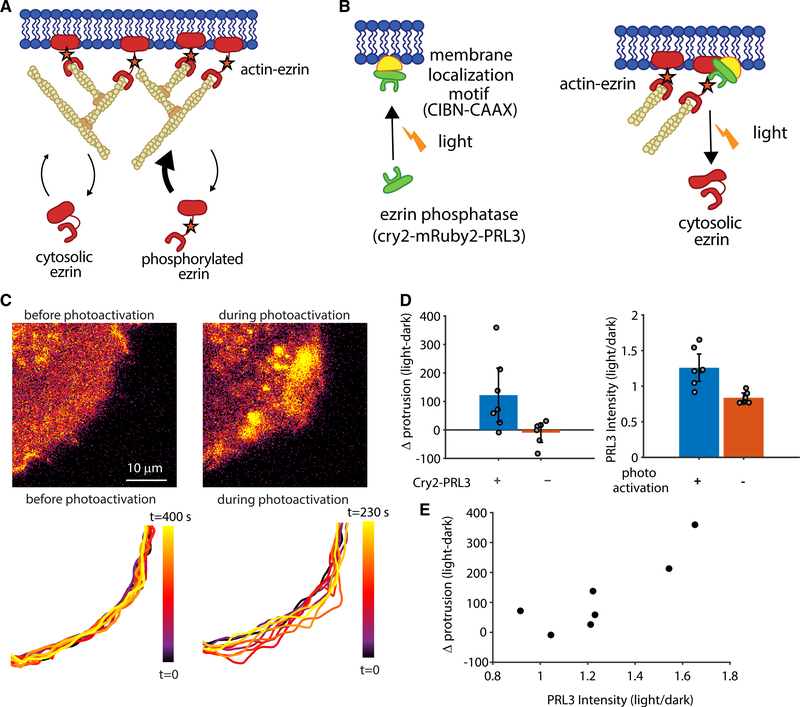
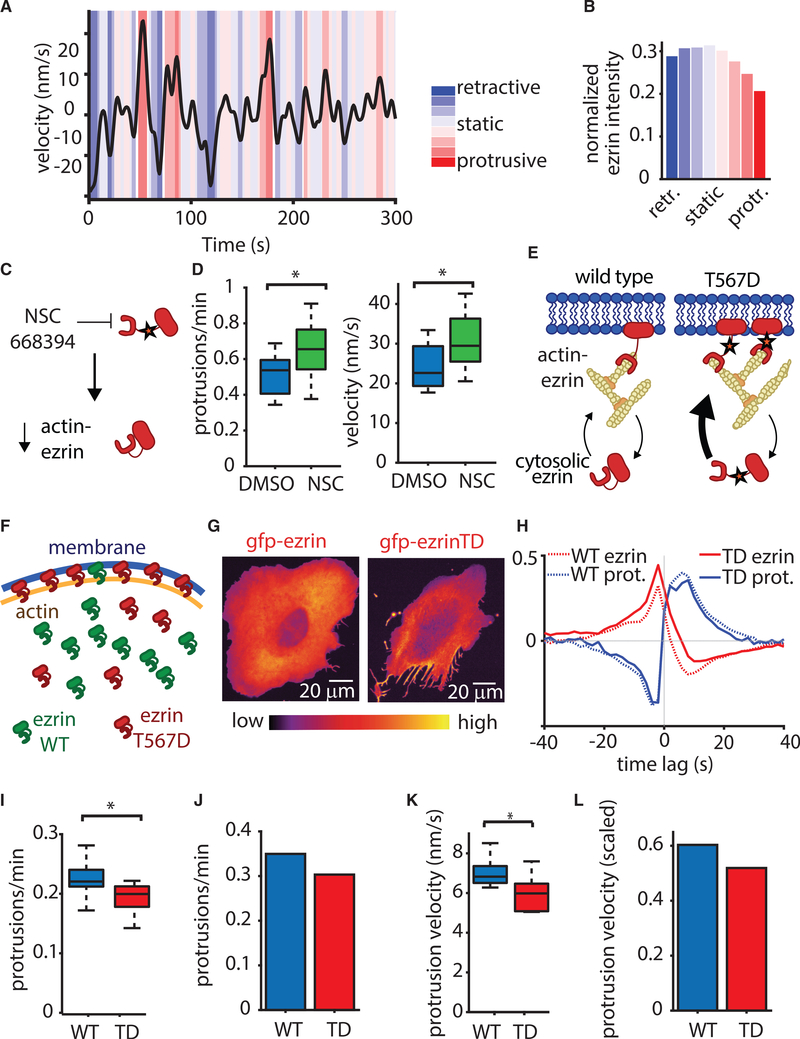
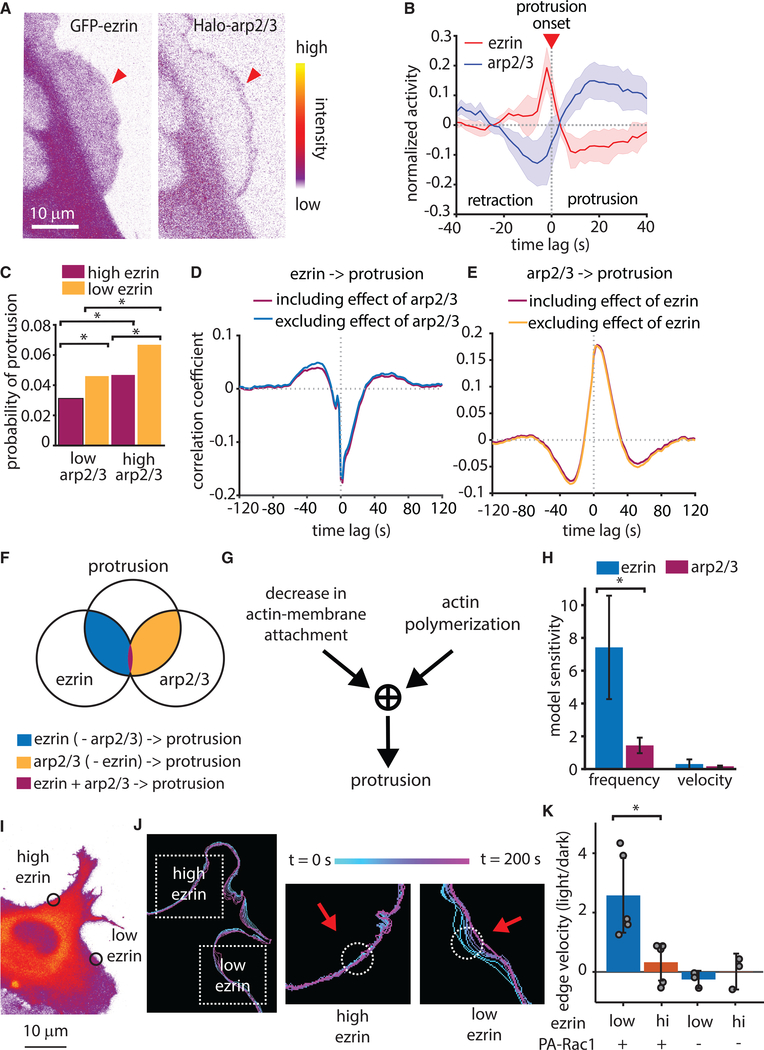
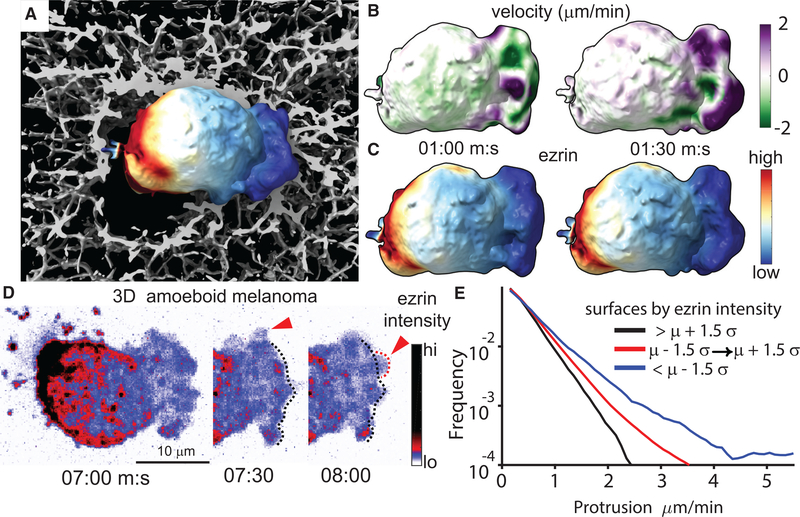
Despite the well-established role of actin polymerization as a driving mechanism for cell protrusion, upregulated actin polymerization alone does not initiate protrusions. Using a combination of theoretical modeling and quantitative live-cell imaging experiments, we show that local depletion of actin-membrane links is needed for protrusion initiation. Specifically, we show that the actin-membrane linker ezrin is depleted prior to protrusion onset and that perturbation of ezrin's affinity for actin modulates protrusion frequency and efficiency. We also show how actin-membrane release works in concert with actin polymerization, leading to a comprehensive model for actin-driven shape changes. Actin-membrane release plays a similar role in protrusions driven by intracellular pressure. Thus, our findings suggest that protrusion initiation might be governed by a universal regulatory mechanism, whereas the mechanism of force generation determines the shape and expansion properties of the protrusion.

Keywords: Brownian ratchet model; actin dynamics; cytoskeleton; intracellular force; lamellipodium; morphology; polymerization; protrusion; shape change.


Conflict of interest statement

Declaration of Interests The authors declare no competing interests.

Figures

Figure 1.
Figure 1.. Actin Fluctuations Alone Do Not Initiate Protrusion
(A) Schematics of the tethered Brownian ratchet model for actin-driven protrusion, including the addition of ezrin as a canonical actin-membrane linker. (B) Simulation of the model, including stochastic fluctuations in working actin filaments, resulting in no protrusion initiation events. (C) Magnification of a portion of the data in (B) showing the relationship between working actin filaments and linked actin filaments. (D) Phase diagram showing the computationally predicted relationship between working filaments and linked filaments. Circles indicate fixed points bifurcated by a separatrix, with red indicating the non-protrusive region and the green indicating the protrusive region. Light gray streamlines show deterministic model solutions, and the dark purple lines show an example simulation trajectory that never crosses over the separatrix. (E) Schematic showing how actin-membrane links via ezrin equilibrate with newly polymerized actin filaments to prevent protrusion.
Figure 2.
Figure 2.. Ezrin Depletion Initiates Protrusion
(A) Spinning disk confocal microscope image showing GFP-ezrin in a U2OS cell exhibiting actin-driven protrusion in a lamellipodium in the boxed area. Image intensity scale applies to (A–D). (B) Time-lapse image sequence of GFP-ezrin and tdTomato-membrane marker in the boxed area indicated in (A). (C) Confocal microscope image showing GFP-ezrin during lamellipodial protrusion in the growth cone of a primary rat cortical neuron. (D) Simulation of the model, including stochastic fluctuations in local ezrin concentration, resulting in repeated stochastic protrusion events. (E) Phase diagram showing the relationship between working filaments and linked filaments in the computational model. Circles indicate fixed points bifurcated by a separatrix, with red indicating the non-protrusive region of the phase space and the green indicating the protrusive region. Light gray streamlines show deterministic model solutions, and the dark purple lines show an example simulation trajectory that crosses the separatrix multiple times, indicating repeated protrusions.
Figure 3.
Figure 3.. Decreases in Local Ezrin Concentration Precede Protrusion Onset
(A) Simulated time courses of total actin filaments, linked filaments, and protrusion velocities (2,324 simulated protrusion events averaged). Negative time lag indicates events before protrusion onset, positive lag indicates events after protrusion onset. (B) Spinning disk confocal microscope image showing a protruding region in a U2OS cell analyzed by computational windowing to sample the local relation between edge motion via membrane marker and GFP-ezrin. (C) Normalized edge velocity and GFP-ezrin intensity, aligned to protrusion onset in U2OS cells. Mean time courses extracted from 27,229 aligned protrusion events in 12 cells. Shaded areas represent 95% confidence intervals about the mean time course, calculated from the mean of each cell. (D) Example time series of ezrin concentration and cell edge velocity sampled in a single window. Red arrows indicate onset of individual protrusion events (defined as switch from negative to positive edge velocity). Green arrows indicate decrease in ezrin intensity. (E) Spinning disk confocal microscope image of an MV3 melanoma cell adhering to a glass coverslip and exhibiting actin-driven protrusion. (F) Normalized edge velocity and GFP-ezrin localization aligned to protrusion in MV3 cells. Mean time courses extracted from 28,070 aligned protrusion events in 10 cells. Shaded areas represent 95% confidence intervals about the mean time course, calculated from the mean of each cell. (G) Summary of the proposed actin release model.
Figure 4.
Figure 4.. Local Recruitment of an Ezrin Phosphatase by Photoactivation Initiates Protrusion
(A) Schematic of the relationship between ezrin phosphorylation and actin-membrane linkage. (B) Schematic of light-induced recruitment of PRL3 to the membrane, resulting in decreased ezrin phosphorylation and decreased actin-membrane links. (C) Spinning disk confocal microscope images (top) and time-labeled cell outline (bottom) showing increased local protrusion upon stimulation of light-recruited cry2-mRuby2-PRL3. (D) Change in the protrusive area because of photoactivation, calculated as mean positive area change during activation minus mean positive area change before activation (left; p = 0.043 two-sided t test, n = 7 cells expressing cry2-mRuby2-PRL3, blue, and n = 6 cells not expressing cry2-mRuby2-PRL3, orange) and cry2-mRuby2-PRL3 intensity expressed as a ratio of intensity during/before photoactivation (right; p = 0.0029 n = 7 areas with photoactivation, blue, and n = 7 areas without photoactivation, orange). Error bars represent 95% confidence intervals. (E) Change in protrusion upon photoactivation as a function of the change in PRL3 intensity in the 7 cells/areas analyzed in (D).
Figure 5.
Figure 5.. Ezrin’s Actin-Membrane Linking Function Regulates Protrusion
(A) Hidden Markov modeling is used to classify protrusion states in a time series. (B) Normalized ezrin intensity during each of the eight HMM states defined in (A). Data include 1,710 velocity time series from n = 12 cells expressing WT GFP-ezrin. (C) The ezrin inhibitor NSC668394 affects ezrin by inhibiting its phosphorylation, resulting in less actin-bound ezrin. (D) Protrusion frequency and velocity during actin-driven protrusion in MV3 melanoma cells adhering to fibronectin-coated glass coverslips. p(frequency) = 0.0225, p(velocity) = 0.041 via two-sample t tests, n = 18 cells (NSC) and n = 10 cells (DMSO). Error bars represent 95% confidence intervals. (E) Mutation of ezrin’s threonine 567 to aspartic acid (TD) increases the affinity of ezrin for actin, resulting in an enrichment of high-affinity ezrin linking actin to the membrane. (F) Schematic depicting the functional effect of actin affinity of wild type and T567D ezrin on actin-membrane attachment. (G) Spinning disk confocal microscope images showing morphological differences in typical U2OS cells resulting from overexpression of ezrin T567D. (H) Normalized edge velocity and GFP-ezrin localization, aligned to protrusion onset imaged in 12 WT and 9-TD U2OS cells generating 27,229 and 25,329 protrusion events, respectively. (I) Protrusion frequency in cells expressing either WT ezrin or TD ezrin, p = 0.039 via two-sample t test; n = 12 cells (WT) and n = 6 cells (TD). Error bars represent 95% confidence intervals. (J) Simulations of the actin release model predicting the effect of TD expression on protrusion initiation frequency. (K) Protrusion velocity in cells expressing either WT ezrin or TD ezrin, p = 0.027 via two-sample t test; n = 12 cells (WT) and n = 6 cells (TD). Error bars represent 95% confidence intervals. (L) Simulations of the actin release model showing the effect of TD expression on protrusion velocity. In (I) and (K), box plots show the collective measurements for each cell; the central line is the median, the edges of the box are the 25th and 75th percentiles, and the whiskers extend to the most extreme data points.
Figure 6.
Figure 6.. Actin Polymerization and Ezrin Localization Cooperatively Drive Protrusion
(A) Representative spinning disk confocal microscopy images of a U2OS cell expressing both GFP-ezrin and a HaloTag-Arp2/3. (B) The normalized activity of GFP-Ezrin and HaloTag-Arp2/3, aligned to protrusion onset (t = 0). Data include 39,686 protrusion events form n = 5 U2OS cells. Shaded areas represent 95% confidence intervals. (C) Probability of protrusion in sampling windows categorized by HMM of GFP-ezrin and HaloTag-Arp2/3 intensity. p < 0.01 for all comparisons via two-sample t test comparing probability per cell, n = 5 cells. (D and E) Comparison of full cross-correlation and partial cross-correlation of GFP-ezrin intensity to protrusion (D) and HaloTag-Arp2/3 intensity to protrusion (E). Data include 39,686 multivariate time series from n = 5 cells. (F) Schematic illustrating the overlap between the effects of ezrin and Arp2/3 on the protrusion. (G) Diagram depicting a hypothetical AND gate whereby both actin polymerization and reduction in actin-membrane attachment are required for protrusion. (H) Mean sensitivity of model simulation results for protrusion frequency and velocity calculated from simulations using 10 different parameter values. Error bars show 95% confidence intervals. (I) Spinning disk confocal microscope image of a U2OS cell depicting regions of high and low ezrin concentration, within which photoactivation of Rac1 was performed. (J) Outlines of the cell edge at different time points either before or during photoactivation. Dashed boxes indicate area of zoom for high and low ezrin regions, circles show areas of photoactivation, and the colorbar shows time information. (K) Local edge velocity in either low or high ezrin regions, shown as the velocity in the light state divided by that in the dark state. p = 0.0136 via two-tailed t test n = 5 for each ezrin low and ezrin high conditions. Error bars represent 95% confidence intervals. Local ezrin concentration and presence of the PA-Rac1 construct are as indicated below the x axis.
Figure 7.
Figure 7.. Actin-Membrane Release Creates Pressure-Driven Protrusion
(A) Surface rendering of melanoma cell in 3D collagen with the intensity of GFP-ezrin mapped to the cell surface, generated from light-sheet microscope images. (B and C) Time-lapse data of the cell shown in (A) were used to quantify surface motion (B) and ezrin intensity (C) as a function of time. (D) Maximum intensity projection (MIP) of light-sheet microscope images showing GFP-ezrin intensity during new bleb formation. Red arrows indicate newly formed blebs. (E) Quantification of surface motion on blebs as a function of ezrin intensity measured in 21 cells. Data are displayed as the relative frequency in groups separated by ezrin intensity either above, below, or within ±1.5 times the standard deviation of all measurements.

Comment in

References

    1. Andrew N, and Insall RH (2007). Chemotaxis in shallow gradients is mediated independently of PtdIns 3-kinase by biased choices between random protrusions. Nat. Cell Biol 9, 193–200. - PubMed
    1. Azoitei ML, Noh J, Marston DJ, Roudot P, Marshall CB, Daugird TA, Lisanza SL, Sandí MJ, Ikura M, Sondek J, et al. (2019). Spatiotemporal dynamics of GEF-H1 activation controlled by microtubule- and Src-mediated pathways. J. Cell Biol 218, 3077–3097. - PMC - PubMed
    1. Barnhart EL, Allard J, Lou SS, Theriot JA, and Mogilner A (2017). Adhesion-dependent wave generation in crawling cells. Current Biol 27, 27–38. - PMC - PubMed
    1. Bergert M, Chandradoss SD, Desai RA, and Paluch E (2012). Cell mechanics control rapid transitions between blebs and lamellipodia during migration. Proc. Natl. Acad. Sci. USA 109, 14434–14439. - PMC - PubMed
    1. Bergert M, Lembo S, Sharma S, Russo L, Milovanović D, Gretarsson K, Börmel M, Neveu P, Hackett J, Petsalaki E, and Diz-Munõz A (2021). Cell surface mechanics gate stem cell differentiation. Cell Stem Cell 28, 1–8. - PMC - PubMed

Publication types