. 2021 Feb 8;56(3):260-276.e7.
doi: 10.1016/j.devcel.2020.11.016. Epub 2020 Dec 11.

NPC1-mTORC1 Signaling Couples Cholesterol Sensing to Organelle Homeostasis and Is a Targetable Pathway in Niemann-Pick Type C

Affiliations

NPC1-mTORC1 Signaling Couples Cholesterol Sensing to Organelle Homeostasis and Is a Targetable Pathway in Niemann-Pick Type C

Oliver B Davis et al. Dev Cell. .

Abstract

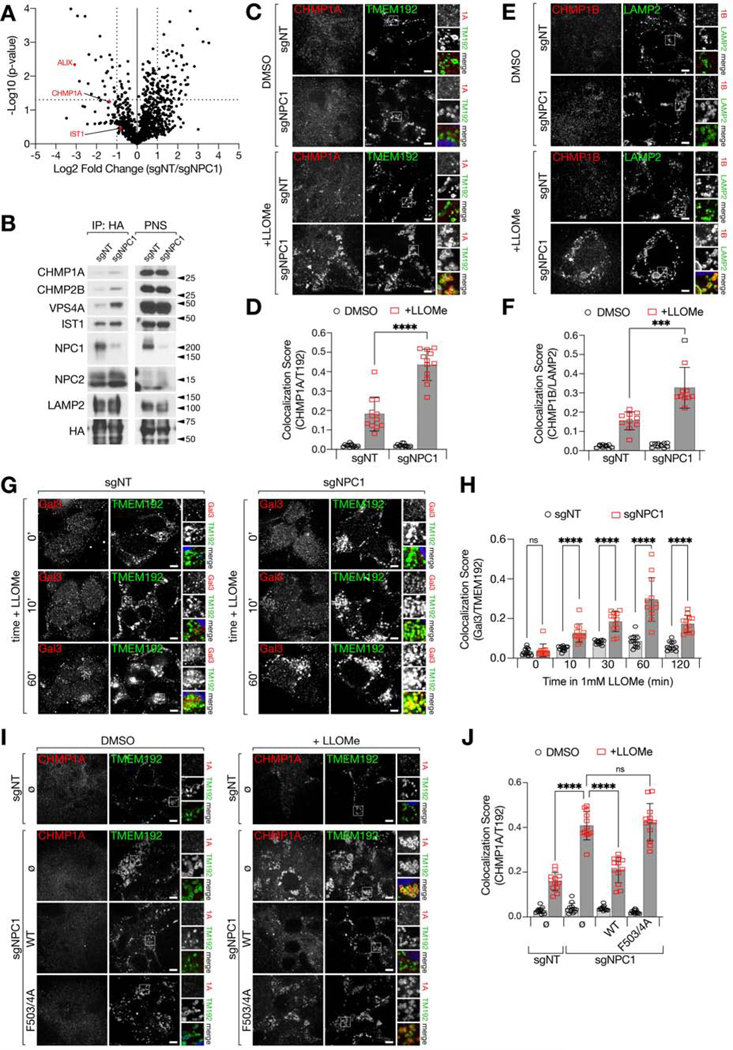
Lysosomes promote cellular homeostasis through macromolecular hydrolysis within their lumen and metabolic signaling by the mTORC1 kinase on their limiting membranes. Both hydrolytic and signaling functions require precise regulation of lysosomal cholesterol content. In Niemann-Pick type C (NPC), loss of the cholesterol exporter, NPC1, causes cholesterol accumulation within lysosomes, leading to mTORC1 hyperactivation, disrupted mitochondrial function, and neurodegeneration. The compositional and functional alterations in NPC lysosomes and nature of aberrant cholesterol-mTORC1 signaling contribution to organelle pathogenesis are not understood. Through proteomic profiling of NPC lysosomes, we find pronounced proteolytic impairment compounded with hydrolase depletion, enhanced membrane damage, and defective mitophagy. Genetic and pharmacologic mTORC1 inhibition restores lysosomal proteolysis without correcting cholesterol storage, implicating aberrant mTORC1 as a pathogenic driver downstream of cholesterol accumulation. Consistently, mTORC1 inhibition ameliorates mitochondrial dysfunction in a neuronal model of NPC. Thus, cholesterol-mTORC1 signaling controls organelle homeostasis and is a targetable pathway in NPC.

Keywords: ESCRT; NPC1; autophagy; cholesterol; lysosome; mTORC1; mitochondria; proteolysis; proteomics.


Conflict of interest statement

Declaration of Interests R.Z. is the co-founder, stockholder, and scientific advisor for Frontier Medicines Corp.

Figures

Figure 1.
Figure 1.. NPC1-deficient lysosomes have reduced degradative capacity relative to sgNT lysosomes
(A-C) Proteomic analysis of Lyso-IP samples from sgNT and sgNPC1 293Ts. Volcano plots of the ratio of leupeptin+pepstatin(“L+P”) to untreated (DMSO) for sgNT (A) and sgNPC1 (B) 293Ts. Proteins with statistically significant (p-value≥0.5, two-tailed unpaired t-test) fold change L+P/DMSO>2 (“sgNT cargo”) in (A) are displayed as red circles. The sgNT cargo proteins identified in (A) are also displayed as red circles in (B). (C) Average peptide counts (raw) for selected autophagy-related proteins. Data are averaged from three independent biological replicates for all conditions except DMSO-treated sgNPC1 samples which are from two biological replicates. (D) Immunoblots of Lyso-IP samples and corresponding post-nuclear supernatant (PNS) from sgNT or sgNPC1 293Ts treated with leupeptin and pepstatin for 24h. (E and F) sgNT and sgNPC1 293Ts were treated with bafilomycin A1 (BafA1) for 4h before immunostaining for LC3B and LAMP2. (E) Representative confocal micrographs. (F) Quantification of LC3B and LAMP2 co-localization from 10 non-overlapping fields containing at least 3 cells per field; ****P<0.0001, ns=not significant, ANOVA with Tukey’s multiple comparisons test. (G and H) sgNT and sgNPC1 293Ts expressing the indicated NPC1-FLAG cDNA were immunostained for LC3B and LAMP2. (I) Representative confocal micrographs. (J) Quantification of LC3B and LAMP2 co-localization from 10 non-overlapping fields containing at least 3 cells per field; ****P(adj.)<0.0001, ANOVA with Dunnett’s multiple comparisons test. (I) Volcano plot of Lyso-IP proteomic data (from A-C) for the ratio of untreated sgNT/sgNPC1 LAMP1-normalized peptide counts. Proteins that are classified by GO:0005775 “vacuolar lumen” are depicted as orange circles. Statistical analysis was performed using two-tailed unpaired t-test. (J) Relative galactosylceramidase (GALC) activity in sgNT or sgNPC1 293Ts from cells labeled with a GALC activity probe (GalGreen). GalGreen fluorescence is normalized by total lysosomal content, as determined by LysoTracker Red fluorescence; nine independent replicate measurements were performed per condition; ***P=0.0004, two-tailed unpaired t-test. All bar graphs depict mean ± SD. Scale bars are 10μm. See also Figure S1–S3 and Supplemental Table 1.
Figure 2.
Figure 2.. NPC1-deficient lysosomes display an increased propensity for membrane damage
(A) Volcano plot of Lyso-IP proteomic data (from Fig. 1A–1C) for the ratio of untreated sgNT/sgNPC1 LAMP1-normalized peptide counts. Selected ESCRT proteins are depicted as red circles. Statistical analysis was performed using two-tailed unpaired t-test. (B) Immunoblots of Lyso-IP samples from sgNT or sgNPC1 293Ts. (C-F) sgNT or sgNPC1 293Ts were treated with LLOMe or vehicle for 10m before immunostaining with the indicated antibodies. Representative confocal micrographs for cells stained with CHMP1A and TMEM192 (C) or CHMP1B and LAMP2 (E). Quantification of CHMP1A and TMEM192 co-localization (D) or CHMP1B and LAMP2 (F) from 12 (F) or 10 (D) non-overlapping fields containing at least 3 cells per field; ****P<0.0001, ***P=0.0005, two-tailed unpaired t-test with Welch’s correction. (G and H) sgNT or sgNPC1 293Ts were treated with LLOMe for the indicated amounts of time before immunostaining for Galectin-3 (Gal3) and TMEM192. (G) Representative confocal micrographs for selected time points. (H) Quantification of Gal3 and TMEM192 co-localization from 12 non-overlapping fields containing at least 3 cells per field; ****P<0.0001, ns=not significant, two-tailed unpaired t-test with Welch’s correction. (I and J) sgNT and sgNPC1 293Ts expressing the indicated NPC1-FLAG cDNA were immunostained for CHMP1A and TMEM192. (I) Representative confocal micrographs. (J) Quantification of CHMP1A and TMEM192 co-localization from 12 non-overlapping fields containing at least 3 cells per field; ****P(adj.)<0.0001, ANOVA with Dunnett’s multiple comparisons test. All bar graphs depict mean ± SD. Scale bars are 10μm. See also Figure S3–S4, and Supplemental Table 1.
Figure 3.
Figure 3.. Cholesterol transport by NPC1 controls mTORC1 activity in response to lysosomal cholesterol
(A) Immunoblots from sgNT and sgNPC1 293Ts expressing the indicated NPC1-FLAG cDNA. Cells were depleted of sterols using methyl-β-cyclodextrin (MCD), followed by re-feeding with cholesterol in complex with MCD, as indicated. (B and C) Cells were starved for and re-fed with cholesterol as in (A) before immunostaining for mTOR and LAMP2. (B) Representative confocal micrographs. (C) Quantification of mTOR and LAMP2 co-localization from 12 non-overlapping fields containing at least 5 cells per field; ****P<0.0001, *P=0.0121, ns=not significant, two-tailed unpaired t-test with Welch’s correction. (D) Immunoblots from sgNT and sgNPC1 293Ts expressing the indicated NPC1-FLAG cDNA. Cells were pre-treated with OSW-1, followed by sterol depletion and re-feeding as in (A) in the presence of OSW-1, as indicated. All bar graphs depict mean ± SD. Scale bars are 20μm. See also Figure S3.
Figure 4.
Figure 4.. Inhibition of mTORC1 activity alleviates lysosomal pathologies associated with loss of NPC1
(A and B) sgNPC1 293Ts were treated with Torin1, OSW-1, or vehicle before being fixed and semi-permeabilized with a liquid N2 pulse, followed by cholesterol labeling with D4H*-mCherry and filipin, and immunostaining for LAMP2. (A) Representative confocal micrographs. Scale bars are 20μm. (B) Quantification of D4H*-mCherry and filipin co-localization from 10 non-overlapping fields containing at least 3 cells per field; ****P(adj.)<0.0001, ANOVA with Dunnett’s multiple comparisons test. (C) Lysosomes from sgNT and sgNPC1 cells, treated with Torin1 or vehicle, were isolated by Lyso-IP and free cholesterol content was measured by LC-MS/MS. Measurements of cholesterol peak intensity from three independent biological replicates are shown. ***P(adj.)=0.0002, ns=not significant, ANOVA with Dunnett’s multiple comparisons test. (D and E) sgNT or sgNPC1 293Ts were treated with Torin1, rapamycin, or vehicle as indicated before being immunostaining for LC3B and LAMP2. (D) Representative confocal micrographs. Scale bars are 10μm. (E) Quantification of LC3B and LAMP2 co-localization from 10 non-overlapping fields containing at least 3 cells per field; ****P(adj.)<0.0001, **P(adj.)=0.0014, ANOVA with Dunnett’s multiple comparisons test. (F) Immunoblots of Lyso-IP samples from sgNT or sgNPC1 293Ts treated as in (D). (G and H) sgNT or sgNPC1 293Ts expressing control (shLuciferase) or Ragulator-specific (shLAMTOR5) shRNAs were immunostained for LC3B and LAMP2. (G) Representative confocal micrographs. Scale bars are 10μm. (H) Quantification of LC3B and LAMP2 co-localization from 12 non-overlapping fields containing at least 3 cells per field; ****P(adj.)<0.0001, ANOVA with Dunnett’s multiple comparisons test. (I) Immunoblots of Lyso-IP samples from sgNT or sgNPC1 293Ts treated as in (D). (J and K) sgNT and sgNPC1 293Ts were pre-treated with Torin1 or vehicle for 24h before being treated with LLOMe, as indicated, followed by immunostaining for CHMP1A and TMEM192. (J) Representative confocal micrographs. Scale bars are 10μm. (K) Quantification of CHMP1A and TMEM192 co-localization from 12 non-overlapping fields containing at least 3 cells per field; ****P(adj.)<0.0001, ANOVA with Dunnett’s multiple comparisons test. All bar graphs depict mean ± SD. See also Figure S5 and Supplemental Table 2.
Figure 5.
Figure 5.. Inhibition of mTORC1 corrects lysosomal defects associated with loss of NPC1 in and iPSC-derived neuronal cell model
(A and B) Control or NPC1−/− iPSC-derived neural lineage cells were treated with Torin1, BafA1, or vehicle before immunostaining for TAX1BP1, LAMP2, and MAP2 (not shown). (A) Representative confocal micrographs. (B) Quantification of the number of TAX1BP1 spots per cell area (defined by MAP2, see Figure S6C) from 10 non-overlapping fields containing at least 3 MAP2-positive cells per field; ****P(adj.)<0.0001, ANOVA with Dunnett’s multiple comparisons test. (C and D) Control or NPC1−/− iPSC-derived neuronal lineage cells were treated as in (A) before immunostaining for GABARAP, LAMP2, and MAP2 (not shown). (C) Representative confocal micrographs. (D) Quantification of GABARAP and LAMP2 co-localization from 10 non-overlapping fields containing at least 3 MAP2-positive cells per field; ****P(adj.)<0.0001, ANOVA with Dunnett’s multiple comparisons test. (E and F) Control or NPC1−/− iPSC-derived neuronal lineage cells were pre-treated with Torin1 or vehicle for 24h before being treated with LLOMe, as indicated, followed by immunostaining for CHMP1A, TMEM192, and MAP2 (not shown). (E) Representative confocal micrographs. (F) Quantification of CHMP1A and TMEM192 co-localization from 12 non-overlapping fields containing at least 3 MAP2-positive cells per field; ****P(adj.)<0.0001, ANOVA with Dunnett’s multiple comparisons test. All bar graphs depict mean ± SD. Scale bars are 20μm. See also Figure S6.
Figure 6.
Figure 6.. Mitochondrial morphology and function are disrupted by loss of NPC1 and is restored by inhibition of mTORC1
(A) Volcano plot of Lyso-IP proteomic data (as in Figure 2A). Proteins identified as mitochondrial in the human MitoCarta 2.0 database (Calvo et al., 2016) are shown as red circles. Mitochondrial proteins that behave as substrates for lysosomal proteolysis are highlighted with a green outline. (B) Percentages of MitoCarta or “mito substrates” proteins that are in the top quartile (>75% enrichment) or remaining three quartiles (<75% enrichment) of proteins enriched in sgNT over sgNPC1 lysosomes. Total number of proteins is 1254, total number in top quartile is 62. (C) Immunoblots of Lyso-IP samples and corresponding PNS from sgNT or sgNPC1 293Ts treated with vehicle or leupeptin and pepstatin, and/or treated with 10μM CCCP for 5h. (D and E) Control or NPC1−/− iPSC-derived neuronal lineage cells were treated with Torin1, BafA1, or vehicle before immunostaining for TOM20. (D) Representative confocal micrographs. (E) Lengths of individual mitochondria were measured and quantified. (F and G) Control or NPC1−/− iPSC-derived neuronal lineage cells were treated with Torin1, BafA1, or vehicle before being stained with the ratiometric MMP dye JC-10. (F) Dot plots showing MMP-independent (“green”) and MMP-dependent (“red”) fluorescence distribution of individual cells from one representative experiment. (G) Percentages of cells classified as depolarized (Q3: greenhigh, redlow) or polarized (Q3: greenhigh, redhigh). Values from six individual replicates are shown as points, bars represent average values across all replicates. All bar graphs depict mean ± SD. Scale bars are 20μm. See also Figure S6–S7.
Figure 7.
Figure 7.
Model illustrating the relationship between NPC1, lysosomal cholesterol, mTORC1 signaling and organelle homeostasis in both normal and NPC cells.

Comment in

References

    1. Abu-Remaileh M, Wyant GA, Kim C, Laqtom NN, Abbasi M, Chan SH, Freinkman E, and Sabatini DM (2017). Lysosomal metabolomics reveals V-ATPase- and mTOR-dependent regulation of amino acid efflux from lysosomes. Science 358, 807–813. - PMC - PubMed
    1. Anandapadamanaban M, Masson GR, Perisic O, Berndt A, Kaufman J, Johnson CM, Santhanam B, Rogala KB, Sabatini DM, and Williams RL (2019). Architecture of human Rag GTPase heterodimers and their complex with mTORC1. Science 366, 203–210. - PMC - PubMed
    1. Andrzejewska Z, Nevo N, Thomas L, Chhuon C, Bailleux A, Chauvet V, Courtoy PJ, Chol M, Guerrera IC, and Antignac C. (2016). Cystinosin is a Component of the Vacuolar H+-ATPase-Ragulator-Rag Complex Controlling Mammalian Target of Rapamycin Complex 1 Signaling. J. Am. Soc. Nephrol. 27, 1678–1688. - PMC - PubMed
    1. de Araujo MEG, Naschberger A, Fürnrohr BG, Stasyk T, Dunzendorfer-Matt T, Lechner S, Welti S, Kremser L, Shivalingaiah G, Offterdinger M, et al. (2017). Crystal structure of the human lysosomal mTORC1 scaffold complex and its impact on signaling. Science 358, 377–381. - PubMed
    1. Ballabio A, and Gieselmann V. (2009). Lysosomal disorders: from storage to cellular damage. Biochim. Biophys. Acta 1793, 684–696. - PubMed

Publication types

MeSH terms

Substances