

Phenotypic sexual dimorphism in response to dietary fat manipulation in C57BL/6J mice
- PMID: 33308894
- PMCID: PMC7856196
- DOI: 10.1016/j.jdiacomp.2020.107795
Phenotypic sexual dimorphism in response to dietary fat manipulation in C57BL/6J mice
Abstract
Background: Obesity and the metabolic syndrome are increasingly prevalent in society and their complications and response to treatment exhibit sexual dimorphism. Mouse models of high fat diet-induced obesity are commonly used for both mechanistic and therapeutic studies of metabolic disease and diabetes. However, the inclusion of female mammals in obesity research has not been a common practice, and has resulted in a paucity of data regarding the effect of sex on metabolic parameters and its applicability to humans.
Methods: Here we analyzed male and female C57BL/6 J mice beginning at 4 weeks of age that were placed on a low-fat diet (LFD, 10% calories from fat), a Western Diet (WD, 45% calories from fat), or a high fat diet (HFD, 60% calories from fat). Assessments of body composition, glucose homeostasis, insulin production, and energy metabolism, as well as histological analyses of pancreata were performed.
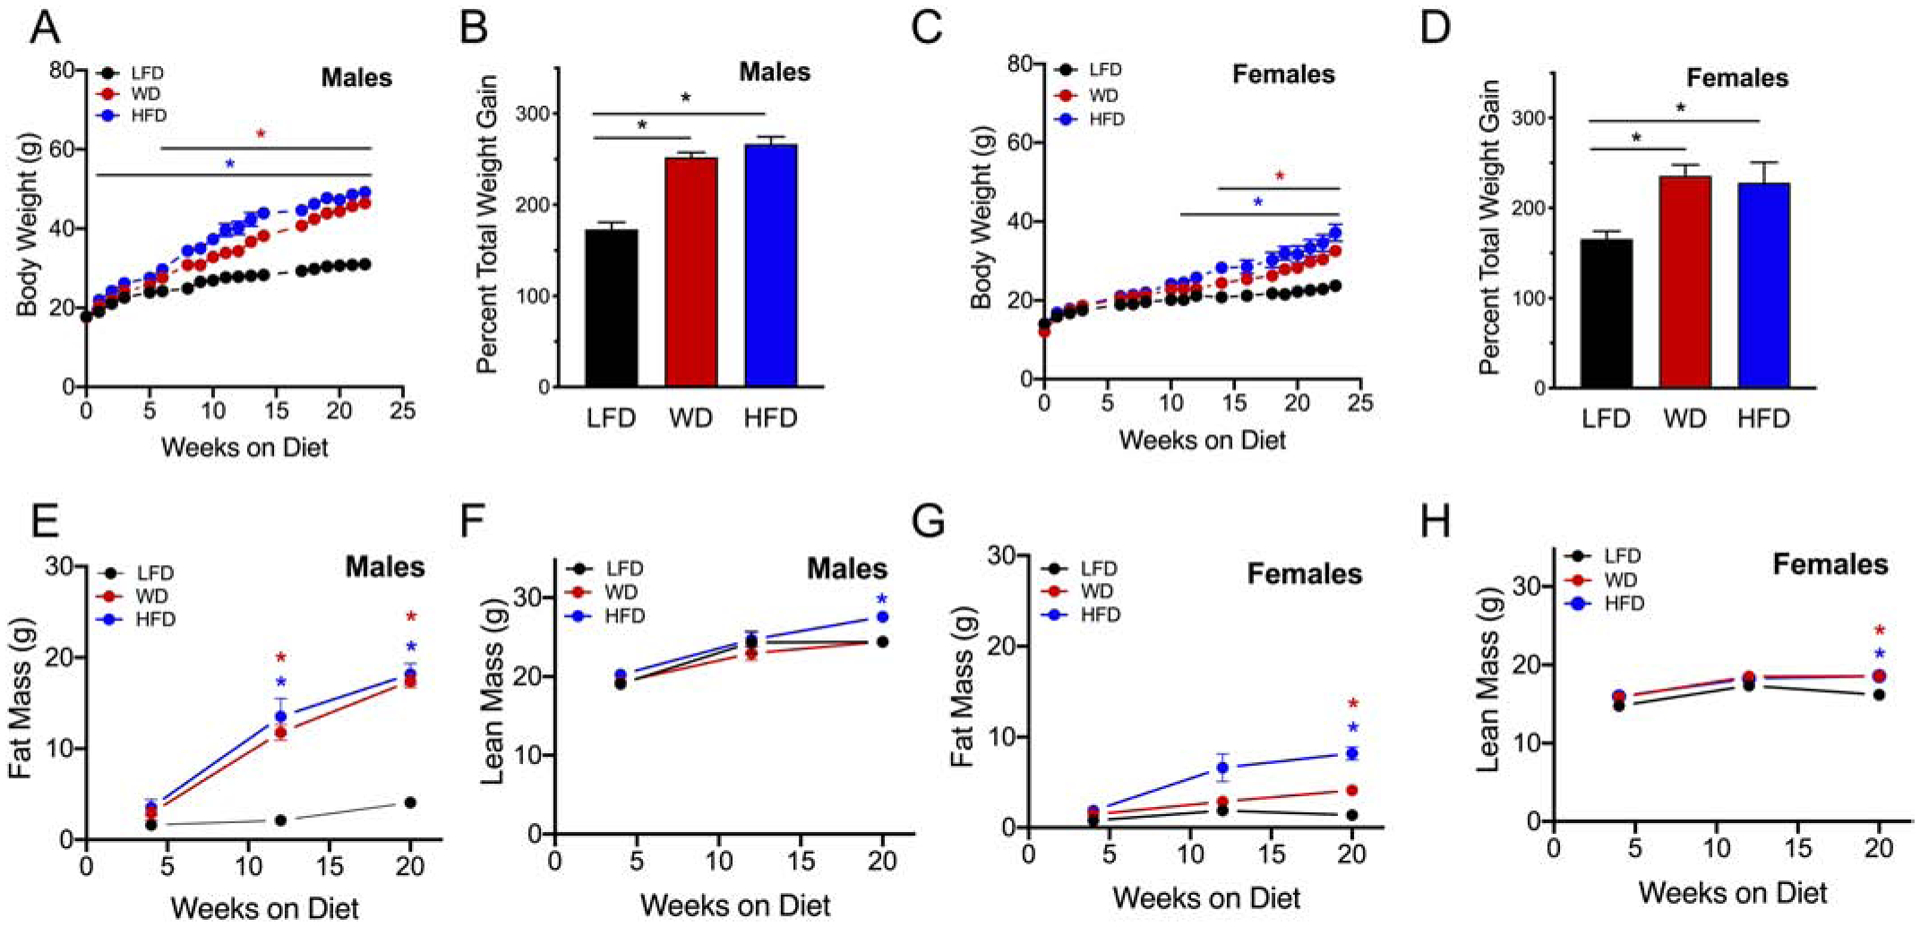
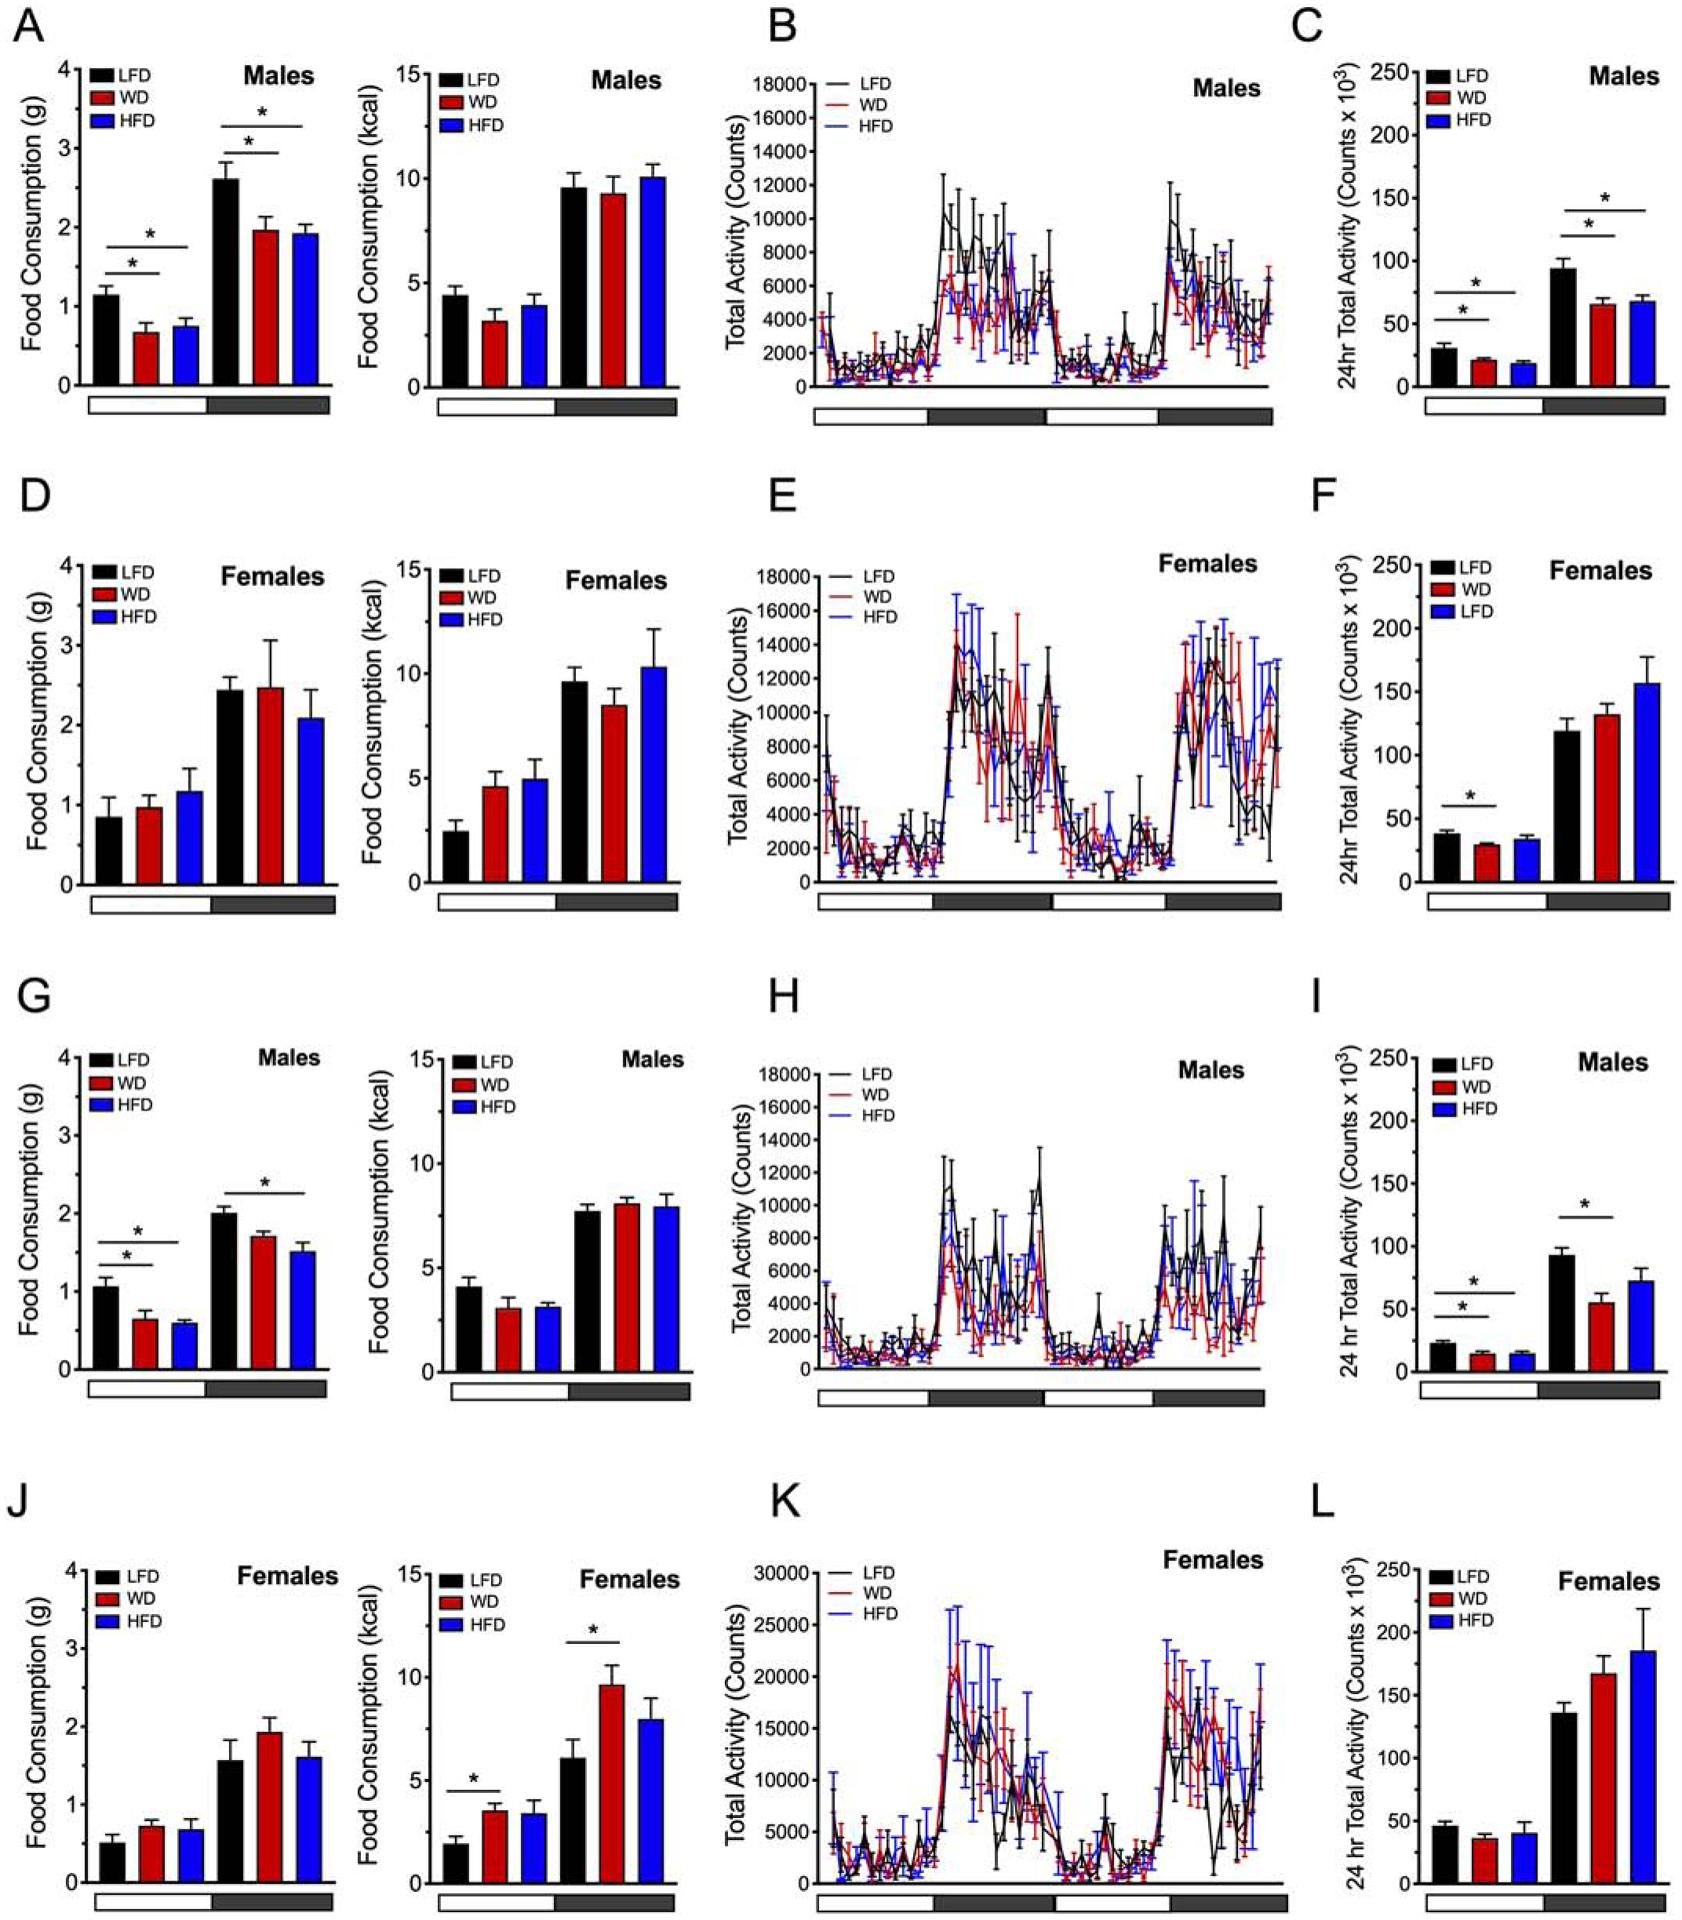
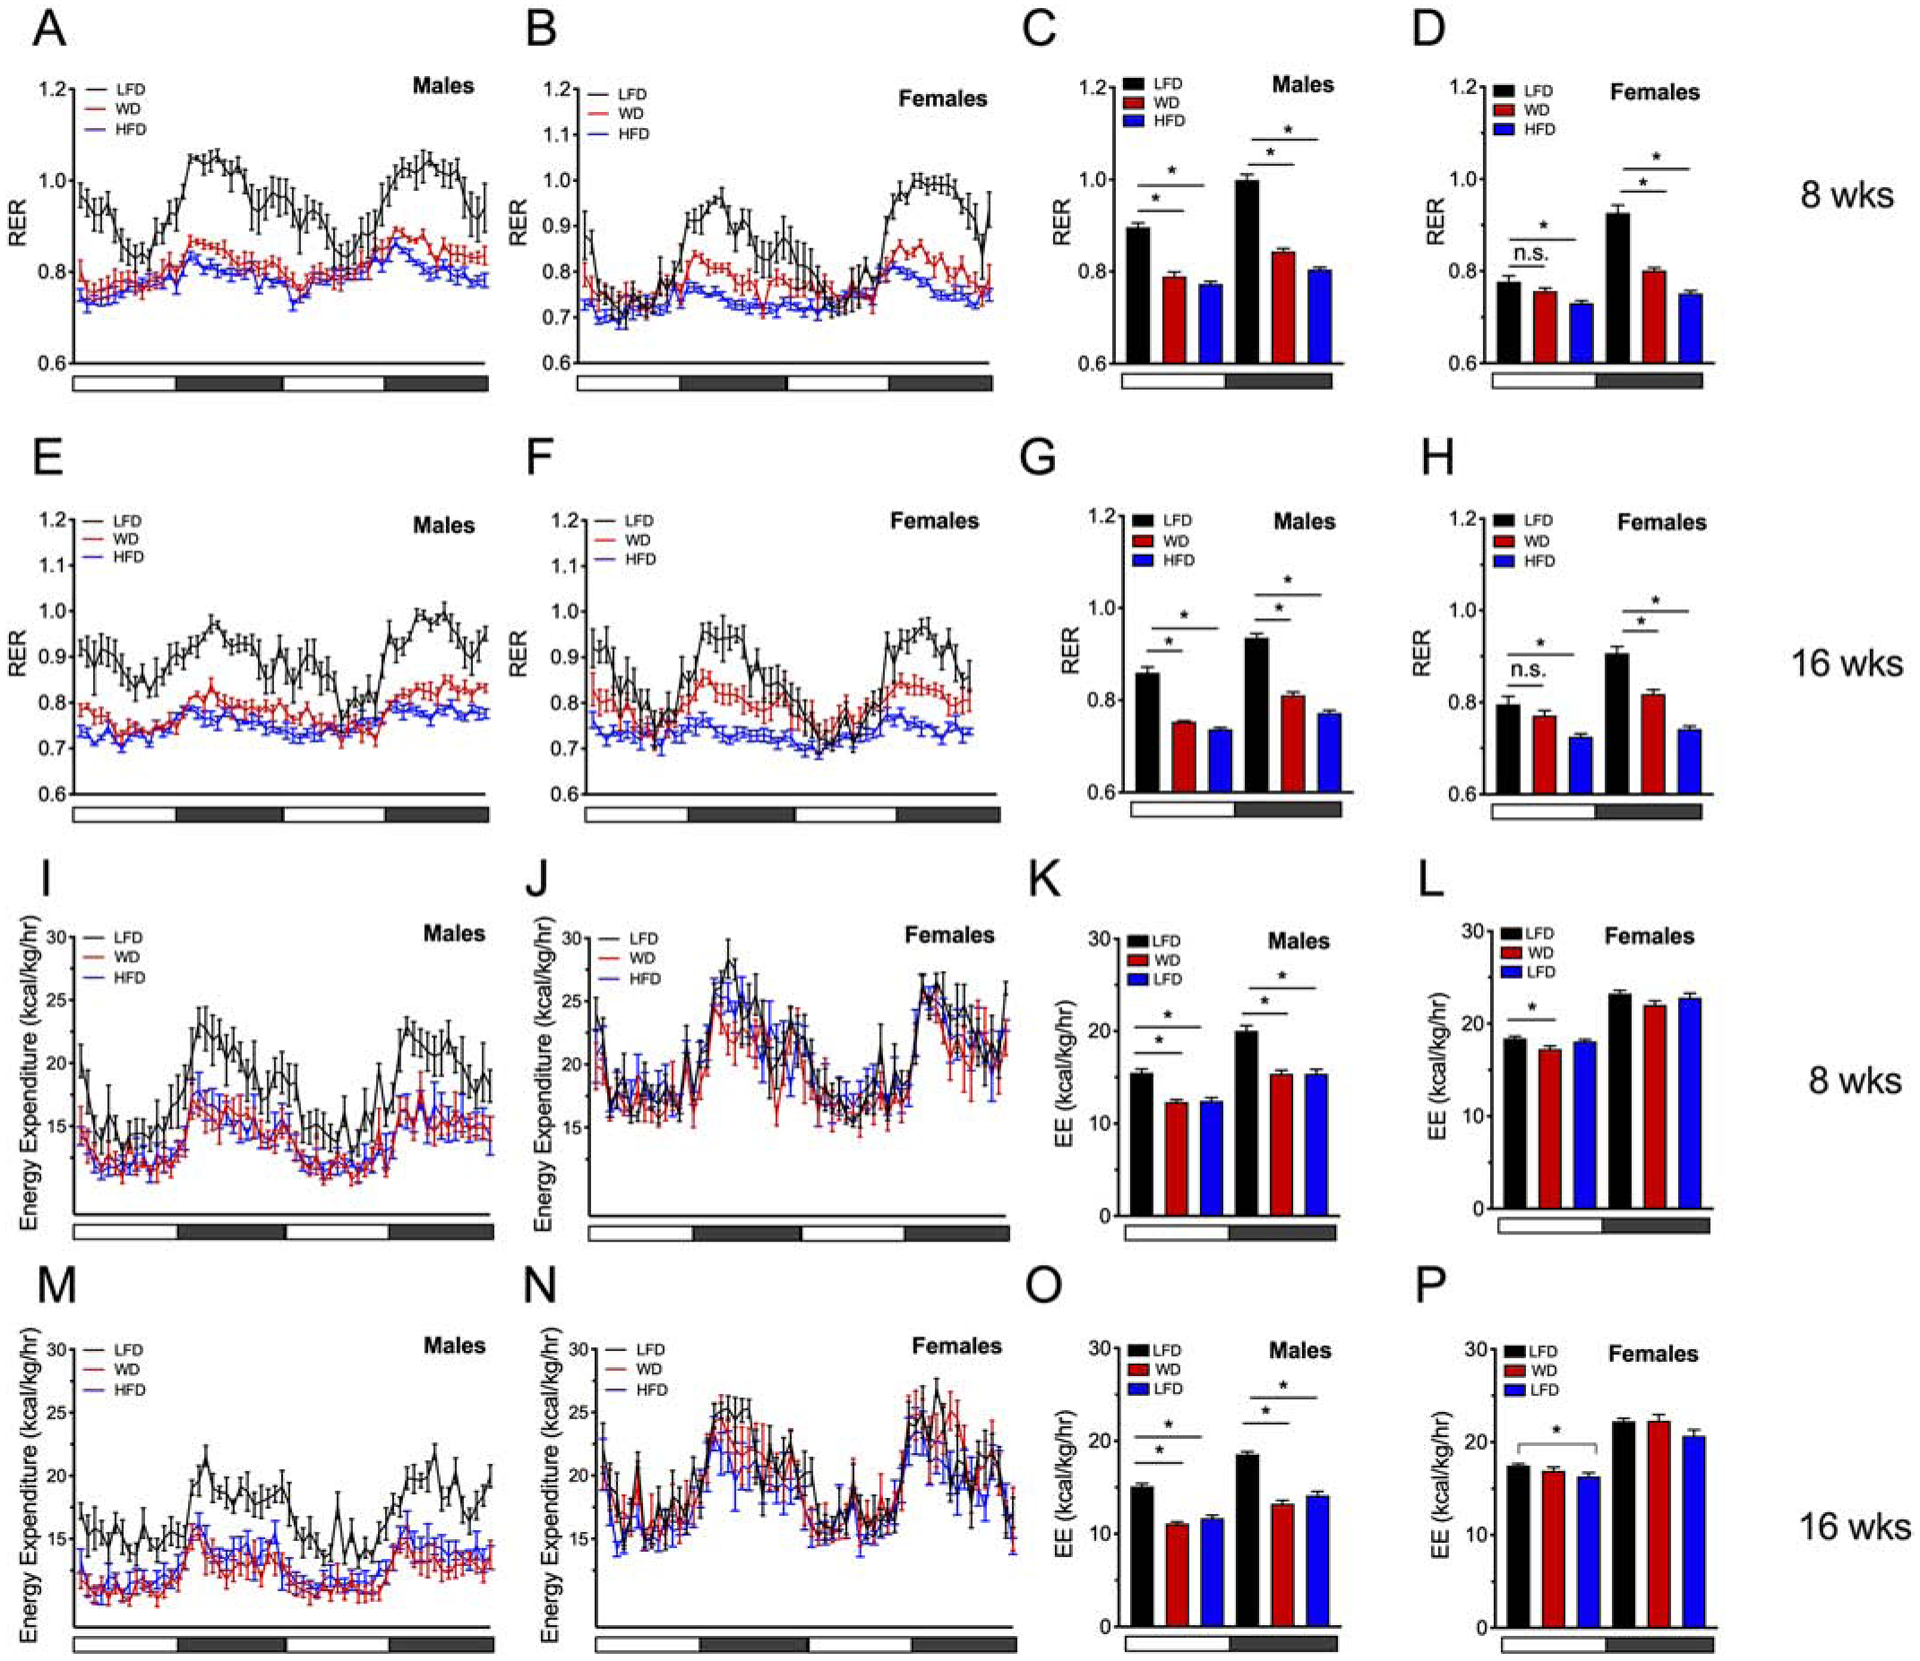
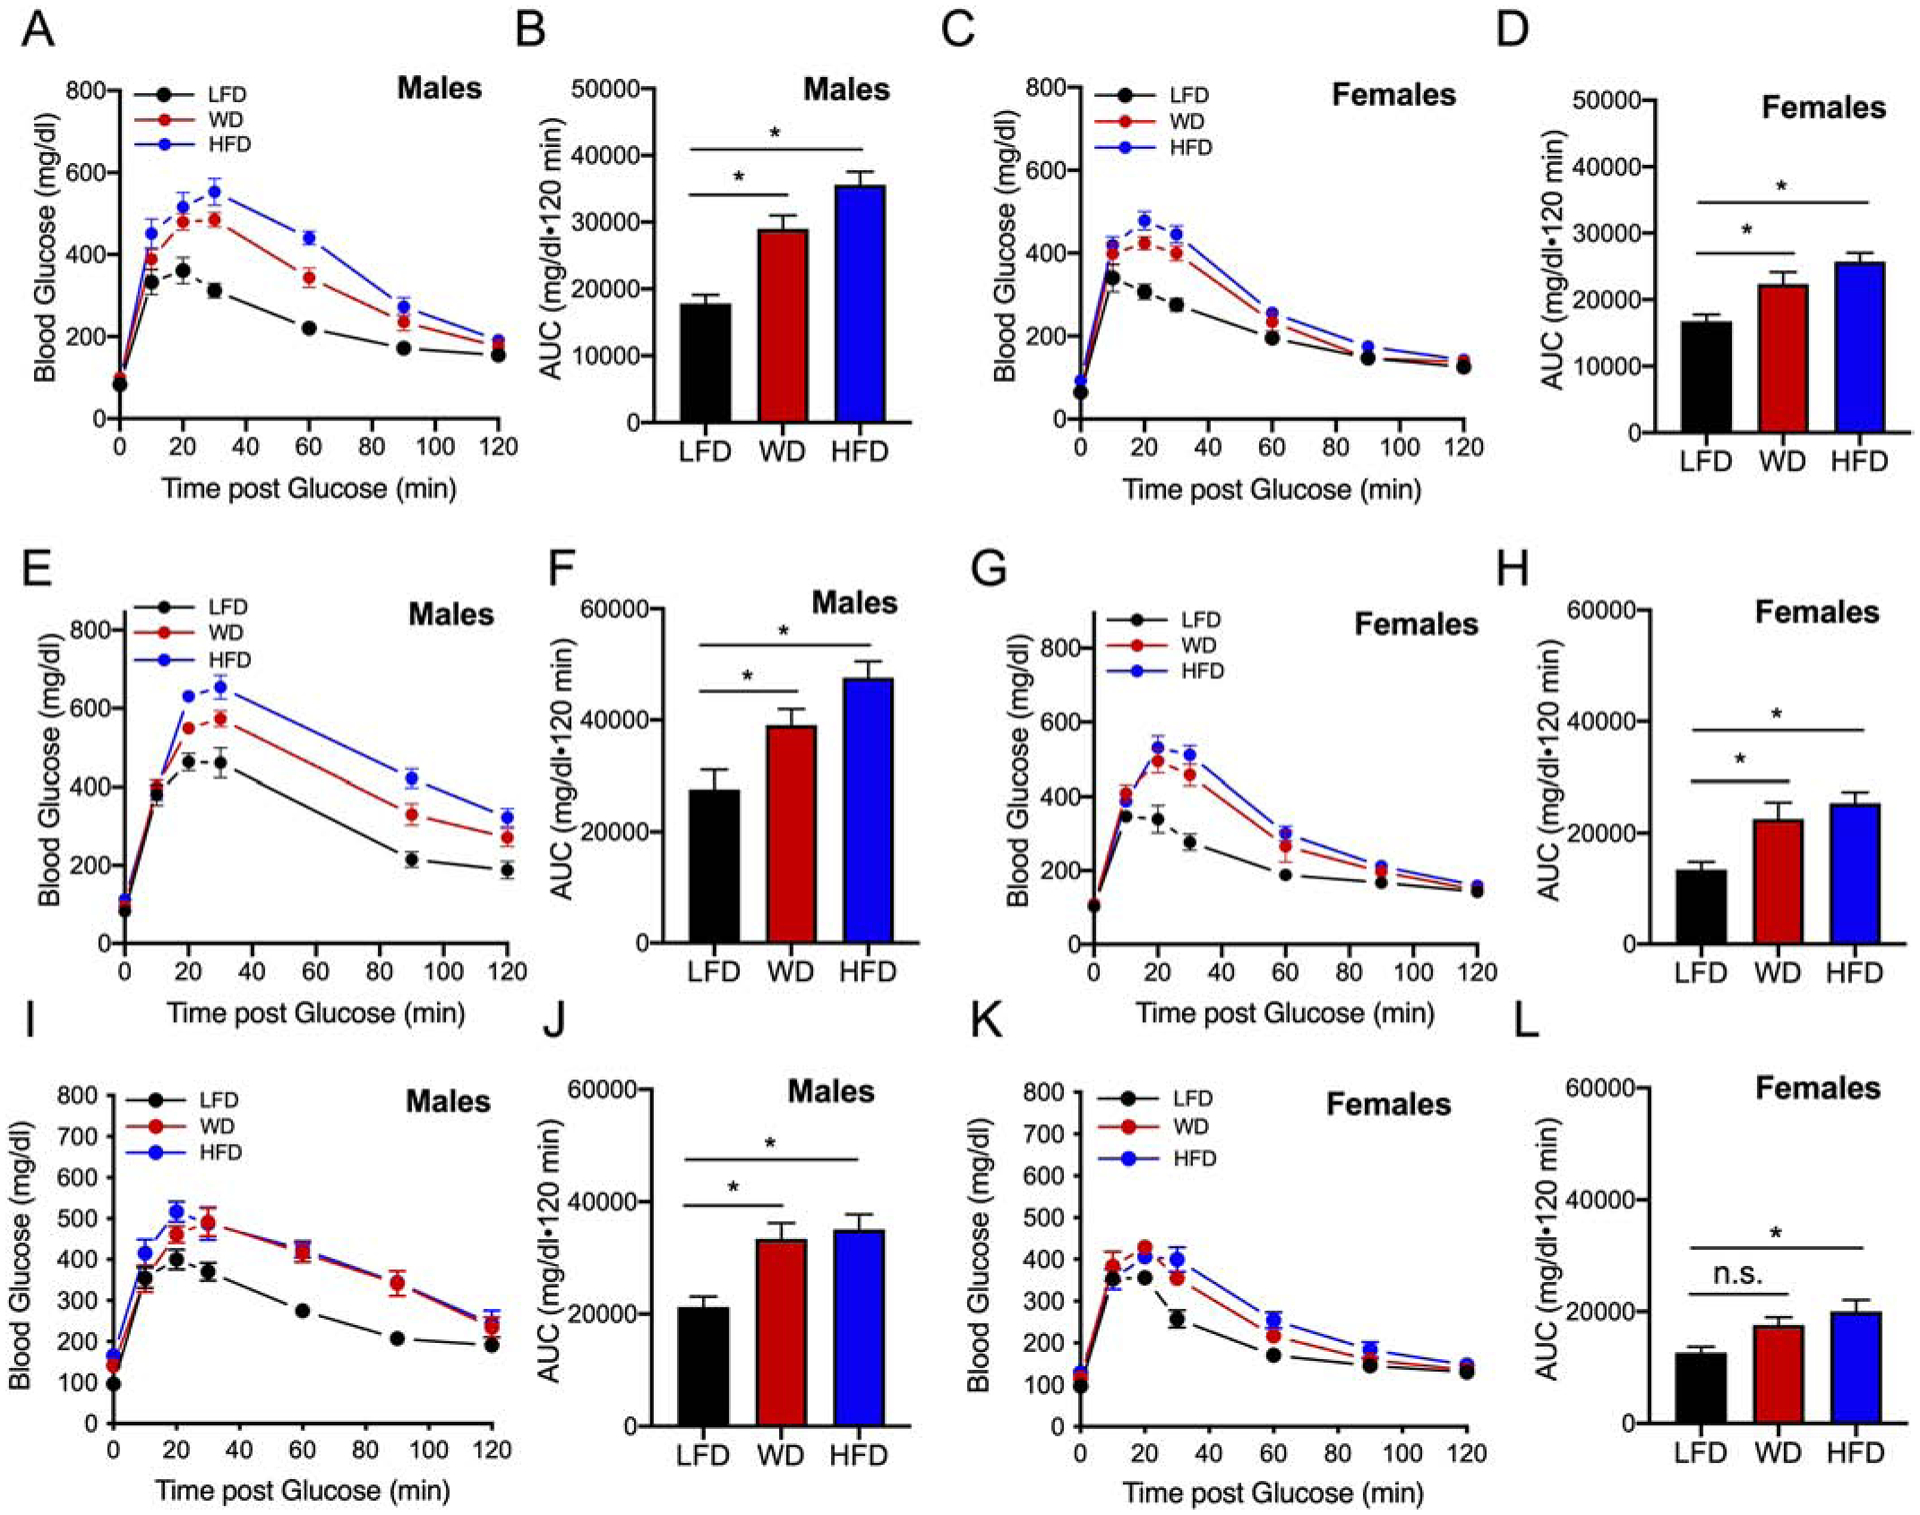
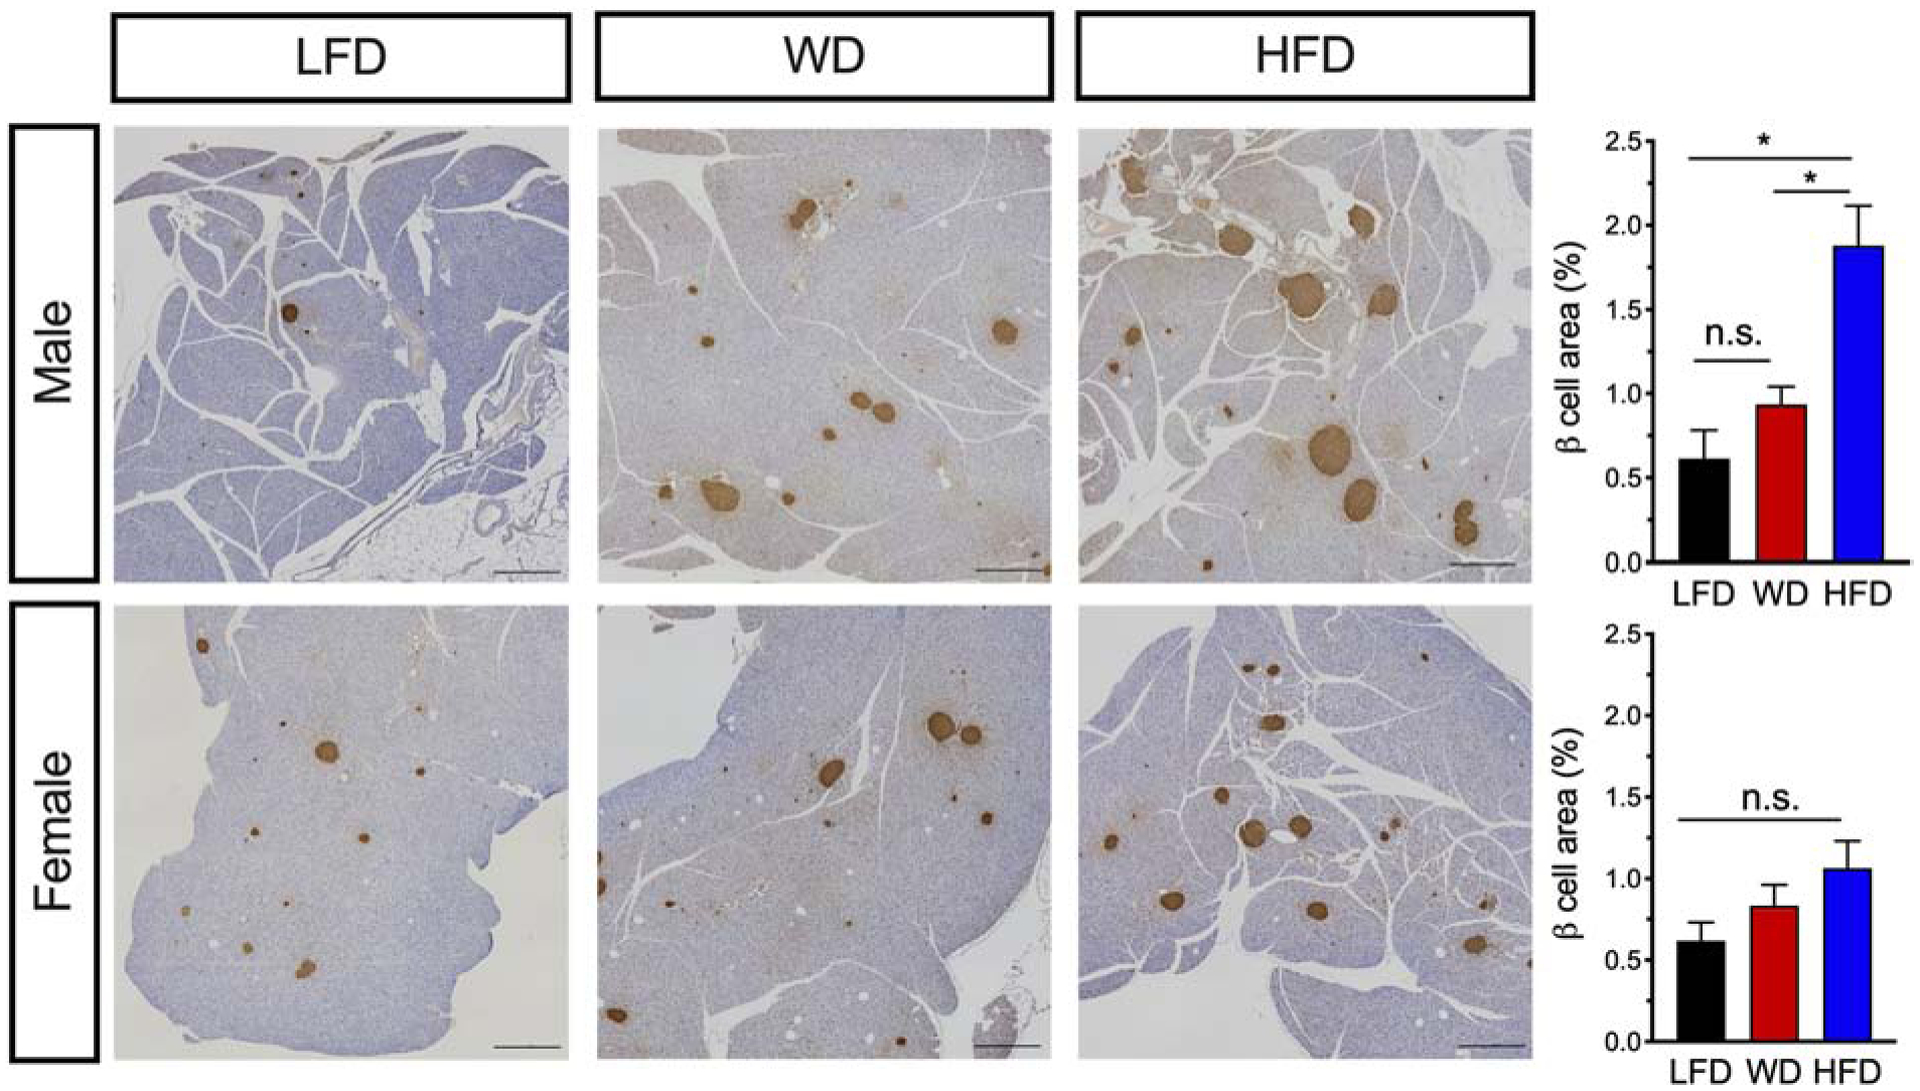
Results: Both male and female C57BL/6 J mice had similar increases in total percent body weight gain with both WD and HFD compared to LFD, however, male mice gained weight earlier upon HFD or WD feeding compared to female mice. Male mice maintained their caloric food intake while reducing their locomotor activity with either WD or HFD compared to LFD, whereas female mice increased their caloric food intake with WD feeding. Locomotor activity of female mice did not significantly change upon WD or HFD feeding, yet female mice exhibited increased energy expenditure compared to WD or HFD fed male mice. Glucose tolerance tests performed at 4, 12 and 20 weeks of dietary intervention revealed impaired glucose tolerance that was worse in male mice compared to females. Furthermore, male mice exhibited an increase in pancreatic β cell area as well as reduced insulin sensitivity after HFD feeding compared to WD or LFD, whereas female mice did not.
Conclusions: Male and female C57BL/6 J mice exhibited strikingly different responses in weight, food consumption, locomotor activity, energy expenditure and β cell adaptation upon dietary manipulation, with the latter exhibiting less striking phenotypic changes. We conclude that the nature of these responses emphasizes the need to contextualize studies of obesity pathophysiology and treatment with respect to sex.
Keywords: C57BL/6J; High fat diet; Obesity; Sexual dimorphism; Western diet.
Copyright © 2020 The Authors. Published by Elsevier Inc. All rights reserved.
Conflict of interest statement
Declaration of competing interest The authors declare that there is no conflict of interest.
Figures

Similar articles
-
Impact of 4 weeks of western diet and aerobic exercise training on whole-body phenotype and skeletal muscle mitochondrial respiration in male and female mice.Physiol Rep. 2022 Dec;10(24):e15543. doi: 10.14814/phy2.15543. Physiol Rep. 2022. PMID: 36541261 Free PMC article.
-
Effects of Multivitamin Supplementation on Metabolic Parameters in High- and Low-Fat Diet-Fed C57BL/6J Mice: Potential Links to Adipose Tissue Browning and Gut Microbiome.Nutrients. 2025 Mar 17;17(6):1045. doi: 10.3390/nu17061045. Nutrients. 2025. PMID: 40292481 Free PMC article.
-
Divergent compensatory responses to high-fat diet between C57BL6/J and C57BLKS/J inbred mouse strains.Am J Physiol Endocrinol Metab. 2013 Dec;305(12):E1495-511. doi: 10.1152/ajpendo.00366.2013. Epub 2013 Oct 29. Am J Physiol Endocrinol Metab. 2013. PMID: 24169046 Free PMC article.
-
Does gender influence cardiovascular remodeling in C57BL/6J mice fed a high-fat, high-sucrose and high-salt diet?Int J Exp Pathol. 2019 Jun;100(3):153-160. doi: 10.1111/iep.12318. Epub 2019 Jul 19. Int J Exp Pathol. 2019. PMID: 31321834 Free PMC article. Review.
-
Obesity and dietary fat influence dopamine neurotransmission: exploring the convergence of metabolic state, physiological stress, and inflammation on dopaminergic control of food intake.Nutr Res Rev. 2022 Dec;35(2):236-251. doi: 10.1017/S0954422421000196. Epub 2021 Jun 28. Nutr Res Rev. 2022. PMID: 34184629 Free PMC article. Review.
Cited by
-
Concerted regulation of skeletal muscle metabolism and contractile properties by the orphan nuclear receptor Nr2f6.J Cachexia Sarcopenia Muscle. 2024 Aug;15(4):1335-1347. doi: 10.1002/jcsm.13480. Epub 2024 Apr 29. J Cachexia Sarcopenia Muscle. 2024. PMID: 38682559 Free PMC article.
-
Vitamin A preserves cardiac energetic gene expression in a murine model of diet-induced obesity.Am J Physiol Heart Circ Physiol. 2022 Dec 1;323(6):H1352-H1364. doi: 10.1152/ajpheart.00514.2022. Epub 2022 Nov 18. Am J Physiol Heart Circ Physiol. 2022. PMID: 36399384 Free PMC article.
-
Short-term high-fat diet impacts bone material properties and metabolism for adult and aged C57BL/6JN mice.Commun Biol. 2025 Jun 3;8(1):850. doi: 10.1038/s42003-025-08263-w. Commun Biol. 2025. PMID: 40461602 Free PMC article.
-
Intermittent Fasting Partially Alleviates Dietary Margarine-Induced Morphometrical, Hematological, and Biochemical Changes in Female Mice, but Not in Males.Biochem Res Int. 2025 Jun 18;2025:2163104. doi: 10.1155/bri/2163104. eCollection 2025. Biochem Res Int. 2025. PMID: 40568633 Free PMC article.
-
Protein-coding mutation in Adcy3 increases adiposity and alters emotional behaviors sex-dependently in rats.Obesity (Silver Spring). 2025 Jan;33(1):91-103. doi: 10.1002/oby.24178. Epub 2024 Dec 4. Obesity (Silver Spring). 2025. PMID: 39632398
References
-
- Björntorp P Abdominal Fat Distribution and the Metabolic Syndrome. J Cardiovasc Pharmacol. 1992;20:S26. - PubMed
Publication types
MeSH terms
Substances
Grants and funding
LinkOut - more resources
Full Text Sources
Other Literature Sources
Medical
