. 2021 Apr 7;29(4):1439-1458.
doi: 10.1016/j.ymthe.2020.12.009. Epub 2020 Dec 10.

Microglial vesicles improve post-stroke recovery by preventing immune cell senescence and favoring oligodendrogenesis

Affiliations

Microglial vesicles improve post-stroke recovery by preventing immune cell senescence and favoring oligodendrogenesis

Stefano Raffaele et al. Mol Ther. .

Abstract

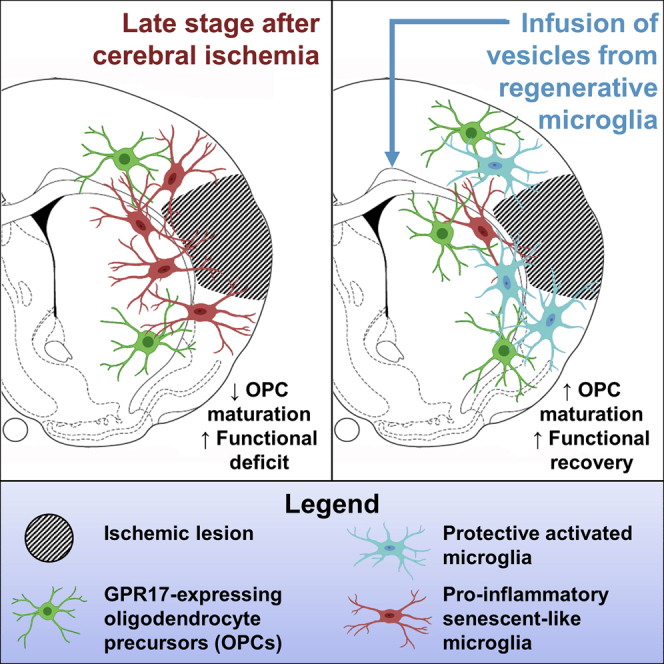
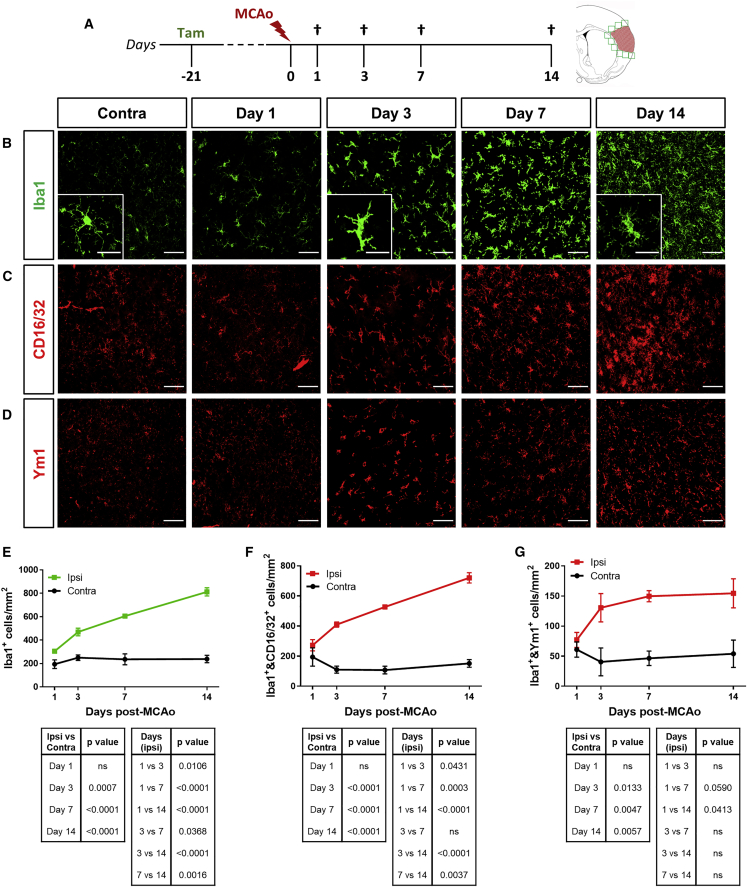
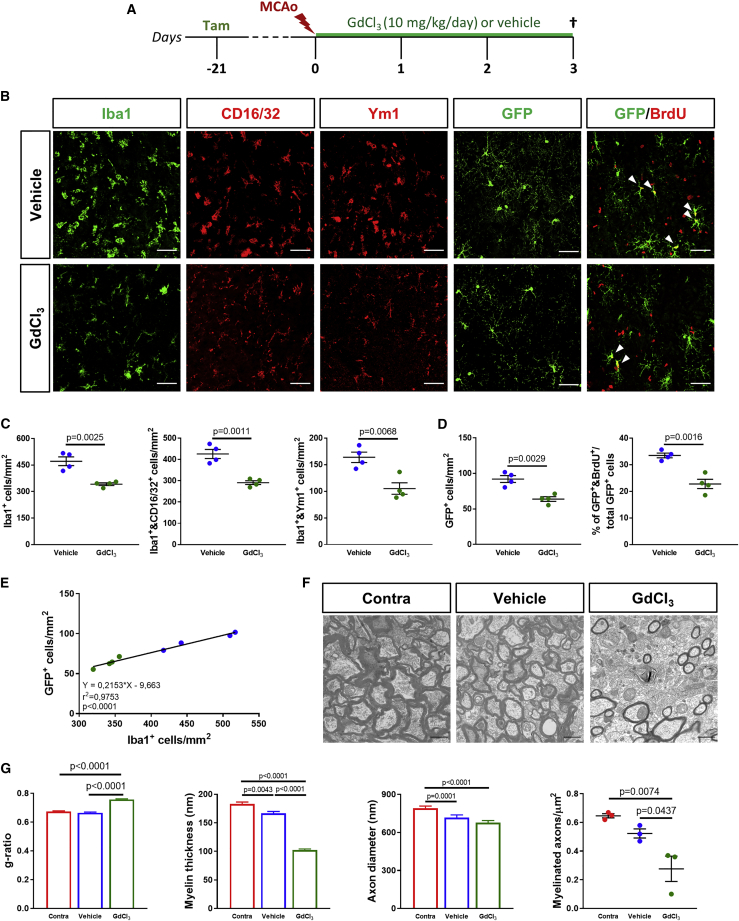
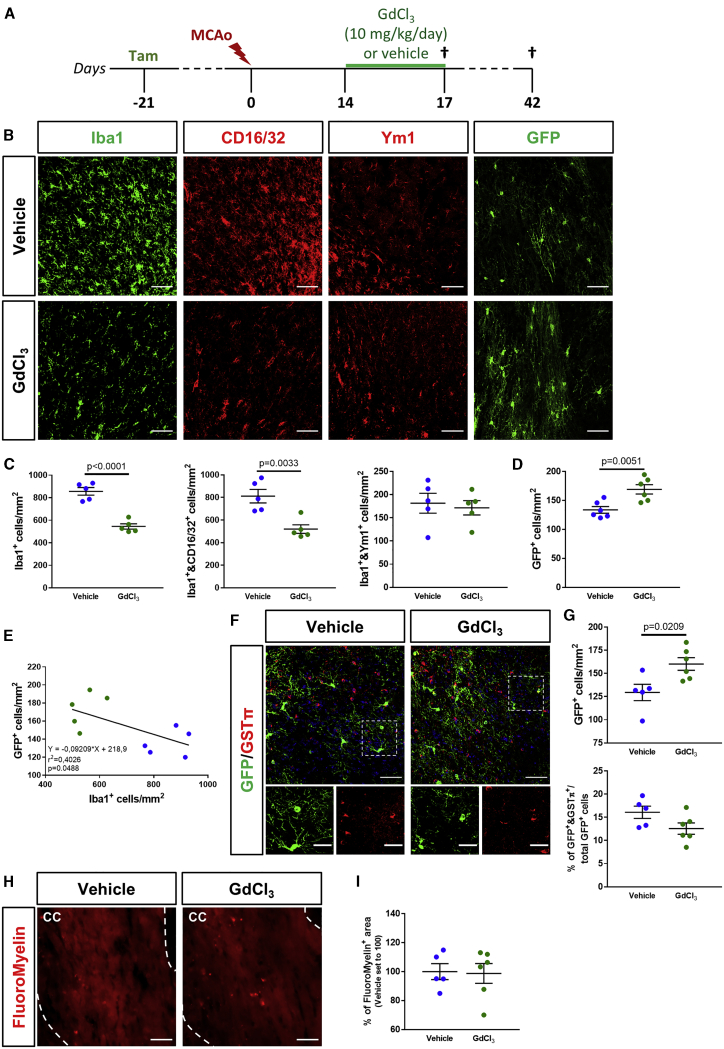
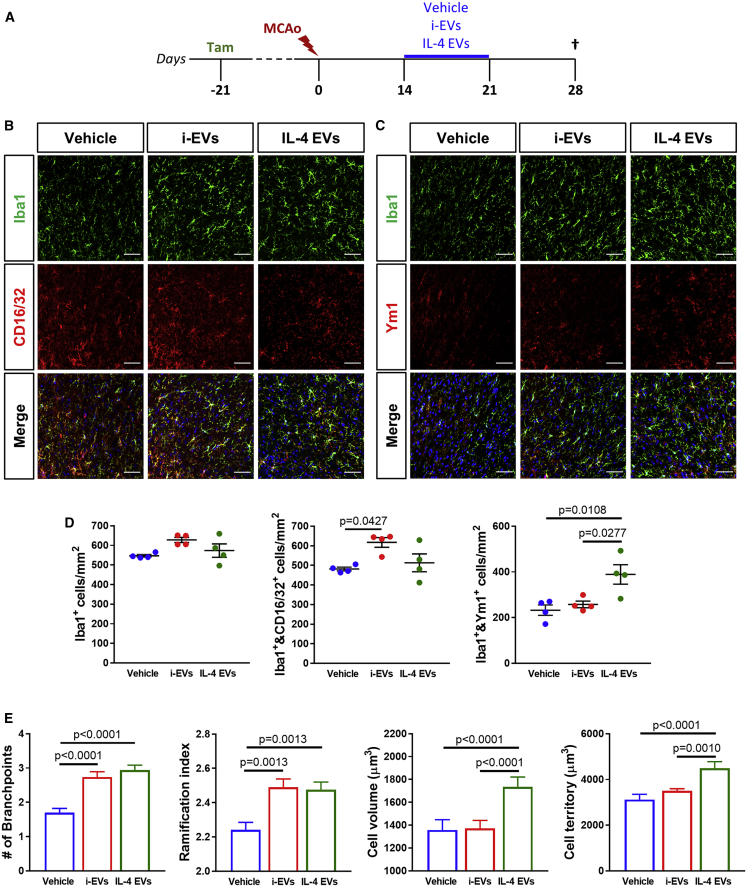
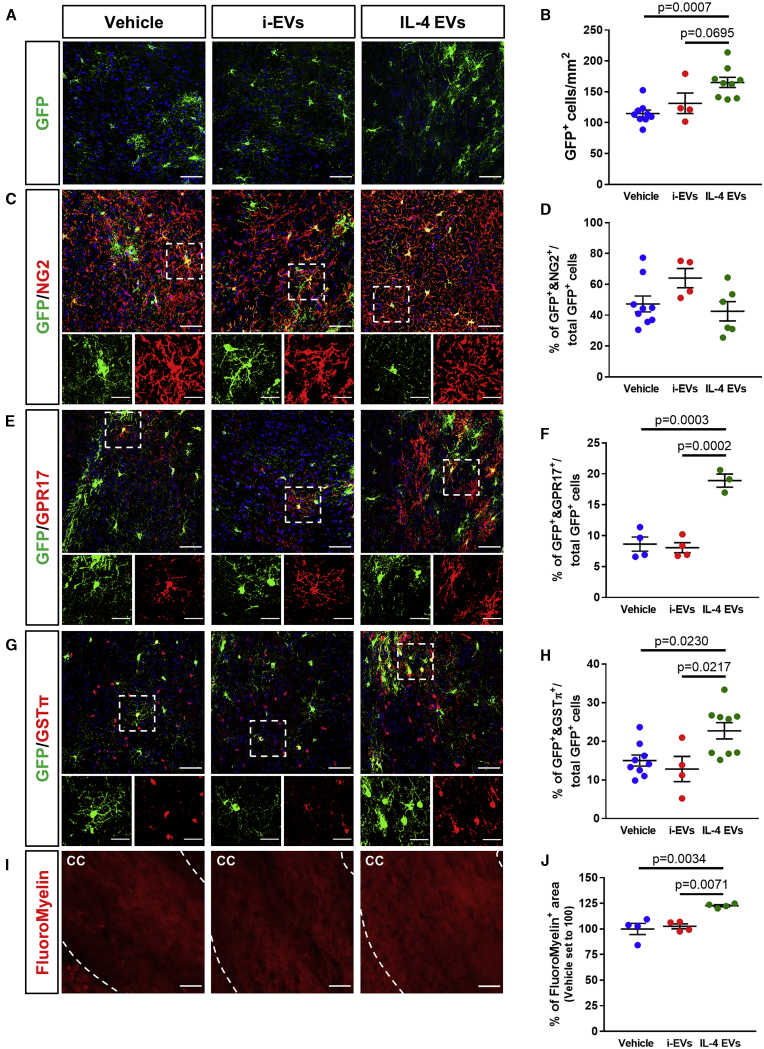
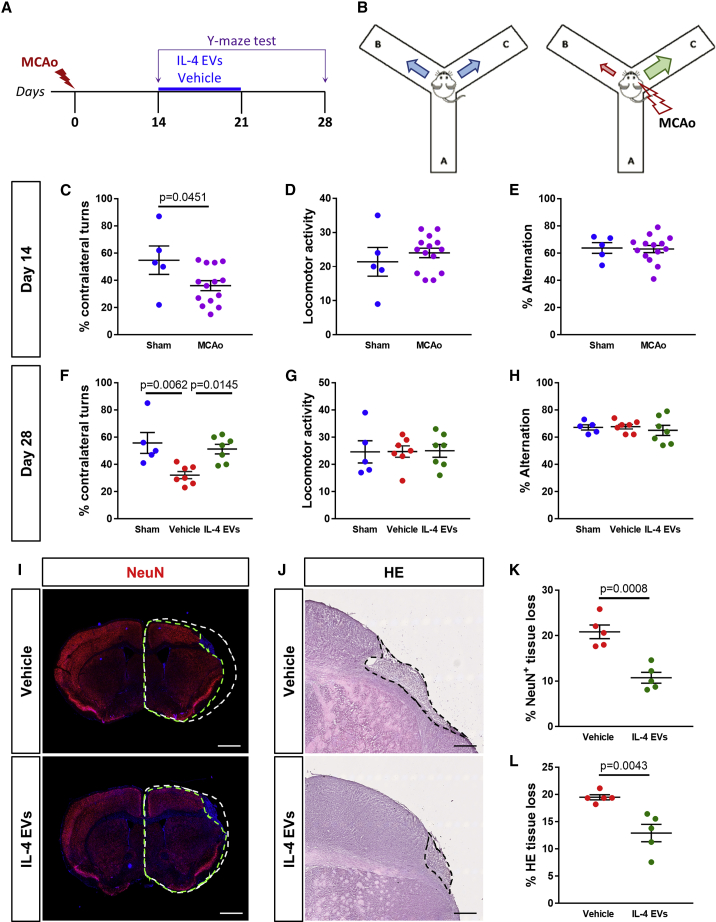
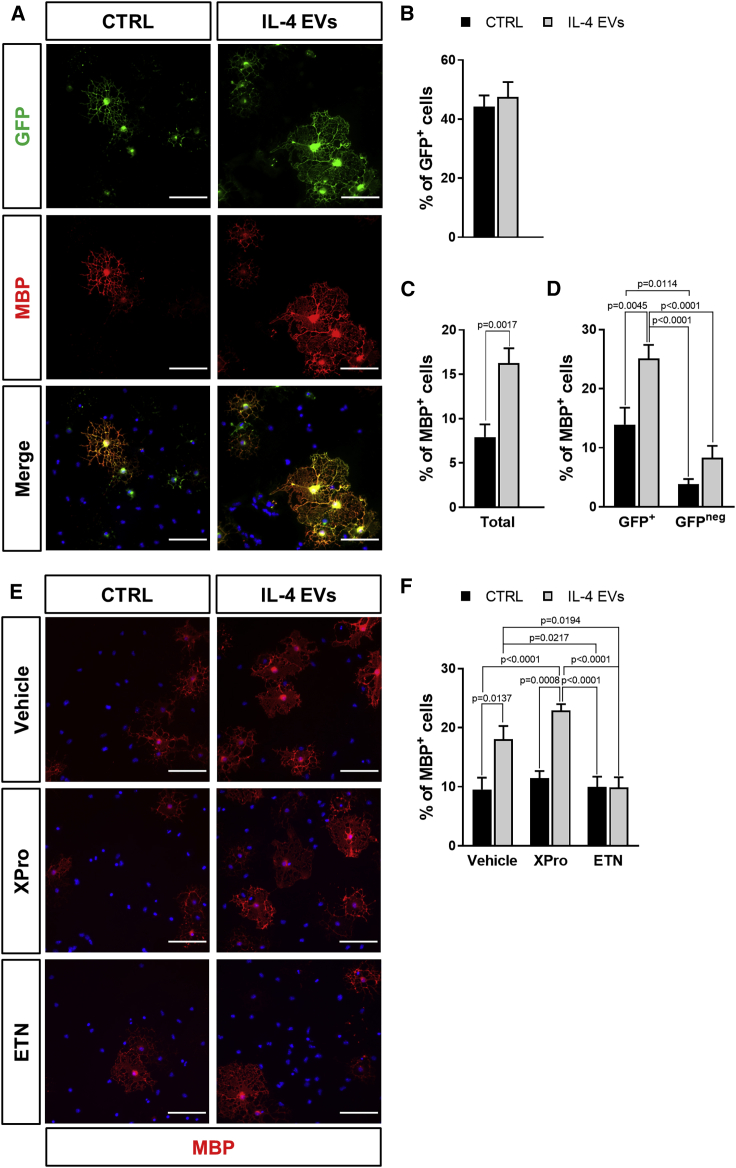
Contrasting myelin damage through the generation of new myelinating oligodendrocytes represents a promising approach to promote functional recovery after stroke. Here, we asked whether activation of microglia and monocyte-derived macrophages affects the regenerative process sustained by G protein-coupled receptor 17 (GPR17)-expressing oligodendrocyte precursor cells (OPCs), a subpopulation of OPCs specifically reacting to ischemic injury. GPR17-iCreERT2:CAG-eGFP reporter mice were employed to trace the fate of GPR17-expressing OPCs, labeled by the green fluorescent protein (GFP), after permanent middle cerebral artery occlusion. By microglia/macrophages pharmacological depletion studies, we show that innate immune cells favor GFP+ OPC reaction and limit myelin damage early after injury, whereas they lose their pro-resolving capacity and acquire a dystrophic "senescent-like" phenotype at later stages. Intracerebral infusion of regenerative microglia-derived extracellular vesicles (EVs) restores protective microglia/macrophages functions, limiting their senescence during the post-stroke phase, and enhances the maturation of GFP+ OPCs at lesion borders, resulting in ameliorated neurological functionality. In vitro experiments show that EV-carried transmembrane tumor necrosis factor (tmTNF) mediates the pro-differentiating effects on OPCs, with future implications for regenerative therapies.

Keywords: GPR17 receptor; TNF; cerebral ischemia; extracellular vesicles; functional recovery; microglia; neuroinflammation; oligodendrocyte precursor cells; remyelination; tumor necrosis factor.


Conflict of interest statement

The authors declare no competing interests.

Figures

None
Graphical abstract
Figure 1
Figure 1
Microglia/macrophage activation at the boundary of the ischemic lesion increases over time after MCAo (A) Schematic representation of the experimental protocol exploited to study microglial activation following MCAo. (B) Representative images of Iba1+ cells at the boundary of the ischemic lesion (0−500 μm) at days 1, 3, 7, and 14 after MCAo and in the corresponding region of the contralateral hemisphere at day 1 post-MCAo. Scale bars, 50 μm. Magnifications show ischemia-induced modifications of Iba1+ cell morphology; scale bars, 25 μm. (C) Representative images of CD16/32+ cells at the boundary of the ischemic lesion (0−500 μm) at days 1, 3, 7, and 14 after MCAo and in the corresponding region of the contralateral hemisphere at day 1 post-MCAo. Scale bars, 50 μm. (D) Representative images of Ym1+ cells at the boundary of the ischemic lesion (0−500 μm) at days 1, 3, 7, and 14 after MCAo and in the corresponding region of the contralateral hemisphere at day 1 post-MCAo. Scale bars, 50 μm. (E) Quantification of the density of Iba1+ cells at the boundary of the ischemic lesion (0−500 μm) and in the corresponding region of the contralateral hemisphere at days 1, 3, 7, and 14 after MCAo (n = 3). Data are expressed as mean ± SE. Two-way ANOVA (interaction p < 0.0001, time p < 0.0001, MCAo p < 0.0001) followed by Tukey’s post hoc analysis (p values relative to multiple comparisons are reported in the tables). (F) Quantification of the density of Iba1+ cells co-expressing the pro-inflammatory marker CD16/32 at the boundary of the ischemic lesion (0−500 μm) and in the corresponding region of the contralateral hemisphere at day 1, 3, 7, and 14 after MCAo (n = 3). Data are expressed as mean ± SE. Two-way ANOVA (interaction p < 0.0001, time p < 0.0001, MCAo p < 0.0001) followed by Tukey’s post hoc analysis (p values relative to multiple comparisons are reported in the tables). (G) Quantification of the density of Iba1+ cells co-expressing the pro-regenerative marker Ym1 at the boundary of the ischemic lesion (0−500 μm) and in the corresponding region of the contralateral hemisphere at days 1, 3, 7, and 14 after MCAo (n = 3). Data are expressed as mean ± SE. Two-way ANOVA (interaction p = 0.0967, time p = 0.2763, MCAo p < 0.0001) followed by Tukey’s post hoc analysis (p values relative to multiple comparisons are reported in the tables).
Figure 2
Figure 2
Partial depletion of microglia/macrophages in the early phase after MCAo impairs GPR17-expressing (GFP+) OPC response and exacerbates myelin damage (A) Schematic representation of the experimental protocol exploited for early depletion of microglia/macrophages after MCAo. (B) Representative images of cells stained for Iba1, CD16/32, Ym1, GFP, and GFP/BrdU at the boundary of the ischemic lesion (0−500 μm) at day 3 post-MCAo following intranasal administration of GdCl3 or vehicle. Arrowheads indicate cells double positive for GFP and BrdU. Scale bars, 50 μm. (C) Quantification of the density of total Iba1+, Iba1+ and CD16/32+, and Iba1+ and Ym1+ cells at the boundary of the ischemic lesion (0−500 μm) at day 3 post-MCAo following intranasal administration of GdCl3 or vehicle (n = 4). Data are expressed as mean ± SE. Student’s t test. (D) Quantification of the density of GFP+ OPCs and of the percentage of GFP+ cells incorporating BrdU at the boundary of the ischemic lesion (0−500 μm) at day 3 post-MCAo following intranasal administration of GdCl3 or vehicle (n = 4). Data are expressed as mean ± SE. Student’s t test. (E) Scatterplot representation of the linear correlation between the densities of Iba1+ cells (x axis) and GFP+ OPCs (y axis) at the boundary of the ischemic lesion (0−500 μm) at day 3 post-MCAo. Green dots correspond to GdCl3-treated animals, whereas blue dots represent vehicle-treated animals. For correlation analysis, two-tailed Pearson test was used. (F) Representative electron micrographs showing myelinated axons in the ipsilateral corpus callosum (CC) of ischemic mice at day 3 post-MCAo following intranasal administration of GdCl3 or vehicle and in the corresponding region of the contralateral hemisphere of vehicle-treated animals. Scale bars, 1 μm. (G) Quantification of g-ratio, myelin thickness, axon diameter, and myelinated axon density in the ipsilateral corpus callosum of ischemic mice at day 3 post-MCAo following intranasal administration of GdCl3 or vehicle and in the corresponding region of the contralateral hemisphere of vehicle-treated animals (n = 3; 300 fibers/experimental condition have been analyzed). Data are expressed as mean ± SE. One-way ANOVA followed by Tukey’s post hoc analysis.
Figure 3
Figure 3
Partial depletion of microglia/macrophages at the late stage after MCAo promotes a GFP+ OPC response but has no impact on their maturation (A) Schematic representation of the experimental protocol exploited for late depletion of microglia/macrophages after MCAo. (B) Representative images of cells stained for Iba1, CD16/32, Ym1, and GFP at the boundary of the ischemic lesion (0−500 μm) at day 17 post-MCAo following intranasal administration of GdCl3 or vehicle. Scale bars, 50 μm. (C) Quantification of the density of total Iba1+, Iba1+ and CD16/32+, and Iba1+ and Ym1+ cells at the boundary of the ischemic lesion (0−500 μm) at day 17 post-MCAo following intranasal administration of GdCl3 or vehicle (n = 5). Data are expressed as mean ± SE. Student’s t test. (D) Quantification of the density of GFP+ OPCs at the boundary of the ischemic lesion (0−500 μm) at day 17 post-MCAo following intranasal administration of GdCl3 or vehicle (n = 6). Data are expressed as mean ± SE. Student’s t test. (E) Scatterplot representation of the linear correlation between the densities of Iba1+ cells (x axis) and GFP+ OPCs (y axis) at the boundary of the ischemic lesion (0−500 μm) at day 17 post-MCAo. Green dots correspond to GdCl3-treated animals, whereas blue dots represent vehicle-treated animals. For correlation analysis, two-tailed Pearson test was used. (F) Representative images of cells stained for GFP and GSTπ at the boundary of the ischemic lesion (0−500 μm) at day 42 post-MCAo following intranasal administration of GdCl3 or vehicle. Scale bars, 50 μm. Magnifications show cells co-expressing GFP and GSTπ: scale bars, 25 μm. (G) Quantification of the density of total GFP+ OPCs and GFP+ and GSTπ+ cells at the boundary of the ischemic lesion (0−500 μm) at day 42 post-MCAo following intranasal administration of GdCl3 or vehicle (n = 5−6). Data are expressed as mean ± SE. Student’s t test. (H) Representative images of myelin visualized using FluoroMyelin Red stain in the corpus callosum (delimited by white dashed lines) at the boundary of the ischemic lesion (0−500 μm) at day 42 post-MCAo, following intranasal administration of GdCl3 or vehicle. Scale bars, 50 μm. (I) Quantification of the percentage of FluoroMyelin+ area in the corpus callosum at the boundary of the ischemic lesion (0−500 μm) at day 42 post-MCAo, following intranasal administration of GdCl3 or vehicle (n = 5−6). Data are expressed as mean ± SE and normalized to vehicle set to 100.
Figure 4
Figure 4
Infusion of pro-regenerative microglia-derived EVs at late stages after ischemia promotes a beneficial polarization of microglia/macrophages (A) Schematic representation of the experimental protocol exploited for the infusion of microglia-derived EVs after MCAo. (B) Representative images of cells stained for Iba1 and CD16/32 at the boundary of the ischemic lesion (0−500 μm) at day 28 post-MCAo, following infusion of i-EVs, IL-4 EVs, or vehicle. Scale bars, 50 μm. (C) Representative images of cells stained for Iba1 and Ym1 at the boundary of the ischemic lesion (0−500 μm) at day 28 post-MCAo, following infusion of i-EVs, IL-4 EVs, or vehicle. Scale bar, 50 μm. (D) Quantification of the density of total Iba1+, Iba1+ and CD16/32+, and Iba1+ and Ym1+ cells at the boundary of the ischemic lesion (0−500 μm) at day 28 post-MCAo, following infusion of i-EVs, IL-4 EVs, or vehicle (n = 4). Data are expressed as mean ± SE. One-way ANOVA followed by Tukey’s post hoc analysis. (E) Quantification of Iba1+ microglia/macrophage number of branchpoints, ramification index, cell volume, and cell territory at the boundary of the ischemic lesion (0−500 μm) at day 28 post-MCAo, following infusion of i-EVs, IL-4 EVs, or vehicle (130−150 cells from 3−4 animals/experimental condition have been analyzed). Data are expressed as mean ± SE. Kruskal-Wallis test followed by Dunn’s post hoc analysis.
Figure 5
Figure 5
Infusion of pro-regenerative microglia-derived EVs at late stages after ischemia enhances GFP+ OPC differentiation (A) Representative images of GFP+ OPCs at the boundary of the ischemic lesion (0−500 μm) at day 28 post-MCAo, following infusion of i-EVs, IL-4 EVs, or vehicle. Scale bars, 50 μm. (B) Quantification of the density of GFP+ OPCs at the boundary of the ischemic lesion (0−500 μm) at day 28 post-MCAo, following infusion of i-EVs, IL-4 EVs, or vehicle (n = 4−9). Data are expressed as mean ± SE. One-way ANOVA followed by Tukey’s post hoc analysis. (C) Representative images of cells stained for GFP and NG2 at the boundary of the ischemic lesion (0−500 μm) at day 28 post-MCAo, following infusion of i-EVs, IL-4 EVs, or vehicle. Scale bars, 50 μm. Magnifications show cells co-expressing GFP and NG2: scale bars, 25 μm. (D) Quantification of the percentage of GFP+ OPCs co-expressing NG2 at the boundary of the ischemic lesion (0−500 μm) at day 28 post-MCAo, following infusion of i-EVs, IL-4 EVs, or vehicle (n = 4−9). Data are expressed as mean ± SE. (E) Representative images of cells stained for GFP and GPR17 at the boundary of the ischemic lesion (0−500 μm) at day 28 post-MCAo, following infusion of i-EVs, IL-4 EVs, or vehicle. Scale bars, 50 μm. Magnifications show cells co-expressing GFP and GPR17: scale bars, 25 μm. (F) Quantification of the percentage of GFP+ OPCs co-expressing GPR17 at the boundary of the ischemic lesion (0−500 μm) at day 28 post-MCAo, following infusion of i-EVs, IL-4 EVs, or vehicle (n = 3−4). Data are expressed as mean ± SE. One-way ANOVA followed by Tukey’s post hoc analysis. (G) Representative images of cells stained for GFP and GSTπ at the boundary of the ischemic lesion (0−500 μm) at day 28 post-MCAo, following infusion of i-EVs, IL-4 EVs, or vehicle. Scale bars, 50 μm. Magnifications show cells co-expressing GFP and GSTπ: scale bars, 25 μm. (H) Quantification of the percentage of GFP+ OPCs co-expressing GSTπ at the boundary of the ischemic lesion (0−500 μm) at day 28 post-MCAo, following infusion of i-EVs, IL-4 EVs or vehicle (n = 4−9). Data are expressed as mean ± SE. One-way ANOVA followed by Tukey’s post hoc analysis. (I) Representative images of myelin visualized using FluoroMyelin Red stain in the corpus callosum (delimited by white dashed lines) at the boundary of the ischemic lesion (0−500 μm) at day 28 post-MCAo, following infusion of i-EVs, IL-4 EVs, or vehicle. Scale bars, 50 μm. (J) Quantification of the percentage of FluoroMyelin+ area in the corpus callosum at the boundary of the ischemic lesion (0−500 μm) at day 28 post-MCAo, following infusion of i-EVs, IL-4 EVs, or vehicle (n = 4). Data are expressed as mean ± SE and normalized to vehicle set to 100. One-way ANOVA followed by Tukey’s post hoc analysis.
Figure 6
Figure 6
Infusion of pro-regenerative microglia-derived EVs at late stages after ischemia promotes functional recovery of ischemic mice (A) Schematic representation of the experimental protocol exploited for behavioral analysis before and after the infusion of microglia-derived EVs after MCAo. (B) Schematic representation of the Y-maze test to evaluate the turning preference of ischemic mice. (C) Quantification of the percentage of contralateral turns made in the Y-maze test at day 14 post-MCAo by MCAo mice (n = 14) and sham-operated controls (n = 5). Data are expressed as mean ± SE. Student’s t test. (D) Quantification of the locomotor activity of MCAo mice (n = 14) and sham-operated controls (n = 5) during the Y-maze test at day 14 post-MCAo. Data are expressed as mean ± SE. (E) Quantification of the percentage of spontaneous alternations made in the Y-maze test at day 14 post-MCAo by MCAo mice (n = 14) and sham-operated controls (n = 5). Data are expressed as mean ± SE. (F) Quantification of the percentage of contralateral turns made in the Y-maze test at day 28 post-MCAo by sham-operated controls (n = 5) and MCAo mice after infusion of IL-4 EVs (n = 7) or vehicle (n = 7). Data are expressed as mean ± SE. One-way ANOVA followed by Tukey’s post hoc analysis. (G) Quantification of the locomotor activity of sham-operated controls (n = 5) and MCAo mice after infusion of IL-4 EVs (n = 7) or vehicle (n = 7) during the Y-maze test at day 28 post-MCAo. Data are expressed as mean ± SE. (H) Quantification of the percentage of spontaneous alternations made in the Y-maze test at day 28 post-MCAo by sham-operated controls (n = 5) and MCAo mice after infusion of IL-4 EVs (n = 7) or vehicle (n = 7). Data are expressed as mean ± SE. (I) Representative images of NeuN+ tissue at day 28 post-MCAo, following infusion of IL-4 EVs or vehicle. Green dashed lines delineate the area of NeuN staining in the ipsilateral hemisphere. White dashed lines correspond to the projection of the NeuN+ area in the intact contralateral hemisphere. Scale bars, 1 mm. (J) Representative images of the ischemic region in hematoxylin-eosin (H&E) stained sections at day 28 post-MCAo, following infusion of IL-4 EVs or vehicle. Black dashed lines delineate the ischemic core. Scale bars, 400 μm. (K) Quantification of the percentage of NeuN+ tissue loss at day 28 post-MCAo after infusion of IL-4 EVs or vehicle (n = 5). Data are expressed as mean ± SE. Student’s t test. (L) Quantification of the percentage of H&E-labeled tissue loss at day 28 post-MCAo after infusion of IL-4 EVs or vehicle (n = 5). Data are expressed as mean ± SE. Student’s t test.
Figure 7
Figure 7
Direct effects of microglial IL-4 EVs on GFP+ OPC maturation in vitro (A) Representative images showing cells expressing GFP and MBP in primary OPC cultures from GPR17-iCreERT2:CAG-EGFP mice exposed to IL-4 EVs or medium alone (CTRL). Scale bars, 50 μm. (B) Quantification of the percentage of GFP+ cells in primary OPC cultures from GPR17-iCreERT2:CAG-EGFP mice exposed to IL-4 EVs or CTRL. Data are expressed as mean ± SE (n = 9 coverslips from 3 independent experiments). (C) Quantification of the total percentage of MBP+ cells in primary OPC cultures from GPR17-iCreERT2:CAG-EGFP mice exposed to IL-4 EVs or CTRL. Data are expressed as mean ± SE (n = 9 coverslips from 3 independent experiments). Student’s t test. (D) Quantification of the percentage of GFP+ and GFPneg cells co-expressing MBP in primary OPC cultures from GPR17-iCreERT2:CAG-EGFP mice exposed to IL-4 EVs or CTRL. Data are expressed as mean ± SE (n = 9 coverslips from 3 independent experiments). One-way ANOVA followed by Tukey’s post hoc analysis. (E) Representative images showing MBP+ cells in primary OPC cultures exposed to IL-4 EVs or CTRL in the presence or absence of the selective solTNF inhibitor XPro1595 (XPro) and of the nonselective TNF inhibitor etanercept (ETN). Scale bars, 50 μm. (F) Quantification of the total percentage of MBP+ cells in primary OPC cultures exposed to IL-4 EVs or CTRL in the presence or absence of XPro or ETN. Data are expressed as mean ± SE (n = 9 coverslips from 3 independent experiments). One-way ANOVA followed by Tukey’s post hoc analysis.

References

    1. Benjamin E.J., Muntner P., Alonso A., Bittencourt M.S., Callaway C.W., Carson A.P., Chamberlain A.M., Chang A.R., Cheng S., Das S.R. Heart Disease and Stroke Statistics−2019 Update: A Report From the American Heart Association. Circulation. 2019;139:e56–e528. - PubMed
    1. Zhao L.-R., Willing A. Enhancing endogenous capacity to repair a stroke-damaged brain: An evolving field for stroke research. Prog. Neurobiol. 2018;163-164:5–26. - PMC - PubMed
    1. Rost N.S., Cougo P., Lorenzano S., Li H., Cloonan L., Bouts M.J.R.J., Lauer A., Etherton M.R., Karadeli H.H., Musolino P.L. Diffuse microvascular dysfunction and loss of white matter integrity predict poor outcomes in patients with acute ischemic stroke. J. Cereb. Blood Flow Metab. 2018;38:75–86. - PMC - PubMed
    1. Marshall R.S. Progress in intravenous thrombolytic therapy for acute stroke. JAMA Neurol. 2015;72:928–934. - PubMed
    1. Duncan I.D., Brower A., Kondo Y., Curlee J.F., Jr., Schultz R.D. Extensive remyelination of the CNS leads to functional recovery. Proc. Natl. Acad. Sci. USA. 2009;106:6832–6836. - PMC - PubMed

Publication types

MeSH terms

Substances