. 2021 Jan:146:103487.
doi: 10.1016/j.fgb.2020.103487. Epub 2020 Dec 9.

Conditional promoters to investigate gene function during wheat infection by Zymoseptoria tritici

Affiliations

Conditional promoters to investigate gene function during wheat infection by Zymoseptoria tritici

Elena Fantozzi et al. Fungal Genet Biol. 2021 Jan.

Abstract

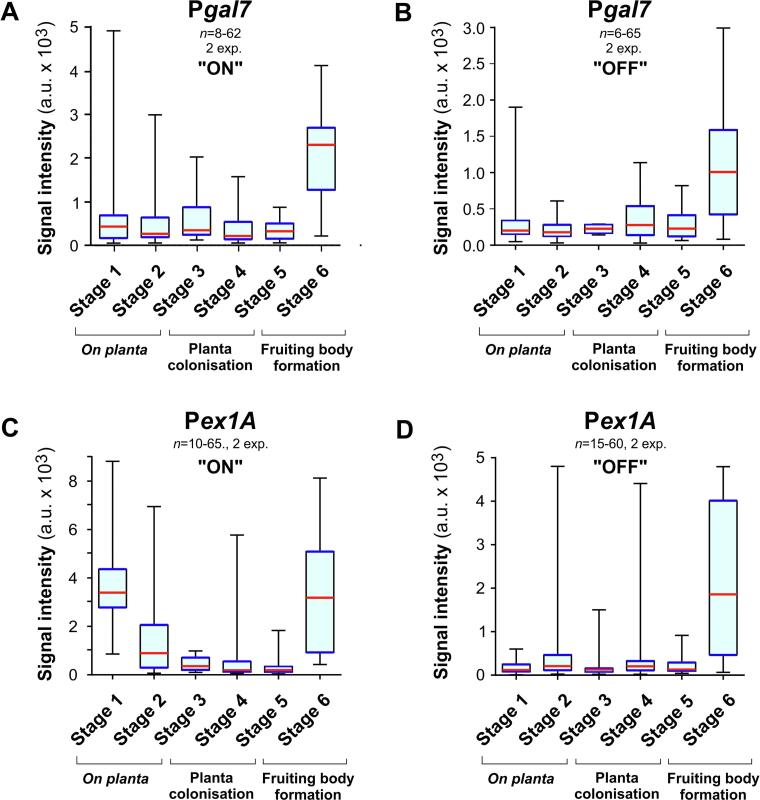
The fungus Zymoseptoria tritici causes Septoria tritici leaf blotch, which poses a serious threat to temperate-grown wheat. Recently, we described a raft of molecular tools to study the biology of this fungus in vitro. Amongst these are 5 conditional promoters (Pnar1, Pex1A, Picl1, Pgal7, PlaraB), which allow controlled over-expression or repression of target genes in cells grown in liquid culture. However, their use in the host-pathogen interaction in planta was not tested. Here, we investigate the behaviour of these promoters by quantitative live cell imaging of green-fluorescent protein-expressing cells during 6 stages of the plant infection process. We show that Pnar1 and Picl1 are repressed in planta and demonstrate their suitability for studying essential gene expression and function in plant colonisation. The promoters Pgal7 and Pex1A are not fully-repressed in planta, but are induced during pycnidiation. This indicates the presence of inducing galactose or xylose and/or arabinose, released from the plant cell wall by the activity of fungal hydrolases. In contrast, the PlaraB promoter, which normally controls expression of an α-l-arabinofuranosidase B, is strongly induced inside the leaf. This suggests that the fungus is exposed to L-arabinose in the mesophyll apoplast. Taken together, this study establishes 2 repressible promoters (Pnar1 and Picl1) and three inducible promoters (Pgal7, Pex1A, PlaraB) for molecular studies in planta. Moreover, we provide circumstantial evidence for plant cell wall degradation during the biotrophic phase of Z. tritici infection.

Keywords: Conditional promoters; Plant cell wall-degrading enzymes; Plant-pathogen interaction; Septoria tritici leaf blotch.


Conflict of interest statement

The authors declare that they have no known competing financial interests or personal relationships that could have appeared to influence the work reported in this paper.

Figures

Fig. 1
Fig. 1
Infection stages of Z. tritici in wheat. (A) Stage 1, “Surface resting”. Spores can rest for an extended time on the leaf surface before switching to hyphal growth. (B) Stage 2, “Surface exploration”. After the morphogenic transition to hyphal growth, hyphae grow on the surface of the plant epidermis, thereby randomly “finding” stomata (Fones et al., 2017). (C) Stage 3, “Stoma invasion”. Hyphae enter the open stomatal aperture into the substomatal cavity. This penetration event was reported to occur for up to 13 dpi (Fantozzi et al., 2020). (D) Stage 4, “Mesophyll colonisation”. Once inside the plant tissue, hyphae branch and colonise the apoplastic space of the mesophyll, which includes the intercellular airspace and the plant cell walls. During this infection phase, the fungus secretes PCWDEs (blue dots; see Table 1). (E) Stage 5, “Fruiting body initiation”. When reaching new stomata, colonising hyphae begin to line the cavity and fill the space under the stoma with hyphae. The formation of fruiting bodies coincides with first signs of chlorosis (yellow cells). (F) Stage 6, “Fruiting body maturation”. Hyphae have filled the substomatal cavity and the fruiting body (pycnidium) forms multi-cellular spores. Live cell imaging has estimated that each pycnidium releases ~ 300 spores (Fones and Gurr, 2015). At this stage, plant cells are undergoing programmed cell death (Keon et al., 2007), which is thought to be initiated by necrosis factors (Kettles and Kanyuka, 2016). The figure was modified from (Fantozzi et al., 2020). (For interpretation of the references to colour in this figure legend, the reader is referred to the web version of this article.)
Fig. 2
Fig. 2
Regulation of conditional promoters by various saccharides. (A) Signal intensity of cytoplasmic eGFP, expressed under the conditional promoters Pgal7, PlaraB, Picl1 and Pex1A after 2 days growth in minimal media, supplemented with 2% (w v−1) glucose, galactose, xylose, L-arabinose, L-rhamnose, fructose and sucrose. Several data sets are non-normally distributed (Shapiro -Wilk test, P > 0.05) and are therefore given as Whiskers' plots (blue lines: 25/75 percentiles; red line: median, whiskers: minimum and maximum values). Note that Pgal7 and Picl1 are not tightly repressed in the presence of most sugars and that PexA1 is induced by xylose and arabinose. Known promoter inducers are indicated in red. (B) Images showing induction of Pex1A, indicated by cytoplasmic eGFP expression, in Z. tritici cells, grown in minimal medium, supplemented with 2% xylose and 2% L-arabinose (w v−1). Cytoplasmic GFP fluorescence is shown in green, the edge of the spores is shown in blue. Scale bar represents 15 µm. (For interpretation of the references to colour in this figure legend, the reader is referred to the web version of this article.)
Fig. 3
Fig. 3
The use of conditional promoters to repress gene expression in planta. (A) Confocal images showing a hypha of strain IPO323_Pnar1G_mChSso1 in wheat leaf tissue at 14dpi. The fungal plasma membrane is labelled with the red-fluorescent syntaxin mCherry-Sso1 (Kilaru et al., 2017; arrowheads in left image) and were co-detected with the auto-fluorescence of plant chloroplasts (asterisks in left panel). Due to repression of Pnar1, cells do not express cytoplasmic eGFP (right panel, green). Scale bar represents 10 µm. (B) Whiskers' plot showing average signal intensities of cytoplasmic eGFP, expressed under Pnar1 that normally controls the expression of nitrate reductase, in the six stages of wheat leaf infection. Note that plants were infected with cells that were grown in “ON” condition, where NO3 was provided as a nitrogen source. Sample size 14–63 structures from 2 experiments. (C) Whiskers' plot showing average signal intensities of cytoplasmic eGFP, expressed under Pnar1, in the six stages of wheat leaf infection. Note that plants were infected with cells that were grown in “OFF” condition, where NH4+ was present in the medium. Note that the initial induction of cells on the plant surface is abolished. Sample size 14–55 structures from 2 experiments. (D) Whiskers' plot showing average signal intensities of cytoplasmic eGFP, expressed under Picl1 that normally controls the expression of isocitrate lyase, in the six stages of wheat leaf infection. Note that plants were infected with cells that were grown in “ON” condition, where sodium acetate was provided as inducer. Sample size 5–58 structures from 2 experiments. (E) Whiskers' plot showing average signal intensities of cytoplasmic eGFP, expressed under Picl1, in the six stages of wheat leaf infection. Note that plants were infected with cells that were grown in “OFF” condition, where glucose was provided as carbon source. Note that the promoter was still induced in stage 1, suggesting the presence of acetate on the plant surface. Sample size 9–62 structures from 2 experiments. (F) Whiskers' plot showing relative signal intensities of cytoplasmic eGFP, expressed under Pnar1 and Picl1 relative to eGFP fluorescence, driven from the α-tubulin promoter Ptub2 (set to 100%, red dotted line). Cells were analysed in wheat leaf tissue at stage 4 (Mesophyll colonisation). All plant sample preparations, spinning-disc microscopy and measurements were done under identical condition to allow direct comparison between all strains. Sample size 49–50 structures from 2 experiments. As numerous data sets are non-normally distributed (Shapiro -Wilk test, P > 0.05), all data in (B-F) and are given as Whiskers' plots (blue lines: 25/75 percentiles; red line: median, whiskers: minimum and maximum values).
Fig. 4
Fig. 4
The use of the promoter Pnar1 to study the role of the essential gene α-tubulin during Z. tritici plant colonization. (A) Organisation of vector pHPnar1Tub2. The vector is designed for homologous integration of the inducible/repressible promoter Pnar1 in front of the open reading frame of the Z. tritici α-tubulin (tub2). Note that fragments are not drawn to scale. (B) Colony formation of conditional Z. tritici mutants, expressing the endogenous α-tubulin gene (tub2, Kilaru et al., 2015b) under the control of Pnar1. Cells grow in the presence of NO3 (YPD/KNO3; ON), when the essential tub2 gene is expressed, but do not form colonies in the absence of this nitrogen source (YPD, OFF). Note that the presence of NH4+ actively represses Pnar1. (C) Confocal images showing wheat leaf colonisation by strain IPO323_ZtG (Control) and strain IPO323_ZtG_Pnar1Tub2, which expresses α-tubulin under the Pnar1 promoter (Pnar1-t2) at 12dpi. Chloroplasts are detected by their auto-fluorescence (red) the fungus is detected by GFP-fluorescence (green). Scale bar represents 50 µm. (D) Confocal images of colonisation of the substomatal cavities in wheat leaves, infected with IPO323_ZtG (Control) and strain IPO323_ZtG_Pnar1Tub2 (Pnar1-t2) at 17 dpi. GFP fluorescence in the fungal cytoplasm is shown in green, the plant surface, detected by its auto-fluorescence, is shown in grey. Stomata in the right panel are highlighted by yellow asterisks. Scale bar represents 100 µm. (E) Percentage of pycnidia in wheat leaves, infected with IPO323_ZtG (Control) and strain IPO323_ZtG_Pnar1Tub2 (Pnar1-t2) at 21dpi. No pycnidia were found leaves infected with the conditional mutant. Bars represent mean ± SEM, sample size n = 4 experiments. (F) Septoria tritici blotch disease symptoms on wheat leaves at 21 days after infection with IPO323_ZtG (Control) and strain IPO323_ZtG_Pnar1Tub2 (Pnar1-t2). Note that the dark spots in Control leaves represent fungal fruiting bodies (pycnidia). Note that the yellow colour of leaves infected with strain IPO323_ZtG_Pnar1Tub2 (Pnar-t2) is most likely a consequence of the initial invasion of mutant hyphae, as such discolouration is only rarely found in negative control experiments, where leaves are treated only with 0.04% (v v−1) Tween 20, which breaks the surface tension during application of fungal spore suspensions onto wheat leaves. (For interpretation of the references to colour in this figure legend, the reader is referred to the web version of this article.)
Fig. 5
Fig. 5
The promoters Pgal7 and Pex1A are neither repressed, nor induced during the biotrophic phase of plant colonisation. (A) Whiskers' plot showing average signal intensities of cytoplasmic eGFP, expressed under Pgal7, normally controlling the expression of galactose-1-phosphate uridylyltransferase, in the six stages of wheat leaf infection. Note that plants were infected with cells that were grown in “ON” condition, where the inducing galactose was as sole carbon source. Sample size 8–62 structures from 2 experiments. (B) Whiskers' plot showing average signal intensities of cytoplasmic eGFP, expressed under Pgal7, in the six stages of wheat leaf infection. Note that plants were infected with cells that were grown in “OFF” condition, with glucose being the sole carbon source. Even when grown under repression, the promoter shows significant activity, indicated by fluorescent signal from the reporter eGFP. This suggests that the fungus encounters plant cell wall-derived galactose during the colonisation of the plant. Sample size 6–65 structures from 2 experiments. (C) Whiskers' plot showing average signal intensities of cytoplasmic eGFP, expressed under Pex1A that normally controls 1,4-β-endoxylanase A, in the six stages of wheat leaf infection. Note that plants were infected with cells that were grown in “ON” condition, where expression-inducing xylose was provided as sole carbon source. Sample size 10–65 structures from 2 experiments. (D) Whiskers' plot showing average signal intensities of cytoplasmic eGFP, expressed under Pex1A, in the six stages of wheat leaf infection. Plants were infected with cells that were grown in “OFF” condition, with expression-repressing maltodextrin as sole carbon source. Even under this condition, the promoter does not tightly repress expression of the reporter eGFP, suggesting that the fungus encounters plant cell wall-derived xylose and/or arabinose during the colonisation of the plant. Sample size 15–60 structures from 2 experiments. As numerous data sets are non-normally distributed (Shapiro -Wilk test, P > 0.05), all data are given as Whiskers' plots (blue lines: 25/75 percentiles; red line: median, whiskers: minimum and maximum values). (For interpretation of the references to colour in this figure legend, the reader is referred to the web version of this article.)
Fig. 6
Fig. 6
The PlaraB promoter is strongly induced during plant infection. (A) Confocal images showing a hypha of strain IPO323_PlaraBG_mChSso1 in wheat leaf tissue at 12dpi. The fungal plasma membrane is labelled with the red-fluorescent syntaxin mCherry-Sso1 (Kilaru et al., 2017; arrowheads in left image) and were co-detected with the auto-fluorescence of plant chloroplasts (asterisks in left panel). Due to induction of PlaraB, cells express cytoplasmic eGFP (green). Scale bar represents 10 µm. (B) Whiskers' plot showing average signal intensities of cytoplasmic eGFP, expressed under PlaraB that normally controls the expression of an α-l-arabinofuranosidase B, in the six stages of wheat leaf infection. Note that plants were infected with cells that were grown in “ON” condition, where arabinose was provided as a carbon source. Sample size 17–52 structures from 2 experiments. (C) Whiskers' plot showing average signal intensities of cytoplasmic eGFP, expressed under PlaraB, in the six stages of wheat leaf infection. Note that plants were infected with cells that were grown in “OFF” condition, where glucose was provided as a carbon source. Sample size 10–44 structures from 2 experiments. As numerous data sets are non-normally distributed (Shapiro -Wilk test, P > 0.05), all data in (B, C) are given as Whiskers' plots (blue lines: 25/75 percentiles; red line: median, whiskers: minimum and maximum values). (For interpretation of the references to colour in this figure legend, the reader is referred to the web version of this article.)

References

    1. Bielska E., Higuchi Y., Schuster M., Steinberg N., Kilaru S., Talbot N.J., Steinberg G. Long-distance endosome trafficking drives fungal effector production during plant infection. Nat. Commun. 2014;5:5097. - PMC - PubMed
    1. Bottin A., Kämper J., Kahmann R. Isolation of a carbon source-regulated gene from Ustilago maydis. Mol. Gen. Genet. 1996;253:342–352. - PubMed
    1. Brunner P.C., Torriani S.F., Croll D., Stukenbrock E.H., McDonald B.A. Coevolution and life cycle specialization of plant cell wall degrading enzymes in a hemibiotrophic pathogen. Mol. Biol. Evol. 2013;30:1337–1347. - PMC - PubMed
    1. Burke D., Kaufman P., McNeil M., Albersheim P. The structure of plant cell walls: VI. A survey of the walls of suspension-cultured monocots. Plant Physiol. 1974;54:109–115. - PMC - PubMed
    1. Cairns T.C., Sidhu Y.S., Chaudhari Y.K., Talbot N.J., Studholme D.J., Haynes K. Construction and high-throughput phenotypic screening of Zymoseptoria tritici over-expression strains. Fungal Genet. Biol. 2015;79:110–117. - PMC - PubMed

Publication types

MeSH terms

Substances

Supplementary concepts

LinkOut - more resources