. 2021 Jan-Jun:296:100182.
doi: 10.1074/jbc.RA120.013908. Epub 2020 Dec 17.

ATP13A3 is a major component of the enigmatic mammalian polyamine transport system

Affiliations

ATP13A3 is a major component of the enigmatic mammalian polyamine transport system

Norin Nabil Hamouda et al. J Biol Chem. 2021 Jan-Jun.

Abstract

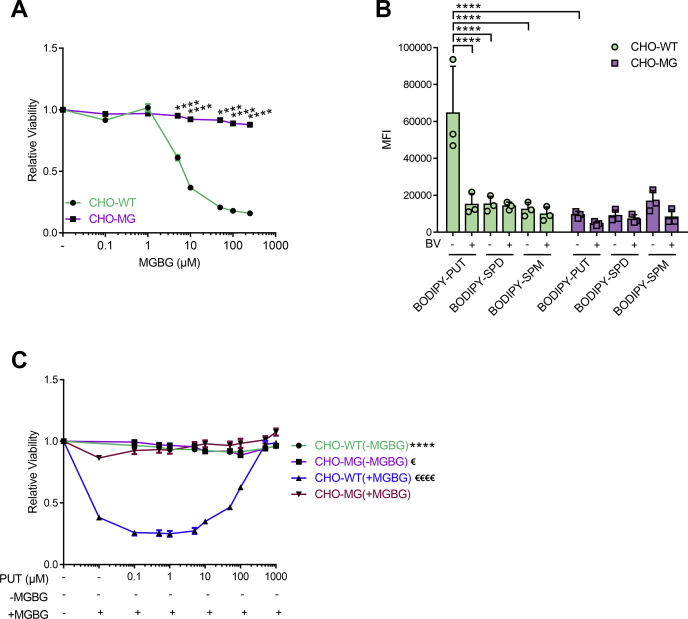
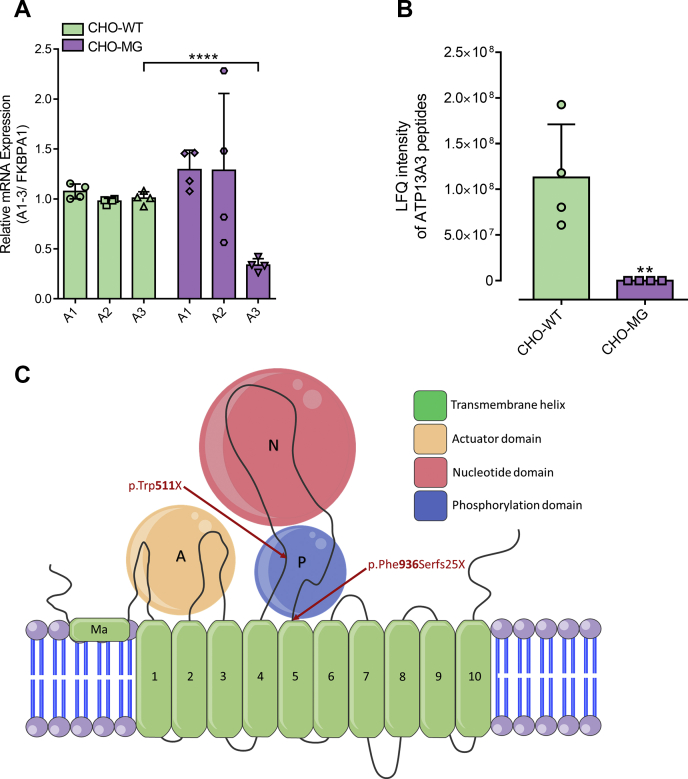
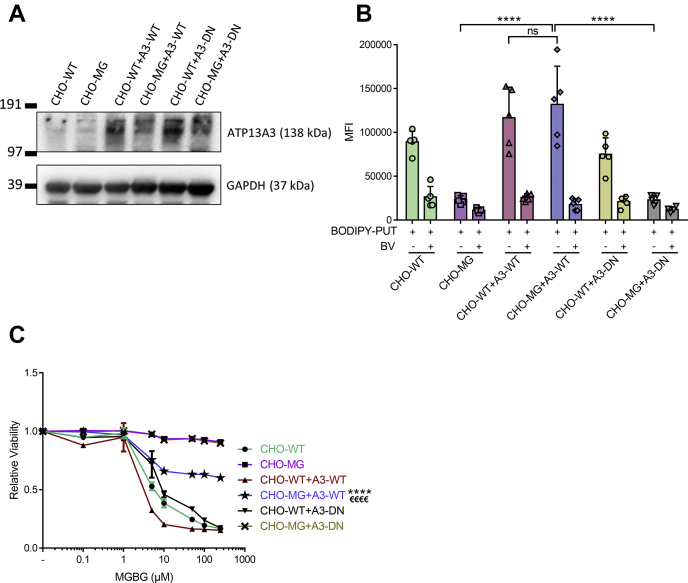
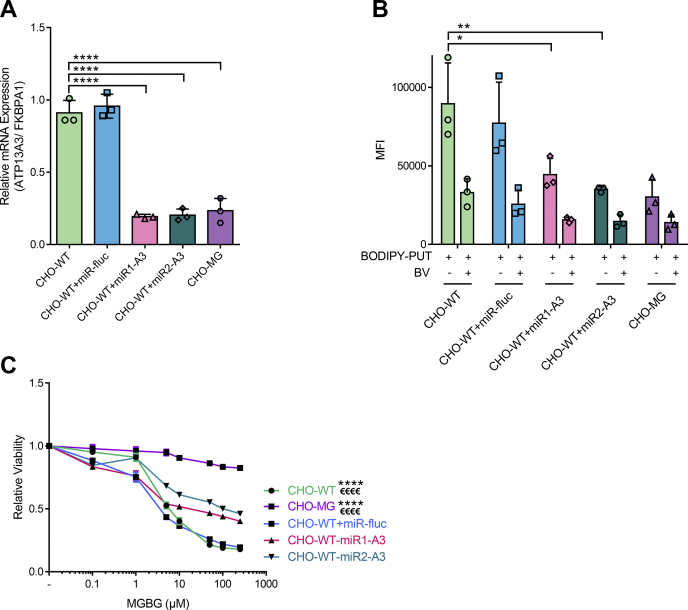
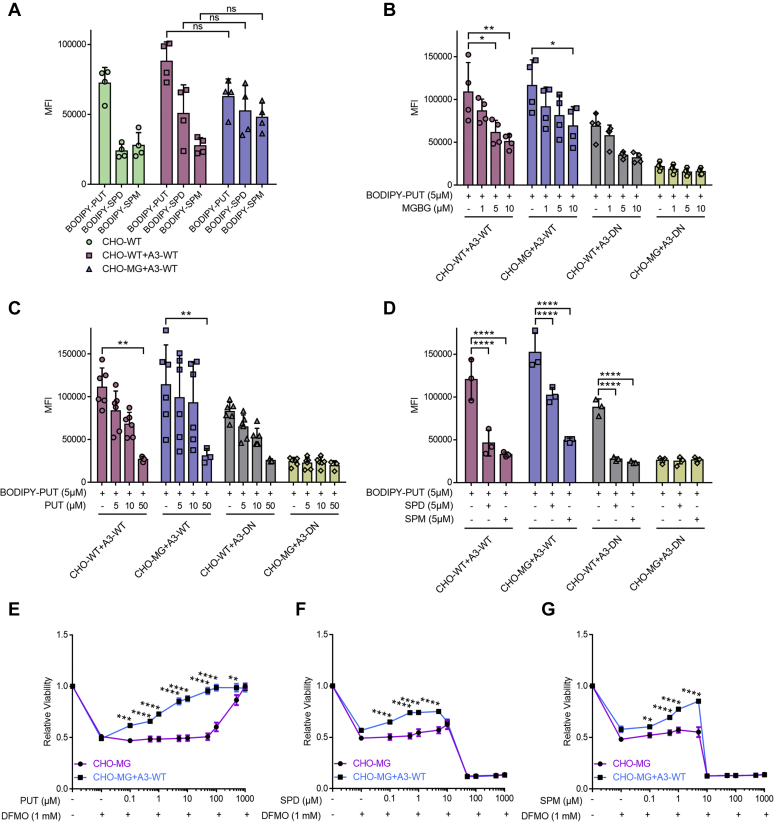
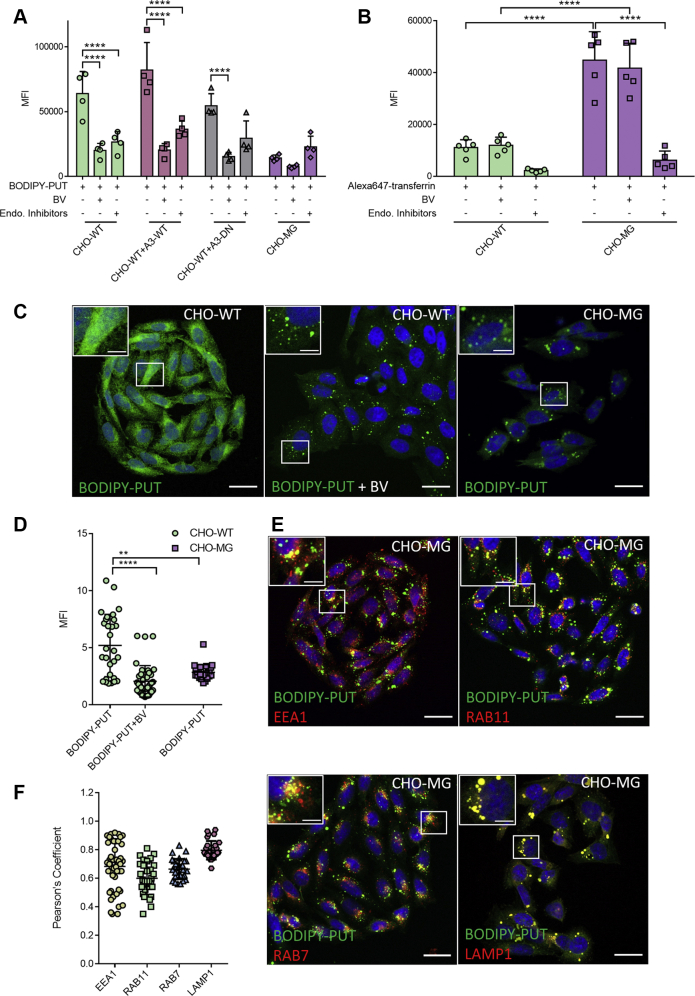
Polyamines, such as putrescine, spermidine, and spermine, are physiologically important polycations, but the transporters responsible for their uptake in mammalian cells remain poorly characterized. Here, we reveal a new component of the mammalian polyamine transport system using CHO-MG cells, a widely used model to study alternative polyamine uptake routes and characterize polyamine transport inhibitors for therapy. CHO-MG cells present polyamine uptake deficiency and resistance to a toxic polyamine biosynthesis inhibitor methylglyoxal bis-(guanylhydrazone) (MGBG), but the molecular defects responsible for these cellular characteristics remain unknown. By genome sequencing of CHO-MG cells, we identified mutations in an unexplored gene, ATP13A3, and found disturbed mRNA and protein expression. ATP13A3 encodes for an orphan P5B-ATPase (ATP13A3), a P-type transport ATPase that represents a candidate polyamine transporter. Interestingly, ATP13A3 complemented the putrescine transport deficiency and MGBG resistance of CHO-MG cells, whereas its knockdown in WT cells induced a CHO-MG phenotype demonstrated as a decrease in putrescine uptake and MGBG sensitivity. Taken together, our findings identify ATP13A3, which has been previously genetically linked with pulmonary arterial hypertension, as a major component of the mammalian polyamine transport system that confers sensitivity to MGBG.

Keywords: ATP13A3; P-type ATPase; P5B-ATPase; polyamine; polyamine transport system; putrescine; transporter.


Conflict of interest statement

Conflict of interest The authors declare that they have no conflicts of interest with the contents of this article.

Figures

Figure 1
Figure 1
CHO-MG cells exhibit MGBG resistance and impaired BODIPY–PUT uptake.A and C, cells were treated for 24 h with the indicated concentrations of MGBG alone (A), or PUT with or without 50-μM MGBG (C). CellTiter 96 AQueous One Solution Cell Proliferation Assay (MTS) was used to assess cell viability and dose–response curves were plotted (n = 3). B, cells were treated with 5-μM BODIPY–polyamines for 90 min at 37 °C with or without 90 min of 1-mM BV pretreatment to inhibit polyamine uptake. Uptake was measured in terms of the mean fluorescence intensity (MFI) up to 1 × 104 events (debris free) per condition on the flow cytometer (n = 3). Data represent the mean ± SEM (A and C) or mean ± SD (B), and individual data points (representing replicates) are overlaid on bar graph plots (p < 0.05, ∗∗∗∗/€€€€p < 0.0001, ∗∗∗∗versus CHO-WT(+MGBG), €€€€versus CHO-MG(+MGBG)). Analyses were performed using two-way ANOVA and Bonferroni post hoc corrections. BODIPY, boron dipyrromethene; BV, benzyl viologen; MGBG, methylglyoxal bis-(guanyl hydrazone); SPD, spermidine; SPM, spermine; PUT, putrescine.
Figure 2
Figure 2
ATP13A3 is downregulated in CHO-MG cells.A, ATP13A1-3 mRNA levels were measured with quantitative RT-PCR using SYBR Green master mix (n = 4). B, protein expression of ATP13A3 was checked via proteomic analysis (n = 4). C, ATP13A3 topology model with the identified mutations in CHO-MG cells. Data represent the mean ± SD (A and B) and individual data points (representing replicates) are overlaid on bar graph plots (∗∗p < 0.01, ∗∗∗∗p < 0.0001). Analyses were performed using one-way ANOVA and Bonferroni post hoc corrections (A) and unpaired t-test (B). A1-A3, ATP13A1-3; FKBPA1, FKBP prolyl isomerase 1A.
Figure 3
Figure 3
Expression of WT ATP13A3 restores the CHO-MG phenotype.A, stable cell lines were generated by lentiviral transduction to overexpress WT (A3-WT) or a catalytically dead mutant (A3-DN) of ATP13A3. Expression of the viral vectors was verified by immunoblotting using an ATP13A3 selective antibody, while the loading was monitored by a selective antibody of the house-keeping protein, GAPDH. B, cells were treated with 5-μM BODIPY–polyamines for 90 min at 37 °C with or without 90 min of 1-mM BV before treatment to inhibit polyamine uptake. Uptake was measured in terms of the mean fluorescence intensity (MFI) up to 1 × 104 events (debris free) per condition on the flow cytometer (n = 5–9). C, cells were treated for 24 h with different doses of MGBG. Cell viability was assessed using CellTiter 96 AQueous One Solution Cell Proliferation Assay (MTS), and dose–response curves were plotted (n = 3). Data represent the mean ± SD (B) and individual data points (representing replicates) are overlaid on bar graph plots, or the mean ± SEM (C) (/€€€€p < 0.0001, ns = not significant, versus CHO-WT + A3-WT, €€€€versus CHO-MG and CHO-MG + A3-DN). Analyses were performed using two-way ANOVA and Bonferroni post hoc corrections. A3-DN, overexpression of ATP13A3 catalytically dead mutant D498N; A3-WT, overexpression of WT ATP13A3; BODIPY, boron dipyrromethene; BV, benzyl viologen; MGBG, methylglyoxal bis-(guanyl hydrazone); PUT, putrescine.
Figure 4
Figure 4
Depletion of ATP13A3 in CHO-WT cells causes a CHO-MG phenotype.A, stable cell lines were generated by lentiviral transduction to knock down ATP13A3 in CHO-WT cells. Efficiency of the knockdown was verified at the mRNA level with quantitative PCR (n = 3). B, cells were treated with 5-μM BODIPY–polyamines for 90 min at 37 °C with or without 90 min of 1-mM BV before treatment to inhibit polyamine uptake. Uptake was measured in terms of the mean fluorescence intensity (MFI) up to 1 × 104 events (debris free) per condition on the flow cytometer (n = 3). C, cells were treated for 24 h with different doses of MGBG. Cell viability was assessed using CellTiter 96 AQueous One Solution Cell Proliferation Assay (MTS), and dose–response curves were plotted (n = 3). Data represent the mean ± SD (A and B) and individual data points (representing replicates) are overlaid on bar graph plots, or the mean ± SEM (C) (p < 0.05, p < 0.01, ∗∗∗∗/€€€€p < 0.0001, ∗∗∗∗versus CHO-WT + A3-KD1, €€€€versus CHO-WT + A3-KD2). Analyses were performed using two-way ANOVA and Bonferroni post hoc corrections. A3, ATP13A3; A3-KD, knockdown of ATP13A3; BODIPY, boron dipyrromethene; BV, benzyl viologen; FKBPA1, FKBP prolyl isomerase 1A; MGBG, methylglyoxal bis-(guanyl hydrazone); miR-fluc, expression of microRNA against firefly luciferase; PUT, putrescine.
Figure 5
Figure 5
ATP13A3-dependent transport exhibits a broad specificity toward PUT, SPD, and SPM.AD, cells were treated with only 5-μM BODIPY–PUT, BODIPY–SPD, or BODIPY–SPM (n = 4) (A), or with 5-μM BODIPY–PUT combined with different concentrations (1 μM, 5 μM, 10 μM, or 50 μM) of MGBG (n = 4) (B), nonfluorescent PUT (n = 3–6) (C) or nonfluorescent SPD/SPM (n = 3) (D) for 90 min at 37 °C. Uptake was measured in terms of the mean fluorescence intensity (MFI) up to 1 × 104 events (debris free) per condition on the flow cytometer. EG, cells were treated for 72 h with the indicated concentrations of PUT (E), SPD (F), and SPM (G) combined with 1-mM DFMO. CellTiter 96 AQueous One Solution Cell Proliferation Assay (MTS) was used to assess cell viability, and dose–response curves were plotted (n = 3). Data represent the mean ± SD (AD), and individual data points (representing replicates) are overlaid on bar graph plots, or the mean ± SEM (E-G) (p < 0.05, p < 0.01, p < 0.001, p < 0.0001, ns = not significant). Analyses were performed using two-way ANOVA and Bonferroni post hoc corrections. A3-DN, overexpression of ATP13A3 catalytically dead mutant D498N; A3-WT, overexpression of WT ATP13A3; BODIPY, boron dipyrromethene; BV, benzyl viologen; DFMO, difluoromethylornithine; MGBG, methylglyoxal bis-(guanyl hydrazone); PUT, putrescine; SPD, spermidine; SPM, spermine.
Figure 6
Figure 6
BODIPY–PUT is taken up via endocytosis.A, cells were treated with 5-μM BODIPY–PUT for 90 min at 37 °C with or without 30 min pretreatment of 1-mM BV or endocytosis inhibitors (100-μM Dynasore, 50-μM genistein, and 50-μM Pitstop-2). Uptake was measured in terms of the mean fluorescence intensity (MFI) up to 1 × 104 events (debris free) per condition on the flow cytometer (n = 3–4). B, cells were treated with BV or endocytosis inhibitors, while being starved for 30 min. Afterward, they were incubated at 4 °C for 15 min, treated with 50 μg/ml Alexa647-transferrin for 20 min, and incubated at 37 °C, 5% CO2 for 15 min. Uptake was measured in terms of the mean fluorescence intensity (MFI) up to 1 × 104 events (debris-free) per condition on the flow cytometer (n = 5). C and E, cells were treated with BODIPY–PUT for 90 min at 37 °C with or without 30 min pretreatment of 1-mM BV and incubated with primary antibodies for EEA1, RAB11, RAB7, and LAMP1 (1:200) followed by staining with Alexa Fluor 594 goat anti-rabbit antibody (1:1000) for 60 min and the nuclear stain DAPI (200 ng/ml) for 15 min (n=3–5). Confocal microscopy images (scale bar = 20 μm; boxed areas are enlarged in the inset with scale bar = 5 μm) of BODIPY–PUT in CHO-WT ± BV and CHO-MG (C), and BODIPY–PUT colocalization with endosomal markers in CHO-MG (E) are shown. D, BODIPY–PUT, represented in panel C, was quantified by measuring the mean fluorescence intensities (MFI) of BODIPY normalized to that of DAPI (CHO-WT + BODIPY–PUT = 29 images; CHO-WT BODIPY–PUT + BV = 39 images; CHO-MG BODIPY–PUT = 25 images). F, colocalization of BODIPY–PUT with endosomal markers, demonstrated in panel E, was analyzed in terms of Pearson’s coefficient of BODIPY–PUT with EEA1 (49 images), RAB11 (30 images), RAB7 (29 images), and LAMP1 (30 images). Data represent the mean ± SD, and individual data points (representing replicates) are overlaid on bar graph plots (∗∗p < 0.01, ∗∗∗p < 0.0001), generated with two-way ANOVA and Bonferroni post hoc corrections. A3-DN, overexpression of ATP13A3 catalytically dead mutant D498N; A3-WT, overexpression of WT ATP13A3; BODIPY, boron dipyrromethene; BV, benzyl viologen; EEA1, early endosomal antigen 1; LAMP1, lysosomal-associated membrane protein 1; PUT, putrescine; RAB7/11, ras-associated binding protein 7/11.
None
None
None
None
None
None

References

    1. Pegg A.E. Functions of polyamines in mammals. J. Biol. Chem. 2016;291:14904–14912. - PMC - PubMed
    1. Pegg A.E. Mammalian polyamine metabolism and function. IUBMB Life. 2009;61:880–894. - PMC - PubMed
    1. Eisenberg T., Abdellatif M., Schroeder S., Primessnig U., Stekovic S., Pendl T., Harger A., Schipke J., Zimmermann A., Schmidt A., Tong M., Ruckenstuhl C., Dammbrueck C., Gross A.S., Herbst V. Cardioprotection and lifespan extension by the natural polyamine spermidine. Nat. Med. 2016;22:1428–1438. - PMC - PubMed
    1. Eisenberg T., Knauer H., Schauer A., Büttner S., Ruckenstuhl C., Carmona-Gutierrez D., Ring J., Schroeder S., Magnes C., Antonacci L., Fussi H., Deszcz L., Hartl R., Schraml E., Criollo A. Induction of autophagy by spermidine promotes longevity. Nat. Cell Biol. 2009;11:1305–1314. - PubMed
    1. Pegg A.E. Toxicity of polyamines and their metabolic products. Chem. Res. Toxicol. 2013;26:1782–1800. - PubMed

Publication types