. 2021 Feb 17;41(7):1505-1515.
doi: 10.1523/JNEUROSCI.1397-20.2020. Epub 2020 Dec 11.

Memory Load Alters Perception-Related Neural Oscillations during Multisensory Integration

Affiliations

Memory Load Alters Perception-Related Neural Oscillations during Multisensory Integration

Georgios Michail et al. J Neurosci. .

Abstract

Integrating information across different senses is a central feature of human perception. Previous research suggests that multisensory integration is shaped by a context-dependent and largely adaptive interplay between stimulus-driven bottom-up and top-down endogenous influences. One critical question concerns the extent to which this interplay is sensitive to the amount of available cognitive resources. In the present study, we investigated the influence of limited cognitive resources on audiovisual integration by measuring high-density electroencephalography (EEG) in healthy participants performing the sound-induced flash illusion (SIFI) and a verbal n-back task (0-back, low load and 2-back, high load) in a dual-task design. In the SIFI, the integration of a flash with two rapid beeps can induce the illusory perception of two flashes. We found that high compared with low load increased illusion susceptibility and modulated neural oscillations underlying illusion-related crossmodal interactions. Illusion perception under high load was associated with reduced early β power (18-26 Hz, ∼70 ms) in auditory and motor areas, presumably reflecting an early mismatch signal and subsequent top-down influences including increased frontal θ power (7-9 Hz, ∼120 ms) in mid-anterior cingulate cortex (ACC) and a later β power suppression (13-22 Hz, ∼350 ms) in prefrontal and auditory cortex. Our study demonstrates that integrative crossmodal interactions underlying the SIFI are sensitive to the amount of available cognitive resources and that multisensory integration engages top-down θ and β oscillations when cognitive resources are scarce.SIGNIFICANCE STATEMENT The integration of information across multiple senses, a remarkable ability of our perceptual system, is influenced by multiple context-related factors, the role of which is highly debated. It is, for instance, poorly understood how available cognitive resources influence crossmodal interactions during multisensory integration. We addressed this question using the sound-induced flash illusion (SIFI), a phenomenon in which the integration of two rapid beeps together with a flash induces the illusion of a second flash. Replicating our previous work, we demonstrate that depletion of cognitive resources through a working memory (WM) task increases the perception of the illusion. With respect to the underlying neural processes, we show that when available resources are limited, multisensory integration engages top-down θ and β oscillations.

Keywords: multisensory integration; sound-induced flash illusion; top-down; working memory; β oscillations; θ oscillations.


Figures

Figure 1.
Figure 1.
Illustration of the dual-task paradigm. A, In the first part of each trial (n-back task) participants had to indicate whether the letter is a target ('X' in the 0-back condition and same letter as the one presented two trials before in the 2-back condition). In the second part of each trial, an audiovisual stimulus of the SIFI task was presented, and participants reported the number of flashes they perceived. B, Overview of structure and timing of a single trial. In this example, the presentation of an n-back letter was followed by the A2V1 SIFI stimuli. In the critical A2V1 trials, participants typically perceive one flash (no illusion) or two flashes (illusion).
Figure 2.
Figure 2.
Behavioral results of the n-back task and the critical A2V1 trials of the SIFI task. A, Participants showed higher sensitivity d′ (left panel) and shorter RTs (right panel) in 0-back compared with 2-back trials. B, SIFI illusion rates were higher in the 2-back compared with the 0-back condition (left panel), whereas RTs did not significantly differ between conditions (right panel). Horizontal lines denote the mean and vertical the SEM. C, Correlation between load-dependent (2-back minus 0-back) changes in SIFI illusion rates and the corresponding changes in n-back d′ values (left panel) and n-back RTs (right panel). Increased SIFI illusion perception correlated with decreased d′ values in the n-back task (i.e., worse n-back accuracy). Black lines represent the best-fitting linear regression and shaded areas the 95% confidence interval; *p < 0.05, ***p < 0.001.
Figure 3.
Figure 3.
WM load-dependent modulation of power before the SIFI task. The cluster analysis revealed two clusters of power difference between 2-back and 0-back conditions. A, Frontal θ (4–7 Hz) power, localized in PFC and ACC, was significantly stronger in the 2-back compared with the 0-back condition. This effect was not related to performance changes in the n-back task. B, Fronto-central β (20–35 Hz) power, localized in bilateral motor and medial cingulate cortex, was lower in 2-back compared with the 0-back condition. β power decrease was related to load-dependent (2-back minus 0-back) RT slowing in the n-back task. Left panels, TFRs of load-dependent power difference (in t values), averaged across channels with the highest contribution to the cluster and masked based on the temporal and spectral extent of the cluster. Higher values indicate stronger power for the 2-back compared with the 0-back condition. The color scale refers only to unmasked t values. The topographic maps show the spatial distribution of the difference in the cluster's time-frequency window. Channels with high contribution to the cluster (i.e., with a total number of significant time-frequency samples at or above the mean) are highlighted with dots. Middle panels, Time course of the correlation between the load-dependent power difference in the cluster and the corresponding changes in n-back performance parameters, sensitivity Δ d′ (pink) and Δ RT (green). Horizontal lines at the bottom indicate correlation time clusters with p < 0.1 and bold letters p < 0.025. Right panels, Source contrast (in t values) between 2-back and 0-back for the clusters obtained from the scalp level analysis.
Figure 4.
Figure 4.
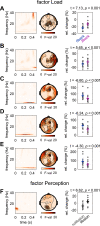
Main effect of WM load and perception on poststimulus power. The main effect of Load (low, high) was represented in five clusters of oscillatory power (A–E), and the main effect of Perception (no illusion, illusion) in one cluster (F). Left panel, TFR of each cluster (in F values), averaged over channels contributing to the cluster. Middle panel, Topographic map showing the spatial distribution and the contributing channels (dots). Right panel, Post hoc comparisons of the average power of the cluster between the two conditions. Horizontal lines denote the mean and vertical the SEM.
Figure 5.
Figure 5.
Interaction between WM load and perception in the SIFI. Three clusters of interactions between Load (low, high) and Perception (no illusion, illusion) were observed. A, The first interaction cluster was found in β power (18–26 Hz; 0–90 ms) over central-left channels. Source analysis identified a corresponding illusion-dependent activity difference in the left motor and auditory cortex. B, The second interaction was observed in frontal θ power (7–9 Hz; 30–200 ms). Source analysis identified higher illusion-dependent θ activity in 2-back compared with 0-back, in MCC and ACC. C, The third interaction was found in frontal β power (13–22 Hz; 250–380 ms). Source analysis revealed significant differences between 2-back and 0-back conditions in the right PFC, ACC, and bilateral temporal areas. Left panels, TFRs of significant interactions (in F values), averaged across channels contributing to that particular cluster and masked based on the temporal and spectral extent of the cluster, as well as a topography plot showing the spatial distribution and the contributing channels (dots). The color scale refers only to unmasked F values. Middle panels, Post hoc paired-samples t tests comparing the average power change of the cluster between the four conditions. Horizontal lines denote the mean and vertical the SEM. Right panels, Source contrast (in t values) for power modulation differences associated with illusion perception (Δillusion-noillusion) between 2-back and 0-back, in the cluster's time-frequency window; *p < 0.05, **p < 0.01.

References

    1. Alsius A, Navarra J, Campbell R, Soto-Faraco S (2005) Audiovisual integration of speech falters under high attention demands. Curr Biol 15:839–843. 10.1016/j.cub.2005.03.046 - DOI - PubMed
    1. Alsius A, Navarra J, Soto-Faraco S (2007) Attention to touch weakens audiovisual speech integration. Exp Brain Res 183:399–404. 10.1007/s00221-007-1110-1 - DOI - PubMed
    1. Arnal LH, Giraud AL (2012) Cortical oscillations and sensory predictions. Trends Cogn Sci 16:390–398. 10.1016/j.tics.2012.05.003 - DOI - PubMed
    1. Arnal LH, Wyart V, Giraud AL (2011) Transitions in neural oscillations reflect prediction errors generated in audiovisual speech. Nat Neurosci 14:797–801. 10.1038/nn.2810 - DOI - PubMed
    1. Balz J, Keil J, Roa Romero Y, Mekle R, Schubert F, Aydin S, Ittermann B, Gallinat J, Senkowski D (2016a) GABA concentration in superior temporal sulcus predicts gamma power and perception in the sound-induced flash illusion. Neuroimage 125:724–730. 10.1016/j.neuroimage.2015.10.087 - DOI - PubMed

Publication types

MeSH terms