. 2020 Dec 11;4(2):e202000794.
doi: 10.26508/lsa.202000794. Print 2021 Feb.

Requirement of DNMT1 to orchestrate epigenomic reprogramming for NPM-ALK-driven lymphomagenesis

Affiliations

Requirement of DNMT1 to orchestrate epigenomic reprogramming for NPM-ALK-driven lymphomagenesis

Elisa Redl et al. Life Sci Alliance. .

Abstract

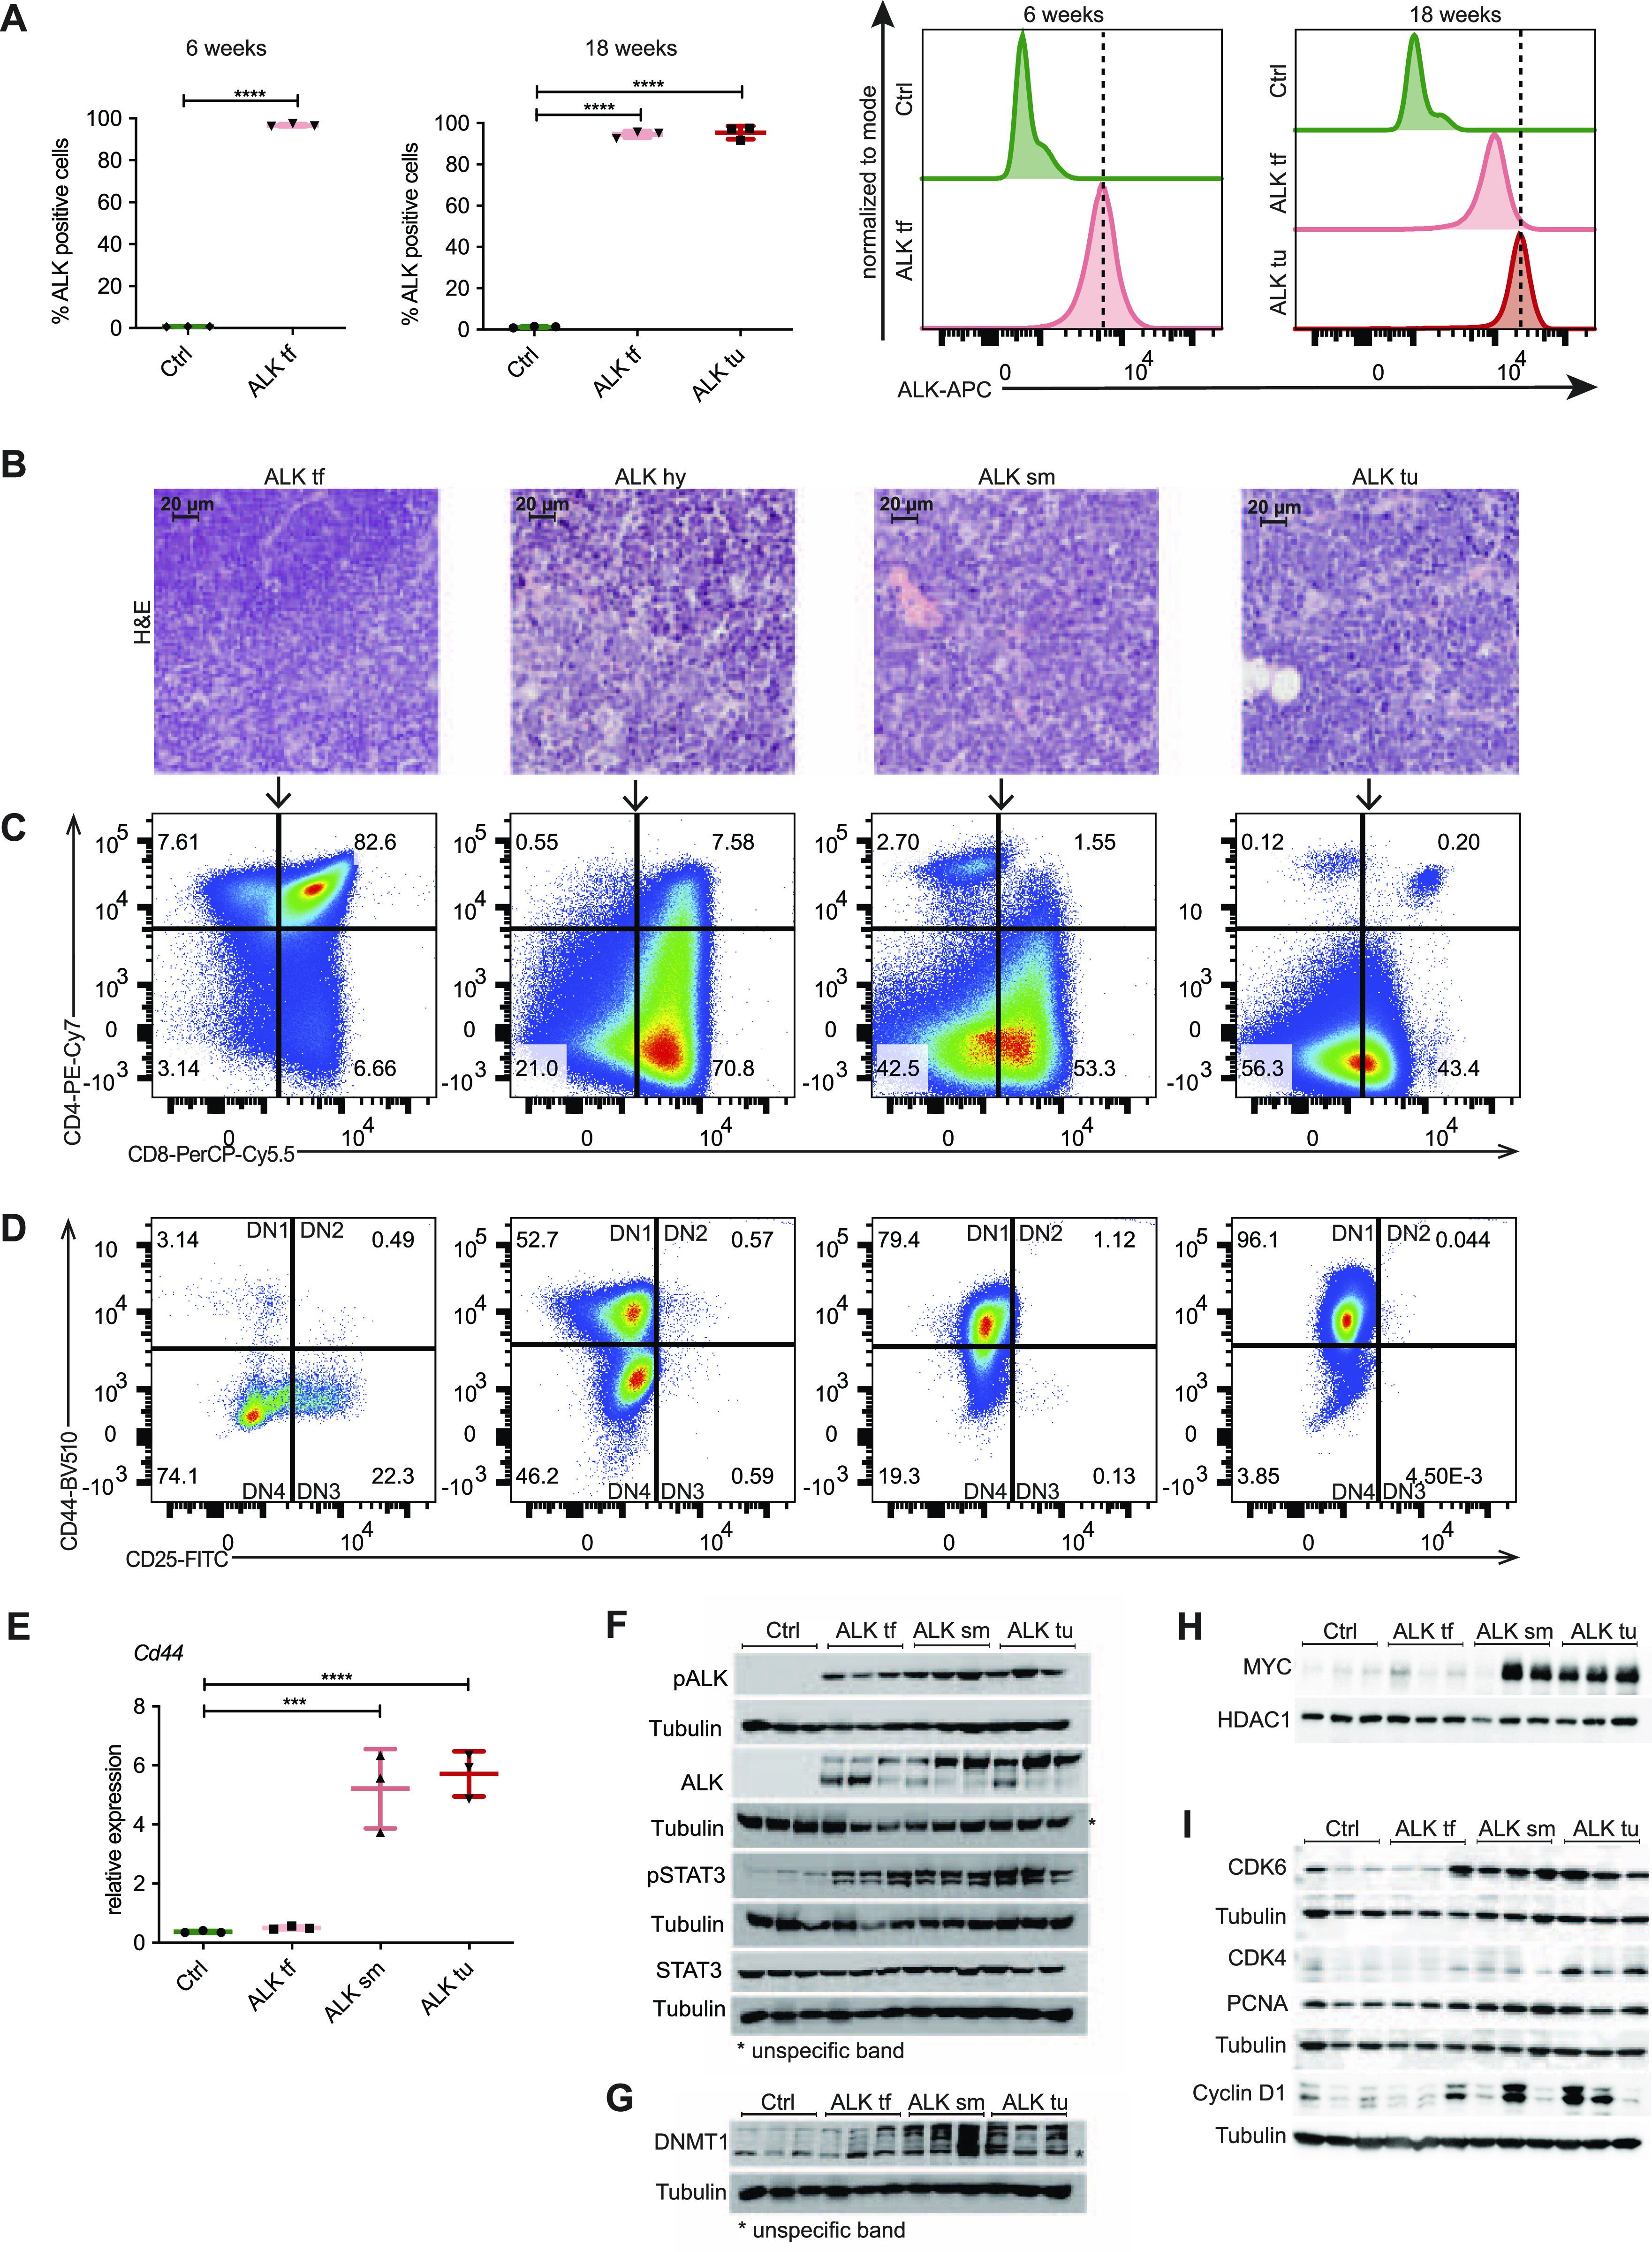
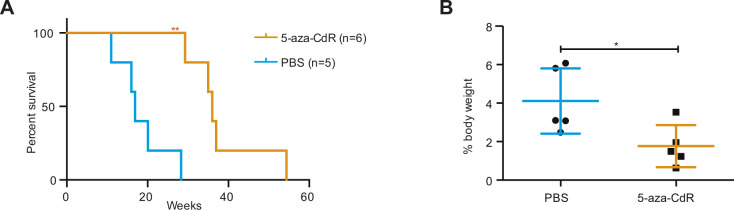
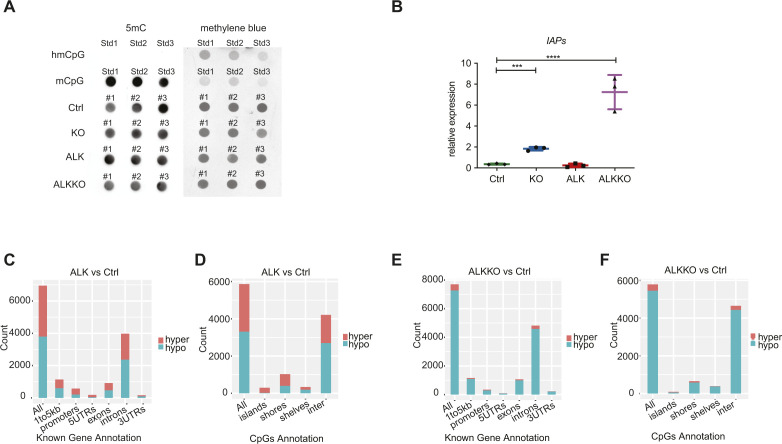
Malignant transformation depends on genetic and epigenetic events that result in a burst of deregulated gene expression and chromatin changes. To dissect the sequence of events in this process, we used a T-cell-specific lymphoma model based on the human oncogenic nucleophosmin-anaplastic lymphoma kinase (NPM-ALK) translocation. We find that transformation of T cells shifts thymic cell populations to an undifferentiated immunophenotype, which occurs only after a period of latency, accompanied by induction of the MYC-NOTCH1 axis and deregulation of key epigenetic enzymes. We discover aberrant DNA methylation patterns, overlapping with regulatory regions, plus a high degree of epigenetic heterogeneity between individual tumors. In addition, ALK-positive tumors show a loss of associated methylation patterns of neighboring CpG sites. Notably, deletion of the maintenance DNA methyltransferase DNMT1 completely abrogates lymphomagenesis in this model, despite oncogenic signaling through NPM-ALK, suggesting that faithful maintenance of tumor-specific methylation through DNMT1 is essential for sustained proliferation and tumorigenesis.


Conflict of interest statement

The authors declare that they have no conflict of interest.

Figures

Figure 1.
Figure 1.. Deregulated gene expression in nucleophosmin-anaplastic lymphoma kinase (NPM-ALK) tumors.
(A) Volcano plot displaying the differences in gene expression determined by RNA-seq between ALK tumor cells and wild-type (Ctrl) thymocytes, where red dots indicate significantly up- and down-regulated genes (permutation test followed by BH correction, FDR < 0.05, absolute log2(FC) higher than one) and grey dots show non-significantly altered genes (not meeting the criteria mentioned above) between these two groups. (B) Gene set enrichment analysis performed on the significantly up- and down-regulated genes filtered by FDR < 0.05 and absolute log2(FC) > 1 between ALK tumors and Ctrl thymocytes using oncogenic signature gene sets from MSigDB. Pathways associated with down-regulated genes are shown in blue and pathways associated with up-regulated genes are displayed in red ranked by normalized enrichment score. (C) Gene set enrichment analysis enrichment of MYC pathway-related genes among significantly deregulated genes filtered by FDR < 0.05 and absolute log2(FC) > 1 between ALK and Ctrl samples. The x-axis shows the differentially expressed genes belonging to the MYC pathway and the y-axis shows positive/negative enrichment scores for up-/down-regulated genes associated with the MYC pathway. (D) Analysis of MYC pathway related genes including Myc, Notch1, Cdk4, and Cdk6 in Ctrl and ALK tumor samples using qRT-PCR. Analysis was performed in technical and biological triplicates. Data are represented as mean ± SD, *P < 0.05, **P < 0.01, using unpaired t test. FC, fold change.
Figure 2.
Figure 2.. Immunophenotype of ALK tumors.
(A) Intracellular FACS analysis of ALK expression in thymocytes isolated from 6- to 18-wk-old wild-type (Ctrl), nucleophosmin-anaplastic lymphoma kinase (NPM-ALK) tumor-free (ALK tf) mice compared with ALK+ tumor cells (ALK tu). Quantification of the percentage of ALK+ cells in the three groups (left). Histograms (right) depict ALK expression levels compared with Ctrls. Dotted vertical lines indicate the peaks of ALK expression in ALK+ thymocytes of 6-wk-old ALK mice or ALK+ tumor cells at 18 wk of age. Data are represented as mean ± SD, ****P < 0.0001, one-way ANOVA, followed by unpaired t test, n = 3. (B) Hematoxylin and eosin (HE) stainings of representative thymi of 18-wk old NPM-ALK transgenic mice illustrating different stages of ALK tumors including a tumor-free thymus ALK tf; hyperplastic thymus, ALK hy; small tumor, ALK sm; end-stage tumor, ALK tu. (B, C) Representative FACS analysis of ALK+ cells isolated from 18-wk old tumor-free mice compared with different tumor stages (as in B) gated for CD4 and CD8 expression. (B, D) FACS analysis showing the expression of CD44 and CD25 to determine the different double negative (DN) stages of T-cell development (DN1-DN4) in ALK+ cells isolated from 18-wk-old tumor-free mice and different stages of ALK tumor developing mice (as in B). (E) qRT-PCR of Cd44 expression in thymi of 18-wk old Ctrl and NPM-ALK tumor-free (ALK tf) transgenic mice as well as early developing tumors (ALK sm) and end-stage tumors (ALK tu) normalized to Gapdh expression. Analyses were performed in biological triplicates. Data are represented as mean ± SD, ***P < 0.001, ****P < 0.0001, using one-way ANOVA, followed by unpaired t test. (F) pALK, ALK, pSTAT3, and STAT3 protein levels in biological triplicates of thymi of 18-wk old Ctrl and NPM-ALK tumor-free mice as well as early and end-stage tumors were analyzed by Western blot analysis. Tubulin served as loading control. Asterisks indicate unspecific protein bands. (F, G) DNMT1 protein levels in biological triplicates of thymi of 18-wk-old Ctrl and tumor-free NPM-ALK transgenic mice as well as early and end-stage tumors (as in F) were analyzed by Western blot analysis. Tubulin served as loading control. Asterisks indicate unspecific protein bands. (H) Nuclear extracts were isolated from thymi of 18-wk-old Ctrl and NPM-ALK tumor-free mice and early and end-stage tumors in biological triplicates. Protein levels of MYC were detected by Western blot analysis. The nuclear protein HDAC1 served as loading control. (I) Protein levels of the cell cycle associated genes CDK4, CDK6, PCNA, and cyclin D1 in biological triplicates of thymi of 18-wk-old Ctrl and NPM-ALK tumor-free mice as well as early and end-stage tumors were examined using Western blot analysis. Tubulin served as loading control.
Figure S1.
Figure S1.. Immunophenotyping of ALK+ thymocytes and tumor cells.
(A) FACS analysis showing CD4 and CD8 expression of thymocytes in 18-wk-old wild-type controls (Ctrl) versus ALK+ tumor-free (ALK tf) thymocytes and tumor cells (ALK tu) (gated for ALK expression) and their quantification of three biological replicates. Data are shown as mean ± SD, **P < 0.01, ****P < 0.0001 using two-way ANOVA. (A, B) FACS analysis showing TCRβ and ALK expression of samples as in (A), and their quantification of three biological replicates. Data are represented as mean ± SD, **P < 0.01 using one-way ANOVA, n = 3.
Figure S2.
Figure S2.. Immunophenotyping of peripheral ALK+ cells.
(A) Percentage of ALK positive cells analyzed by nuclear FACS of splenocytes of 18-wk old Ctrl, ALK tf and ALK tu samples. Representative histograms (right) show expression levels of ALK in the three groups. Data are represented as mean ± SD, ***P < 0.001, ****P < 0.0001 using one-way ANOVA, n = 3. (B) FACS analysis for ALK and TCRβ (left panel) as well as CD4 and CD8 expression (middle panel) of splenocytes isolated from 18-wk-old tumor free mice (ALK tf) (upper panels) or ALK tumor mice (ALK tu) (lower panels) and the quantification of three biological replicates (right panel).
Figure S3.
Figure S3.. Different ALK tumor stages.
(A) Thymus or tumor to body weight ratios in percent of Ctrl and tumor-free ALK (ALK tf) mice and of ALK tumor mice with small tumors (ALK sm) or end-term tumors (ALK tu). Graphs show mean ± SD, *P < 0.05, **P < 0.01 using one-way ANOVA, followed by pair-wise comparison to Ctrl. (A, B) Representative immunohistochemical ALK staining of Ctrl and ALK tumor stages as in (A).
Figure 3.
Figure 3.. Deletion of Dnmt1 abrogates lymphomagenesis in nucleophosmin-anaplastic lymphoma kinase (NPM-ALK) transgenic mice.
(A) Generation of mice with T cell-specific Cd4-NPM-ALK expression (ALK) and T cell-specific deletion of Dnmt1 (KO) or both (ALKKO). Cd4 enh./prom., Cd4 enhancer and promoter. Cd4 enh./prom./sil., Cd4 enhancer, promoter and silencer. (B) Kaplan-Meier survival statistics depicting overall survival of Cd4-NPM-ALK (ALK), Cd4-NPM-ALK Cd4-Cre Dnmt1flox/+ (ALKHET), Cd4-NPM-ALK Cd4-Cre Dnmt1flox/flox (ALKKO), and Dnmt1loxP/loxP control mice (Ctrl). ****P < 0.0001, Log-rank (Mantel–Cox) test, pairwise comparison to ALK. (C) Morphology of 18-wk-old Ctrl, KO and ALKKO thymi in comparison to ALK tumors. Pictures were taken immediately after organ collection. (D) Protein expression of NPM-ALK, DNMT1, and pSTAT3 was analyzed by immunohistochemistry staining in Ctrl, KO, ALKKO thymi, and in ALK tumors. Pictures are representatives of biological triplicates. Graphs below the images depict quantification of stainings using Definiens Tissue Studio 4.2 software. Data are represented as mean ± SD, ****P < 0.0001, using one-way ANOVA, followed by unpaired t test. (E) DNMT1, pALK, ALK, pSTAT3, and STAT3 protein levels in thymi of 18-wk-old Ctrl, KO, and ALKKO mice as well as ALK tumors were analyzed by Western blot analysis. Tubulin served as loading control. Analysis was performed in biological triplicates. Asterisks indicate unspecific band.
Figure S4.
Figure S4.. Immunophenotyping of KO and ALKKO mice.
(A) Percentage of ALK+ cells in 18-wk old ALKKO compared with Ctrl and KO thymi. Histograms (right) indicate ALK expression levels in ALKKO compared to Ctrl and KO cells. Data are represented as mean ± SD, ****P < 0.0001 using one-way ANOVA, followed by unpaired t test, n = 3. (B) FACS analysis showing representative CD4 and CD8 expression of thymocytes in 18-wk-old Ctrl, KO, and ALKKO mice and the quantification of three replicates. Data are shown as mean ± SD, two-way ANOVA. (C) FACS analysis showing TCRβ and ALK expression of thymocytes isolated from Ctrl, KO and ALKKO thymi. The graphs show quantifications of three biological replicates. Data are represented as mean ± SD, one-way ANOVA, no significant differences.
Figure S5.
Figure S5.. 5-Aza-CdR treatment of nucleophosmin-anaplastic lymphoma kinase (NPM-ALK) mice.
(A) Kaplan–Meier survival statistics depicting overall survival of NPM-ALK transgenic mice treated with 1 mg/kg 5-aza-CdR (orange) or PBS (light blue) **P < 0.01, log-rank (Mantel–Cox) test, pairwise comparison to PBS control mice. (B) Mouse and tumor weights from 5-aza-CdR and PBS control mice were determined and the % of body weight was calculated for tumors. Data are represented as mean ± SD, *P < 0.05 using unpaired t test.
Figure 4.
Figure 4.. Deletion of Dnmt1 results in reduced proliferation of ALK+ cells.
(A) Cell proliferation analysis by immunohistochemistry staining of Ctrl, KO, ALKKO thymi and ALK tumor tissues using Ki67 antibody. The graph shows quantification of Ki67 positive cells using Definiens Tissue Studio 4.2 software. Non-proliferative areas in the thymus were excluded from analysis. Data are shown as mean ± SD, ***P < 0.001, pair-wise comparison to control using unpaired t test, n = 4. (B) Double immunofluorescence staining of ALK tumors and ALKKO thymi. Tissues were stained with antibodies against ALK (red) and Ki67 (green) and counterstained with DAPI (blue). Pictures were acquired with identical pixel density, image resolution, and exposure time. The graph shows quantification of immunofluorescence staining by counting Ki67/ALK double-positive relative to total number of cells (DAPI positive) of two equally sized areas per tumor/thymus from four biological replicates, respectively. Cell counting was performed by two individuals and slides were blinded for counting. Data are shown as mean ± SD, ***P < 0.001, using unpaired t test.
Figure 5.
Figure 5.. High similarity in gene expression between ALKKO and Ctrl thymocytes.
(A) Hierarchical clustering heat map illustrating sample to sample Euclidian distances based on variance stabilizing transformations of RNA-seq gene expression values of all genes of individual Ctrl, KO, ALKKO thymi, and ALK tumor samples. (B) Heat map showing unsupervised clustering of the top 5% most variable genes among all samples in Ctrl, KO, ALK, and ALKKO using variance stabilizing data. (C) Volcano plot displaying the significant differences in gene expression between ALKKO compared with Ctrl thymocytes, where red dots indicate significant differentially expressed genes (FDR < 0.05, absolute log2(FC) > 1), and grey scale dots show nonsignificant differentially expressed genes, between these two groups. (D) Gene expression levels of Socs3, Trim66, and Gzma based on normalized counts from RNA-seq analysis of ALK tumor and ALKKO thymus samples compared with Ctrl and KO thymi. Data are represented as mean ± SD, *P < 0.05, **P < 0.01, ****P < 0.0001, using ordinary one-way ANOVA followed by multiple comparison using Fisher’s least significant difference (LSD) test.
Figure S6.
Figure S6.. Differential gene expression.
(A) Principal component analysis of RNA-seq data of Ctrl, KO, ALKKO thymi, and ALK tumors indicating the first two components with the largest part of variation in gene expression between the different genotypes. (B) Venn diagrams showing unique and shared differentially expressed genes in different genotypes that are significantly up-regulated (left) or down-regulated (right) (FDR < 0.05, absolute log2(FC) > 1) compared with ALK tumors (upper panels) or compared with Ctrl (lower panels) samples. (C) UpSet plot of intersections between deregulated genes of different pairwise comparisons. The bar chart on the left indicates the total number of deregulated genes between the pairwise comparisons of different genotypes. The upper bar chart indicates the number of intersected deregulated genes. The bar graph on the left depicts the number of deregulated genes per comparison. The red box highlights the number of genes commonly deregulated in ALK as well as ALKKO relative to Ctrl. (D) Gene expression levels of Myc, Cdk4, Cdk6, and Ccnd1 based on RNA-seq analysis of ALK tumor and ALKKO thymus samples compared with Ctrl and KO thymi.
Figure 6.
Figure 6.. Deconvolution of RNA-seq data.
(A) Proportions of cell types in the sc-RNA-seq data in postnatal thymus harvested at 4, 8, and 24 wk of age compared with the proportions calculated for the deconvolution using the bulk data (Ctrl sample). DN, double-negative T cells; DP, double-positive T cells; P, proliferating; Q, quiescent. (B) Estimation of the cell type proportions in each sample in the bulk data. KO2 appears to be an outlier in this analysis. (C) Correlation between each replica in the bulk data and the single cell data of different time points using the marker genes selected in the deconvolution. E, embryonic day; P0, birth; W, weeks after birth. (D) Log2(FC) values of the real versus simulated samples for the 175 marker genes selected in the deconvolution.
Figure 7.
Figure 7.. DNA methylation changes in ALK tumors and Dnmt1 knockout thymi.
(A) Quantification of global DNA methylation levels by dot blot analysis using 5mC immunodetection. 5mC signal intensities were normalized to total DNA input based on methylene blue staining. Data are represented as mean ± SD, *P < 0.05, using one-way ANOVA, followed by unpaired t test, n = 3. (B) Violin plots indicating the bimodal distribution of methylation levels determined by reduced representation bisulfite sequencing in three biological replicates of Ctrl, KO and ALKKO thymi as well as ALK tumors. Shown are percent methylation per CpG (%mCpG). Black dots indicate the median percentage of mCpG in each sample. (C) Correlation heat map between individual Ctrl, KO, ALKKO and ALK samples based on DNA methylation levels of single CpGs based on correlation coefficients between samples. (D) DNA methylation heat map using unsupervised clustering of the top 1% most variable CpGs in Ctrl, KO, ALK and ALKKO samples. The color code represents mean methylation levels of individual CpG sites. (E) Significantly hyper- (red) and hypo- (blue) methylated CpGs resulting from comparison of KO, ALKKO, and ALK versus Ctrl samples identified by methylKit analysis (P < 0.01; b-value difference >25%). (F) Methylation changes of individual CpGs relative to Ctrl for all genotypes (as in E) shown as density plot. Numbers on the y-axis are log(10) CpG counts. (G) Network analysis based on Ingenuity Pathway Analysis of significantly hypomethylated promoter regions in ALK versus Ctrl samples. Significantly hypomethylated genes are depicted in green, upstream regulators are depicted in red. (H) Locus overlap analysis (LOLA) region set enrichment analysis for differentially methylated CpGs (binned into 1-kilobase tiling regions). The plot shows region sets from embryonic stem cells (green), T lymphocytes (blue) and thymus (purple) with P < 0.05. (I) Differentially methylated regions (DMRs) between ALK versus Ctrl samples were used to map histone modifications (H3K4me1 and H3K27ac) of ENCODE regions defined by ChIP-seq data of thymus samples using k-means clustering (k = 3). The heat map indicate overlap of individual DMRs expanded to 5 kb on both sites with H3K4me1 (left) and H3K27ac (right) in three distinct clusters, based on different signal intensity. Gene distance indicates predicted enhancers mapped within at a 5-kb window indicating start (S) and end (E) of the DMR region. Z-min/max shows the intensity of the H3K4me1 and H3K27ac ChIP-seq signals.
Figure S7.
Figure S7.. Changes in DNA methylation levels upon Dnmt1 knockout.
(A) Global DNA methylation analysis using dot blot and immunodetection with an antibody directed against 5mC (left) or methylene blue staining as DNA loading control of DNA isolated from Ctrl, KO, ALK and ALKKO thymi and tumors (right). Hydroxymethylated (hmCpG) and methylated (mCpG) oligos were used as antibody control. Analyses were performed in technical and biological triplicates. (B) qRT-PCR of IAP expression in Ctrl, KO, ALK tumor and ALKKO samples. Analyses were performed in biological triplicates (n = 3). Data are represented as mean ± SD, ***P < 0.001, ****P < 0.0001, one-way ANOVA, followed by unpaired t test. (C, D) Annotation of hyper- (red) and hypo- (turquois) methylated CpG sites related to known gene annotations and CpG island characteristics for ALK versus Ctrl samples. (E, F) Annotation of hyper- (red) and hypo- (turquois) methylated CpG sites related to known gene annotations and CpG island characteristics for ALKKO versus Ctrl samples.
Figure 8.
Figure 8.. Analysis of associated DNA methylation.
(A) Methylation difference of neighboring CpGs relative to Ctrls in KO, ALK, and ALKKO samples as analyzed based on the distance between CpGs. (B) CpG triplet analysis of neighboring CpGs within a maximal distance of 20 bp. Each square represents three neighboring CpGs. The color of the squares indicates the methylation level of the middle CpG from unmethylated (blue) to fully methylated (red). The x and y axes represent the methylation levels of the two neighboring CpGs annotated as (n) and (p). Squares close to the diagonal indicate highly correlated CpG triplets, whereas dispersed squares represent non-correlated triplets. (C) qRT-PCR of Dnmt1, Dnmt3b, and Tet1 expression in Ctrl, KO and ALKKO thymocytes as well as ALK tumor cells normalized to Gapdh expression. Analyses were performed in biological triplicates. Data are represented as mean ± SD, *P < 0.05, **P < 0.01, pairwise comparison to the Ctrl unpaired t test.
Figure S8.
Figure S8.. Gating strategy for FACS analysis of thymocytes and tumor cells.
(A) Representative gating strategy for the analysis of ALK negative thymocytes from Ctrl and KO mice. Cells were first gated for single cells before specific surface marker expression patterns were analyzed. (B) Representative gating strategy for the analysis of ALK positive thymocytes and tumor cells from ALK and ALKKO mice. Ctrl samples were used as negative control for definition of ALK expressing cells. Expression of specific surface markers (CD4, CD8, CD25, CD44) was analyzed in ALK positive cells.

References

    1. Jones PA, Baylin SB (2002) The fundamental role of epigenetic events in cancer. Nat Rev Genet 3: 415–428. 10.1038/nrg816 - DOI - PubMed
    1. Ehrlich M, Lacey M (2013) DNA methylation and differentiation: Silencing, upregulation and modulation of gene expression. Epigenomics 5: 553–568. 10.2217/epi.13.43 - DOI - PMC - PubMed
    1. Zhang Q, Wang HY, Woetmann A, Raghunath PN, Odum N, Wasik MA (2006) STAT3 induces transcription of the DNA methyltransferase 1 gene (DNMT1) in malignant T lymphocytes. Blood 108: 1058–1064. 10.1182/blood-2005-08-007377 - DOI - PMC - PubMed
    1. Zhang Q, Wang HY, Liu X, Bhutani G, Kantekure K, Wasik M (2011) IL-2R common gamma-chain is epigenetically silenced by nucleophosphin-anaplastic lymphoma kinase (NPM-ALK) and acts as a tumor suppressor by targeting NPM-ALK. Proc Natl Acad Sci U S A 108: 11977–11982. 10.1073/pnas.1100319108 - DOI - PMC - PubMed
    1. Lee H, Zhang P, Herrmann A, Yang C, Xin H, Wang Z, Hoon DS, Forman SJ, Jove R, Riggs AD, et al. (2012) Acetylated STAT3 is crucial for methylation of tumor-suppressor gene promoters and inhibition by resveratrol results in demethylation. Proc Natl Acad Sci U S A 109: 7765–7769. 10.1073/pnas.1205132109 - DOI - PMC - PubMed

Publication types

MeSH terms