Mass Cytometry Defines Virus-Specific CD4+ T Cells in Influenza Vaccination
- PMID: 33310880
- PMCID: PMC7891553
- DOI: 10.4049/immunohorizons.1900097
Mass Cytometry Defines Virus-Specific CD4+ T Cells in Influenza Vaccination
Abstract
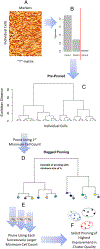
The antiviral response to influenza virus is complex and multifaceted, involving many immune cell subsets. There is an urgent need to understand the role of CD4+ T cells, which orchestrate an effective antiviral response, to improve vaccine design strategies. In this study, we analyzed PBMCs from human participants immunized with influenza vaccine, using high-dimensional single-cell proteomic immune profiling by mass cytometry. Data were analyzed using a novel clustering algorithm, denoised ragged pruning, to define possible influenza virus-specific clusters of CD4+ T cells. Denoised ragged pruning identified six clusters of cells. Among these, one cluster (Cluster 3) was found to increase in abundance following stimulation with influenza virus peptide ex vivo. A separate cluster (Cluster 4) was found to expand in abundance between days 0 and 7 postvaccination, indicating that it is vaccine responsive. We examined the expression profiles of all six clusters to characterize their lineage, functionality, and possible role in the response to influenza vaccine. Clusters 3 and 4 consisted of effector memory cells, with high CD154 expression. Cluster 3 expressed cytokines like IL-2, IFN-γ, and TNF-α, whereas Cluster 4 expressed IL-17. Interestingly, some participants had low abundance of Clusters 3 and 4, whereas others had higher abundance of one of these clusters compared with the other. Taken together, we present an approach for identifying novel influenza virus-reactive CD4+ T cell subsets, a method that could help advance understanding of the immune response to influenza, predict responsiveness to vaccines, and aid in better vaccine design.
Copyright © 2020 The Authors.
Conflict of interest statement
DISCLOSURES
The authors have no financial conflicts of interest.
Figures


Similar articles
-
Low expression of activation marker CD69 and chemokine receptors CCR5 and CXCR3 on memory T cells after 2009 H1N1 influenza A antigen stimulation in vitro following H1N1 vaccination of HIV-infected individuals.Hum Vaccin Immunother. 2015;11(9):2253-65. doi: 10.1080/21645515.2015.1051275. Epub 2015 Jun 19. Hum Vaccin Immunother. 2015. PMID: 26091502 Free PMC article.
-
Induction of Human T-cell and Cytokine Responses Following Vaccination with a Novel Influenza Vaccine.Sci Rep. 2018 Dec 20;8(1):18007. doi: 10.1038/s41598-018-36703-7. Sci Rep. 2018. PMID: 30573748 Free PMC article. Clinical Trial.
-
Age-associated change in the frequency of memory CD4+ T cells impairs long term CD4+ T cell responses to influenza vaccine.J Immunol. 2004 Jul 1;173(1):673-81. doi: 10.4049/jimmunol.173.1.673. J Immunol. 2004. PMID: 15210831
-
Hallmarks of CD4 T cell immunity against influenza.J Intern Med. 2011 May;269(5):507-18. doi: 10.1111/j.1365-2796.2011.02367.x. Epub 2011 Mar 25. J Intern Med. 2011. PMID: 21362069 Free PMC article. Review.
-
Memory CD4 T cell-mediated immunity against influenza A virus: more than a little helpful.Arch Immunol Ther Exp (Warsz). 2013 Oct;61(5):341-53. doi: 10.1007/s00005-013-0236-z. Epub 2013 May 25. Arch Immunol Ther Exp (Warsz). 2013. PMID: 23708562 Free PMC article. Review.
Cited by
-
Human influenza virus challenge identifies cellular correlates of protection for oral vaccination.Cell Host Microbe. 2021 Dec 8;29(12):1828-1837.e5. doi: 10.1016/j.chom.2021.10.009. Epub 2021 Nov 15. Cell Host Microbe. 2021. PMID: 34784508 Free PMC article.
-
Ex Pluribus Unum: The CD4 T Cell Response against Influenza A Virus.Cells. 2024 Apr 5;13(7):639. doi: 10.3390/cells13070639. Cells. 2024. PMID: 38607077 Free PMC article. Review.
-
Cytometry profiling of ex vivo recall responses to Coxiella burnetii in previously naturally exposed individuals reveals long-term changes in both adaptive and innate immune cellular compartments.Front Immunol. 2023 Oct 11;14:1249581. doi: 10.3389/fimmu.2023.1249581. eCollection 2023. Front Immunol. 2023. PMID: 37885896 Free PMC article.
-
Predictive Markers of Immunogenicity and Efficacy for Human Vaccines.Vaccines (Basel). 2021 Jun 1;9(6):579. doi: 10.3390/vaccines9060579. Vaccines (Basel). 2021. PMID: 34205932 Free PMC article. Review.
-
High-dimensional single-cell phenotyping unveils persistent differences in immune cell profiles between severe and moderate seasonal influenza.Front Immunol. 2025 Jul 22;16:1576861. doi: 10.3389/fimmu.2025.1576861. eCollection 2025. Front Immunol. 2025. PMID: 40766325 Free PMC article.
References
-
- Osterholm MT, Kelley NS, Sommer A, and Belongia EA. 2012. Efficacy and effectiveness of influenza vaccines: a systematic review and meta-analysis. [Published erratum appears in 2012 Lancet Infect. Dis. 12: 655.] Lancet Infect. Dis. 12: 36–44. - PubMed
-
- Nichol KL, Lind A, Margolis KL, Murdoch M, McFadden R,Hauge M, Magnan S, and Drake M. 1995. The effectiveness of vaccination against influenza in healthy, working adults. N. Engl. J. Med. 333: 889–893. - PubMed
-
- Govaert TM, Thijs CT, Masurel N, Sprenger MJ, Dinant GJ, and Knottnerus JA. 1994. The efficacy of influenza vaccination in elderly individuals. A randomized double-blind placebo-controlled trial. JAMA 272: 1661–1665. - PubMed
-
- McMichael AJ, Gotch FM, Noble GR, and Beare PA. 1983. Cytotoxic T-cell immunity to influenza. N. Engl. J. Med. 309: 13–17. - PubMed
-
- Galli G, Medini D, Borgogni E, Zedda L, Bardelli M, Malzone C,Nuti S, Tavarini S, Sammicheli C, Hilbert AK, et al. 2009. Adjuvanted H5N1 vaccine induces early CD4+ T cell response that predicts long-term persistence of protective antibody levels. Proc. Natl. Acad. Sci. USA 106: 3877–3882. - PMC - PubMed
Publication types
MeSH terms
Substances
Grants and funding
LinkOut - more resources
Full Text Sources
Medical
Research Materials

