. 2021 Jan 5;118(1):e2021450118.
doi: 10.1073/pnas.2021450118. Epub 2020 Dec 28.

Targeting transcriptional regulation of SARS-CoV-2 entry factors ACE2 and TMPRSS2

Affiliations

Targeting transcriptional regulation of SARS-CoV-2 entry factors ACE2 and TMPRSS2

Yuanyuan Qiao et al. Proc Natl Acad Sci U S A. .

Abstract

Severe acute respiratory syndrome coronavirus 2 (SARS-CoV-2), the virus responsible for COVID-19, employs two key host proteins to gain entry and replicate within cells, angiotensin-converting enzyme 2 (ACE2) and the cell surface transmembrane protease serine 2 (TMPRSS2). TMPRSS2 was first characterized as an androgen-regulated gene in the prostate. Supporting a role for sex hormones, males relative to females are disproportionately affected by COVID-19 in terms of mortality and morbidity. Several studies, including one employing a large epidemiological cohort, suggested that blocking androgen signaling is protective against COVID-19. Here, we demonstrate that androgens regulate the expression of ACE2, TMPRSS2, and androgen receptor (AR) in subsets of lung epithelial cells. AR levels are markedly elevated in males relative to females greater than 70 y of age. In males greater than 70 y old, smoking was associated with elevated levels of AR and ACE2 in lung epithelial cells. Transcriptional repression of the AR enhanceosome with AR or bromodomain and extraterminal domain (BET) antagonists inhibited SARS-CoV-2 infection in vitro. Taken together, these studies support further investigation of transcriptional inhibition of critical host factors in the treatment or prevention of COVID-19.

Keywords: ACE2; BET inhibitors; SARS-CoV-2; TMPRSS2; androgen receptor.


Conflict of interest statement

The authors declare no competing interest.

Figures
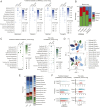
Fig. 1.
Fig. 1.
Single-cell analysis of host SARS-CoV-2 entry factors and AR in human and mouse lungs. (A) Bubble plots of ACE2, TMPRSS2, and AR expression from publicly available scRNAseq datasets of human lung. Color bar represents mean expression (mean_expr) of each gene in specific cell types, and bubble size represents the percentage of cells in each cell type that expresses that gene (here and in C). Each plot is labeled below with an identifier, reflecting the name of the first author of the appropriate manuscript (same with C) (−23). AT1, alveolar type 1; AT2, alveolar type 2; SMC, smooth muscle cell; Alv., alveolar. (B) Stacked bar plot representing the fraction of appropriate, color-coded cell types obtained by scRNAseq (public dataset) and snRNAseq (this study) of mouse lung. (C) Bubble plot of Ace2, Tmprss2, and Ar expression from publicly available scRNAseq dataset and snRNAseq dataset from this study of mouse lung. NE, neuroendocrine; Endo. Cap., endothelial capillary; Endo. Vas., endothelial vasculature. (D) The t-distributed stochastic neighbor embedding (tSNE) plots of snRNAseq data from mouse lungs collected from intact or castrated (cast) mice. Each dot represents a cell, and each cell type identified by our analysis is distinctly color coded. Fibro, fibroblast. (E) Stacked bar plot representing the fraction of appropriate, color-coded cell types obtained by snRNAseq of lungs from intact and castrated (cast) mice. (F) Combined violin and scatter plots representing the expression of Ace2, Tmprss2, and Ar in lungs from intact and castrated mice from publicly available datasets of mouse prostate and this study of mouse lung. Each dot is an individual cell (only nonzero values are indicated), and all cell types from each sample have been included here to perform a pseudobulk gene expression analysis.
Fig. 2.
Fig. 2.
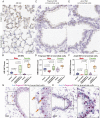
Expression levels of AR, Tmprss2, and Ace2 in murine lungs are regulated by androgen. (A) Representative images of AR IHC in murine lungs from intact and castrated male mice. (B) Quantitative analysis of AR IHC score of murine lungs from male (intact, castrated, castrated + testosterone) and female (intact, intact + testosterone); n = 6 in each group, and P values were calculated by unpaired t test (here and in D and F). (C) Representative images of Tmprss2 ISH and (E) Ace2 ISH in murine bronchial cells from intact and castrated male mice. (D) Quantitative analysis of Tmprss2 ISH and (F) Ace2 ISH H-score in murine bronchial cells from male and female. (G) Representative image showing coexpression of Ar and Tmprss2 ISH in murine bronchial cells. Arrows indicate cells expressing both Ar and Tmprss2. A magnified area (1) is shown on the right for this and panel H. (H) Representative image showing coexpression of Ace2 and Tmprss2 ISH in murine bronchial cells.
Fig. 3.
Fig. 3.
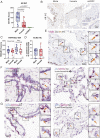
Expression patterns of AR, TMPRSS2, and ACE2 in human lungs. (A) Quantitative analysis of AR IHC score of human lungs in male (n = 21), female (n = 18), and mCRPC (n = 5). P values were calculated by unpaired t test. (B) Representative images of A. (C) Quantitative analysis of TMPRSS2 ISH in bronchial and nonbronchial cells and (D) ACE2 IHC in nonbronchial cells of male (n = 17) and female (n = 11). P values were calculated by unpaired t test and showed no significance (ns). (E) Representative IHC images showing coexpression of ACE2 and AR in human lungs. Arrows indicate cells expressing both ACE2 and AR. (F) Representative ISH images showing coexpression of AR and TMPRSS2 and (G) ACE2 and TMPRSS2 in human bronchial and nonbronchial cells. Arrows indicate cells expressing both (F) AR and TMPRSS2 and (G) ACE2 and TMPRSS2.
Fig. 4.
Fig. 4.
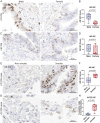
Smoking elevates AR and ACE2 expression in aged male lungs. (A) Representative images and (B) quantitative analysis of AR IHC score of human lungs in males (n = 17) and females (n = 9) over 70 y of age. P values were calculated by unpaired t test in all panels. (C) Representative images and (D) quantitative analysis of AR IHC score of human lungs in males (n = 8) and females (n = 9) under 30 y old. (E) Representative images and (F) quantitative analysis of AR IHC score of aged male (>70 y old) lungs in nonsmokers (n = 6) and smokers (n = 11). (G) Representative images and (H) quantitative analysis of ACE2 IHC of aged male (>70 y old) lungs in nonsmokers (n = 6) and smokers (n = 11).
Fig. 5.
Fig. 5.
AR antagonists diminish SARS-CoV-2 infection in LNCaP cells. (A) Schematic representation of the SARS-CoV-2 bioassay design for the antiviral drug screen. (B) Representative images of immunofluorescent staining of nuclei and SARS-CoV-2 nucleocapsid protein in various treatment groups of AR-targeting drugs. (C) Dose–response curves of SARS-CoV-2 virus percent infection and cell viability of various AR antagonists in LNCaP. (D) Relative levels of TMPRSS2 and ACE2 in LNCaP with indicated treatment for 72 h.
Fig. 6.
Fig. 6.
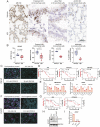
BET antagonists down-regulate AR, ACE2, and Tmprss2 in murine lung and decrease SARS-CoV-2 infection in human cells. (A) Representative images of AR IHC, Tmprss2 and Ace2 ISH in bronchial cells, and ACE2 IHC in nonbronchial cells in murine lungs, from vehicle and JQ1-treated male mice. (B) Quantitative analysis of AR IHC score, Tmprss2 and Ace2 ISH H score, and percentage of ACE2 positive cells in 500 nonbronchial cells of murine lung from vehicle (n = 6) and JQ1 (n = 9) treated male mice. P values were calculated by unpaired t test. (C) Representative images of immunofluorescent staining of nuclei and SARS-CoV-2 nucleocapsid protein in various treatment groups of BET inhibitors in the SARS-CoV-2 bioassay in LNCaP cells. (D) Dose–response curves of SARS-CoV-2 virus percent infection and cell viability of LNCaP cells treated with various BET antagonists. (E) Relative levels of TMPRSS2 and ACE2 in LNCaP cells with indicated treatment for 72 h. P values were calculated by unpaired t test. *: P < 0.05; **: P < 0.01. (F) As in C, but in H1437 cells. (G) As in D, but in H1437 cells. (H) Protein levels of ACE2 with control (Ctrl), 1 µM JQ1, or 1 µM OTX015 treatment for 72 h in H1437 cells. (I) Relative levels of ACE2 in H1437 cells with indicated treatment for 72 h. JQ1 (1 µM), OTX015 (1 µM). ***: P < 0.001. P values were calculated by unpaired t test.
Fig. 7.
Fig. 7.
Schematic illustration of TMPRSS2 and ACE2 regulation by AR and their roles during SARS-CoV-2 infection. AR binds to enhancer elements of both ACE2 and TMPRSS2 genes, connecting the regulatory circuit between the enhanceosome complex (comprising MED1, BRD4, etc.) and the promoter-bound RNA polymerase machinery (comprising TBP, TAFs, etc.) to activate gene expression. AR regulation of the driver TMPRSS2-ERG oncogenic gene fusion has been thoroughly credentialed in prostate cancer. During SARS-CoV-2 infection, the serine protease TMPRSS2 primes the viral Spike protein, which then binds to the ACE2 receptor to gain entry into host cells. We demonstrate that AR regulates TMPRSS2 and ACE2 expression in prostate and subsets of pulmonary epithelial cells. Agents directly targeting AR or BET proteins inhibit SARS-CoV-2 infectivity through transcriptional down-regulation of host cell TMPRSS2 and ACE2 expression. TBP, TATA-binding protein; TAFs, TBP-associated factors; FOXA1, forkhead box A1; BRD4, bromodomain-containing protein 4; MED1, mediator complex subunit 1.

References

    1. Wiersinga W. J., Rhodes A., Cheng A. C., Peacock S. J., Prescott H. C., Pathophysiology, transmission, diagnosis, and treatment of coronavirus disease 2019 (COVID-19): A review. JAMA 324, 782–793 (2020). - PubMed
    1. Mittal A., et al. , COVID-19 pandemic: Insights into structure, function, and hACE2 receptor recognition by SARS-CoV-2. PLoS Pathog. 16, e1008762 (2020). - PMC - PubMed
    1. Yan R., et al. , Structural basis for the recognition of SARS-CoV-2 by full-length human ACE2. Science 367, 1444–1448 (2020). - PMC - PubMed
    1. Hoffmann M., et al. , SARS-CoV-2 cell entry depends on ACE2 and TMPRSS2 and is blocked by a clinically proven protease inhibitor. Cell 181, 271–280.e8 (2020). - PMC - PubMed
    1. Iwata-Yoshikawa N., et al. , TMPRSS2 contributes to virus spread and immunopathology in the airways of murine models after coronavirus infection. J. Virol. 93, 1–15 (2019). - PMC - PubMed