. 2020 Dec 11;11(1):6374.
doi: 10.1038/s41467-020-20063-w.

Single-nucleus RNA-seq identifies transcriptional heterogeneity in multinucleated skeletal myofibers

Affiliations

Single-nucleus RNA-seq identifies transcriptional heterogeneity in multinucleated skeletal myofibers

Michael J Petrany et al. Nat Commun. .

Abstract

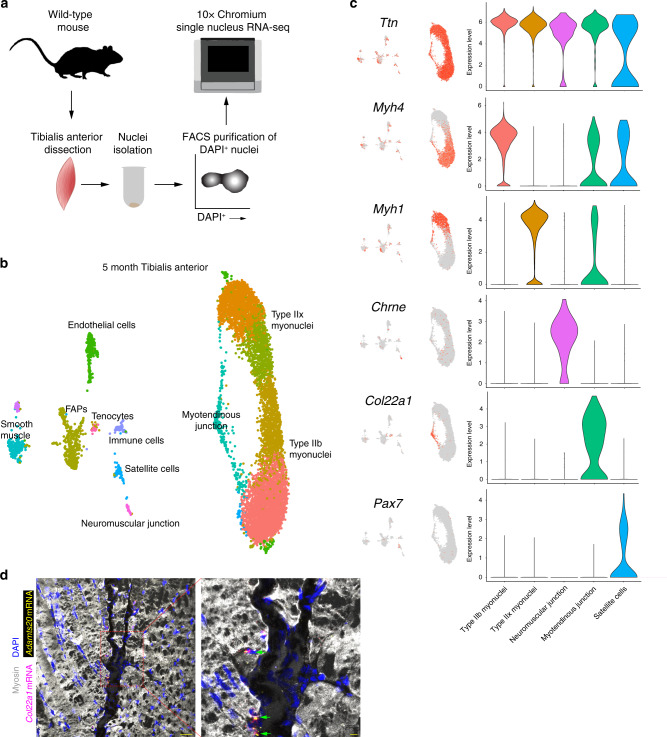
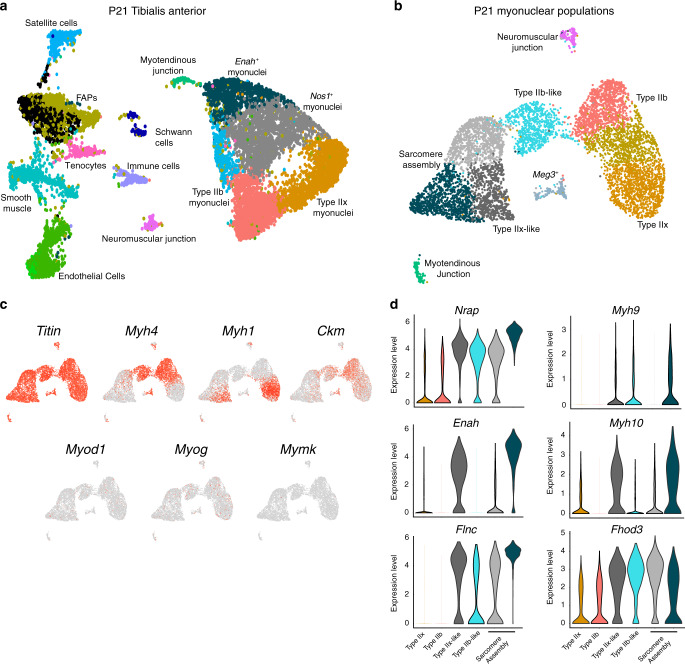
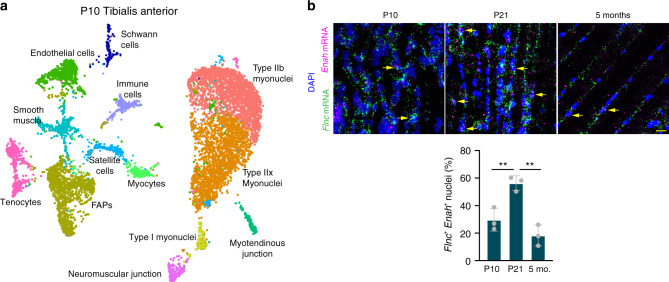
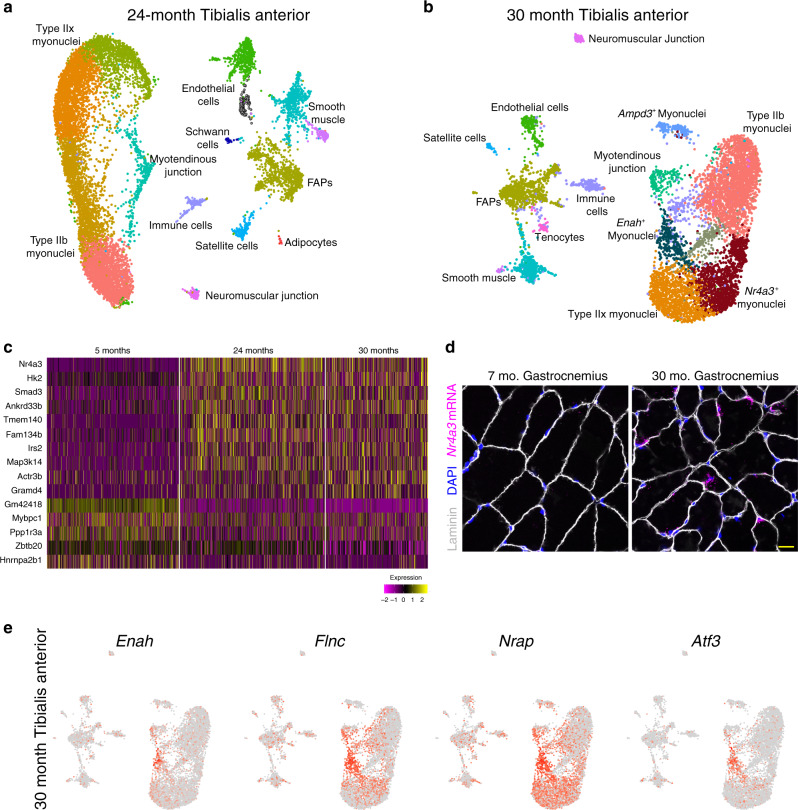
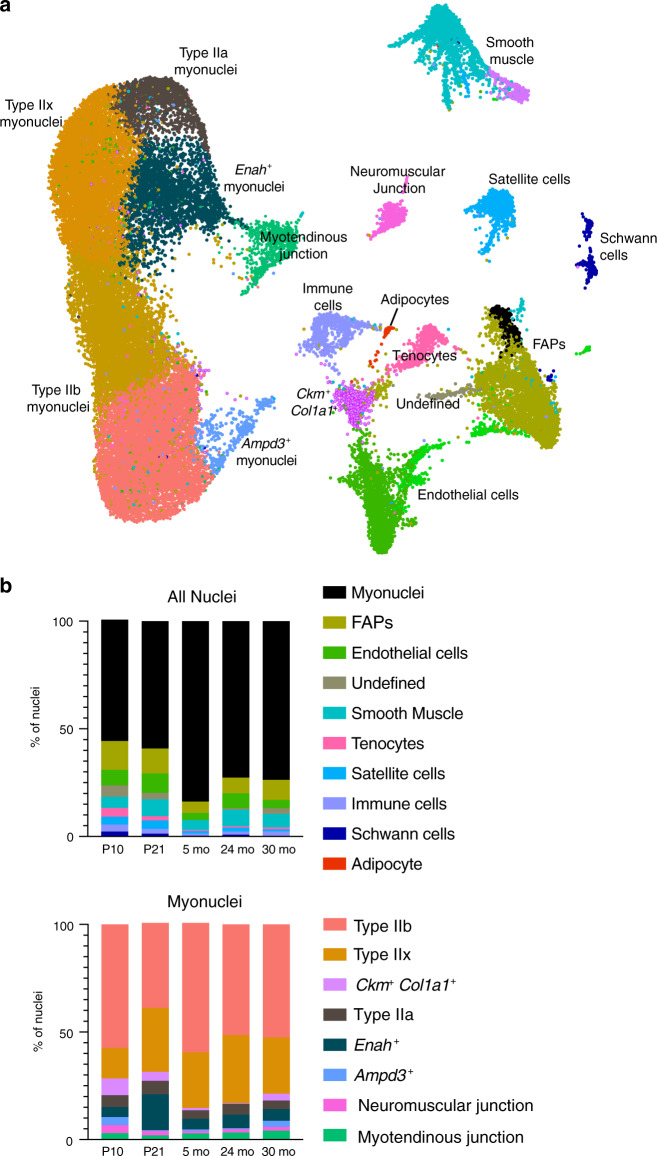
While the majority of cells contain a single nucleus, cell types such as trophoblasts, osteoclasts, and skeletal myofibers require multinucleation. One advantage of multinucleation can be the assignment of distinct functions to different nuclei, but comprehensive interrogation of transcriptional heterogeneity within multinucleated tissues has been challenging due to the presence of a shared cytoplasm. Here, we utilized single-nucleus RNA-sequencing (snRNA-seq) to determine the extent of transcriptional diversity within multinucleated skeletal myofibers. Nuclei from mouse skeletal muscle were profiled across the lifespan, which revealed the presence of distinct myonuclear populations emerging in postnatal development as well as aging muscle. Our datasets also provided a platform for discovery of genes associated with rare specialized regions of the muscle cell, including markers of the myotendinous junction and functionally validated factors expressed at the neuromuscular junction. These findings reveal that myonuclei within syncytial muscle fibers possess distinct transcriptional profiles that regulate muscle biology.


Conflict of interest statement

The authors declare no competing interests.

Figures

Fig. 1
Fig. 1. snRNA-seq of mouse tibialis anterior muscle at 5 months of age.
a Schematic for nuclei purification and sequencing from mouse skeletal muscle. b Unbiased clustering of snRNA-seq data represented on a UMAP. c UMAP and violin plots showing gene expression for myonuclear populations including Ttn (all myonuclei), Myh4 (Type IIb myonuclei), Myh1 (Type IIx myonuclei), Chrne (neuromuscular junction), Col22a1 (myotendinous junction), and Pax7 (satellite cells). Intermediate myonuclear clusters were combined with their respective fiber type myonuclei for generation of violin plots. The y-axis shows expression level as probability distribution across clusters. d Representative image of smRNA-FISH for Col22a1 and Adamts20 on 5-month longitudinal tibialis anterior sections, showing localization of transcripts in myonuclei at the myotendinous junction (n = 5). Green arrows show Col22a1+ Adamts20+ nuclei. Scale bars: 50 μm (left panel), 10 μm (right panel).
Fig. 2
Fig. 2. Temporal myonuclear heterogeneity revealed in developing muscle.
a Unbiased clustering of nuclei from postnatal (P) day 21 presented in a UMAP revealed all major populations in addition to unique myonuclei outside the canonical Type IIb and Type IIx myonuclei. These nuclei populations were marked by Nos1 and Enah, respectively. b Subclustering of myonuclear populations from P21 muscle revealed sarcomere assembly myonuclear states. c Feature plots assessing expression of mature muscle markers (Ttn, Myh1, Myh4, and Ckm) and differentiation markers (Myod1, Myog, Mymk) from the myonuclear populations in b. d Violin plots showing the sarcomere assembly myonuclei are enriched for a transcriptional profile associated with early myofibrillogenesis (expression of Nrap, Enah, Flnc, Myh9, Myh10, Fhod3).
Fig. 3
Fig. 3. Myonuclear transcriptional states exhibit temporal specificity in development.
a UMAP representing snRNA-seq data from a postnatal (P) day 10 tibialis anterior shows the presence of an activated muscle progenitor population (myocytes) but the absence of defined sarcomere myonuclear states. b smRNA-FISH for Flnc and Enah shows an expansion of sarcomere assembly state myonuclei in P21 tibialis anterior compared to P10 and adult muscle. Flnc+ Enah+ nuclei were quantified at each timepoint (n = 3). Data are presented as mean ± standard deviation. A one-way ANOVA with Tukey post-hoc comparison was used to determine statistical significance, **P < 0.01. Scale bar: 20 μm. Source data are provided as a Source Data file.
Fig. 4
Fig. 4. Uniform gene expression between myonuclei is disrupted in aged muscle.
a UMAP of snRNA-seq data from the tibialis anterior of a 24-month-old mouse displaying similar clusters as at 5 months of age. b UMAP of snRNA-seq data from 30-month-old muscle displaying the presence of unique clusters of myonuclei marked by Ampd3, Enah, and Nr4a3. c Heatmap of integrated myonuclei from 5, 24, and 30-month tibialis anterior muscle showing a consistent transcriptional signature of aging muscle. Columns are individual nuclei belonging to each to timepoint. d Representative image of smRNA-FISH for Nr4a3 validated its upregulation in myonuclei in 30-month skeletal muscle (n = 3 for each group). Scale bar: 10 μm. e Feature plots of key marker genes of the Enah+ population within 30-month myonuclei.
Fig. 5
Fig. 5. Integration of snRNA-seq across the lifespan reveals myonuclear population dynamics.
a Integrated UMAP of snRNA-seq data from postnatal day (P) 10, P21, 5-month, 24-month, and 30-month tibialis anterior muscle. b Proportional composition of nuclear types across the lifespan. Major categories (FAPs, endothelial cells, smooth muscle) include closely-related subpopulations. Myonuclei are combined (top graph) and subsetted (bottom graph) to display myonuclear composition dynamics.
Fig. 6
Fig. 6. Discovery and functional characterization of previously unknown NMJ marker genes.
a Representative images from smRNA-FISH for Ufsp1, Lfrn5, Vav3, and Ano4 on skeletal muscle sections showing co-localization with the canonical NMJ protein, acetylcholine receptor (AChR) (n = 3). AChR was visualized through α-bungarotoxin labeling. b Quantitative real-time PCR (qPCR) analysis for the indicated genes not previously associated with the NMJ from normal (n = 4) and denervated (n = 5) muscle. c Schematic for a siRNA screen in C2C12 myoblasts designed to test the function of candidate NMJ genes. siRNA was transfected two days after differentiation and three days later α-bungarotoxin was used to analyze AChR clustering as a surrogate for NMJ formation. d qPCR analysis for the genes targeted with siRNA. A scrambled siRNA was used as a control. e Representative images of C2C12 myotube cultures after treatment with various siRNAs and staining with α-bungarotoxin. Cells were also stained with phalloidin and DAPI. f Quantification of AChR clusters per field of view from e. g qPCR analysis for genes associated with myogenesis and NMJ formation. Scale bars: a 50 μm (top left panel), 10 μm (top right and bottom panels), e 50 μm. Data in d, f, and g are from three independent experiments. All data are represented as mean ± standard deviation. An unpaired two-sided t-test was used to determine statistical significance, **P < 0.01, ***P < 0.001, ****P < 0.0001. Source data are provided as a Source Data file.

References

    1. Kim JH, Jin P, Duan R, Chen EH. Mechanisms of myoblast fusion during muscle development. Curr. Opin. Genet. Dev. 2015;32:162–170. doi: 10.1016/j.gde.2015.03.006. - DOI - PMC - PubMed
    1. Petrany MJ, Millay DP. Cell Fusion: merging membranes and making muscle. Trends Cell Biol. 2019;29:964–973. doi: 10.1016/j.tcb.2019.09.002. - DOI - PMC - PubMed
    1. Schiaffino S, Reggiani C. Fiber types in mammalian skeletal muscles. Physiol. Rev. 2011;91:1447–1531. doi: 10.1152/physrev.00031.2010. - DOI - PubMed
    1. Dumont NA, Bentzinger CF, Sincennes MC, Rudnicki MA. Satellite cells and skeletal muscle regeneration. Compr. Physiol. 2015;5:1027–1059. doi: 10.1002/cphy.c140068. - DOI - PubMed
    1. Giordani L, et al. High-dimensional single-cell cartography reveals novel skeletal muscle-resident cell populations. Mol. Cell. 2019;74:609–621.e606. doi: 10.1016/j.molcel.2019.02.026. - DOI - PubMed

Publication types