. 2020 Dec 11;11(1):6351.
doi: 10.1038/s41467-020-20235-8.

Genomic epidemiology reveals transmission patterns and dynamics of SARS-CoV-2 in Aotearoa New Zealand

Affiliations

Genomic epidemiology reveals transmission patterns and dynamics of SARS-CoV-2 in Aotearoa New Zealand

Jemma L Geoghegan et al. Nat Commun. .

Abstract

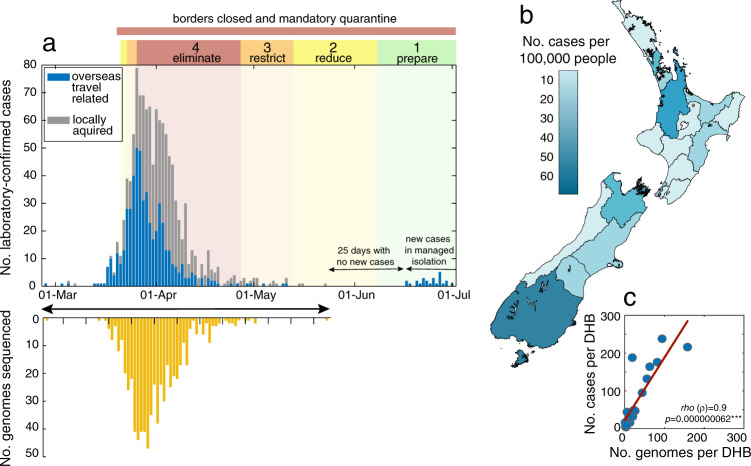
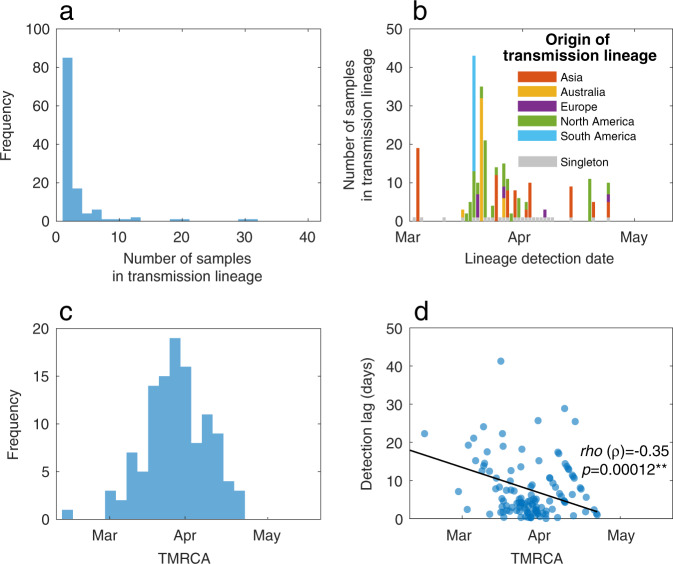
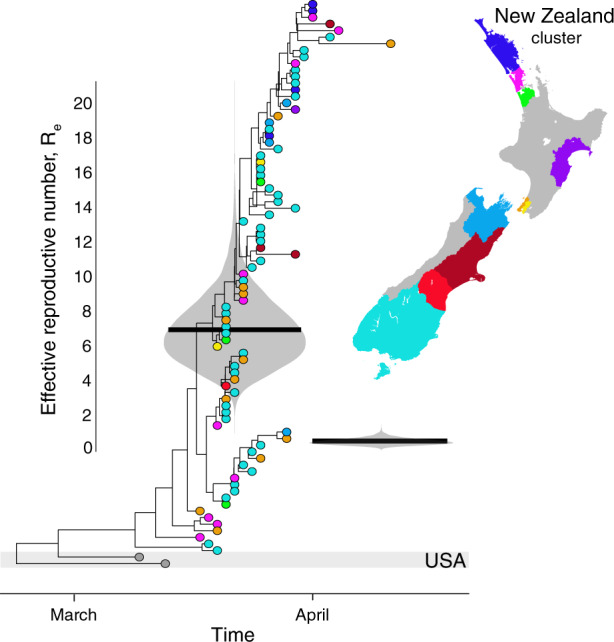
New Zealand, a geographically remote Pacific island with easily sealable borders, implemented a nationwide 'lockdown' of all non-essential services to curb the spread of COVID-19. Here, we generate 649 SARS-CoV-2 genome sequences from infected patients in New Zealand with samples collected during the 'first wave', representing 56% of all confirmed cases in this time period. Despite its remoteness, the viruses imported into New Zealand represented nearly all of the genomic diversity sequenced from the global virus population. These data helped to quantify the effectiveness of public health interventions. For example, the effective reproductive number, Re of New Zealand's largest cluster decreased from 7 to 0.2 within the first week of lockdown. Similarly, only 19% of virus introductions into New Zealand resulted in ongoing transmission of more than one additional case. Overall, these results demonstrate the utility of genomic pathogen surveillance to inform public health and disease mitigation.


Conflict of interest statement

The authors declare no competing interests.

Figures

Fig. 1
Fig. 1. Number and distribution of cases and genomes.
a Number of laboratory-confirmed cases by reported date, both locally acquired (grey) and linked to overseas travel (blue) in New Zealand, highlighting the timing of public health alert levels 1–4 (‘eliminate’, ‘restrict’, ‘reduce’, ‘prepare’) and national border closures. The number of genomes sequenced in this study is shown over time in yellow. b Map of New Zealand’s District Health Boards shaded by the incidence of laboratory-confirmed cases of COVID-19 per 100,000 people, as defined by the colour-bar. c Number of laboratory-confirmed cases per District Health Board (DHB) versus the number of genomes sequenced, indicating Spearman’s rho (ρ), where asterisks indicate statistical significance (p = 0.000000062).
Fig. 2
Fig. 2. Genomic diversity of SARS-CoV-2 in New Zealand.
a Root-to-tip regression analysis of New Zealand (blue) and global (grey) SARS-CoV-2 sequences, with the determination coefficient, r2 (an asterisk indicates statistical significance; p = 0.049). b Maximum-likelihood time-scaled phylogenetic analysis of 649 viruses sampled from New Zealand (coloured circles) on a background of 1000 randomly subsampled viruses from the globally available data (grey circles). Viruses sampled from New Zealand are colour-coded according to their genomic lineage as labelled in c. c The number of SARS-CoV-2 genomes sampled in New Zealand within each lineage. d The sampling location and proportion of SARS-CoV-2 genomes sampled from each viral genomic lineage is shown on the map of New Zealand. e The frequency of D (blue) and G (red) amino acids at residue 614 on the spike protein over time.
Fig. 3
Fig. 3. Genomic transmission lineages of SARS-CoV-2 in New Zealand.
a Frequency of transmission lineage size. b The number of samples in each transmission lineage as a function of the date at which the transmission lineage was sampled, coloured by the likely origin of each lineage (inferred from epidemiological data). Importation events that led to only one additional case (singletons) are shown in grey over time. c Frequency of TMRCA (the time of the most recent common ancestor) of importation events over time. d The difference between the TMRCA and the date as which a transmission lineage was detected (i.e. detection lag) as a function of TMRCA. Spearman’s rho (ρ) indicates a significant negative relationship (p = 0.00012).
Fig. 4
Fig. 4. Estimates of the effective reproductive number, Re, through time.
Maximum clade credibility phylogenetic tree of New Zealand’s largest cluster with an infection that most likely originated in the USA. Estimates of the effective reproductive number, Re, are shown in violin plots superimposed onto the tree, grouping the New Zealand samples into two time-intervals as determined by the model. Black horizontal lines indicate the mean Re. Tips are coloured by the reporting District Health Board and their location shown on the map.

References

    1. Wu F, et al. A new coronavirus associated with human respiratory disease in China. Nature. 2020;579:265–269. doi: 10.1038/s41586-020-2008-3. - DOI - PMC - PubMed
    1. Zhou P, et al. A pneumonia outbreak associated with a new coronavirus of probable bat origin. Nature. 2020;579:270–273. doi: 10.1038/s41586-020-2012-7. - DOI - PMC - PubMed
    1. Wu JT, et al. Estimating clinical severity of COVID-19 from the transmission dynamics in Wuhan, China. Nat. Med. 2020;26:506–510. doi: 10.1038/s41591-020-0822-7. - DOI - PMC - PubMed
    1. Russell, T. W. et al. Estimating the infection and case fatality ratio for coronavirus disease (COVID-19) using age-adjusted data from the outbreak on the Diamond Princess cruise ship, February 2020. Euro Surveill. 25, 10.2807/1560-7917.Es.2020.25.12.2000256 (2020). - PMC - PubMed
    1. Verity R, et al. Estimates of the severity of coronavirus disease 2019: a model-based analysis. Lancet Infect. Dis. 2020;20:669–677. doi: 10.1016/S1473-3099(20)30243-7. - DOI - PMC - PubMed

Publication types

MeSH terms