. 2020 Dec 11;11(1):6369.
doi: 10.1038/s41467-020-19989-y.

Using metacommunity ecology to understand environmental metabolomes

Affiliations

Using metacommunity ecology to understand environmental metabolomes

Robert E Danczak et al. Nat Commun. .

Abstract

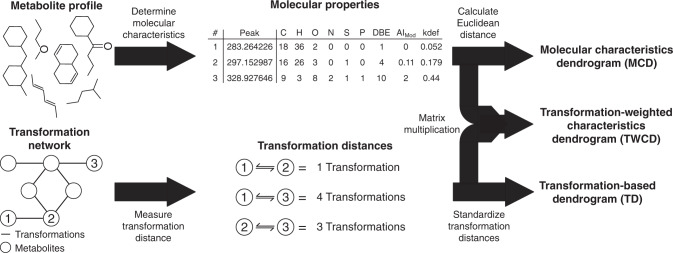
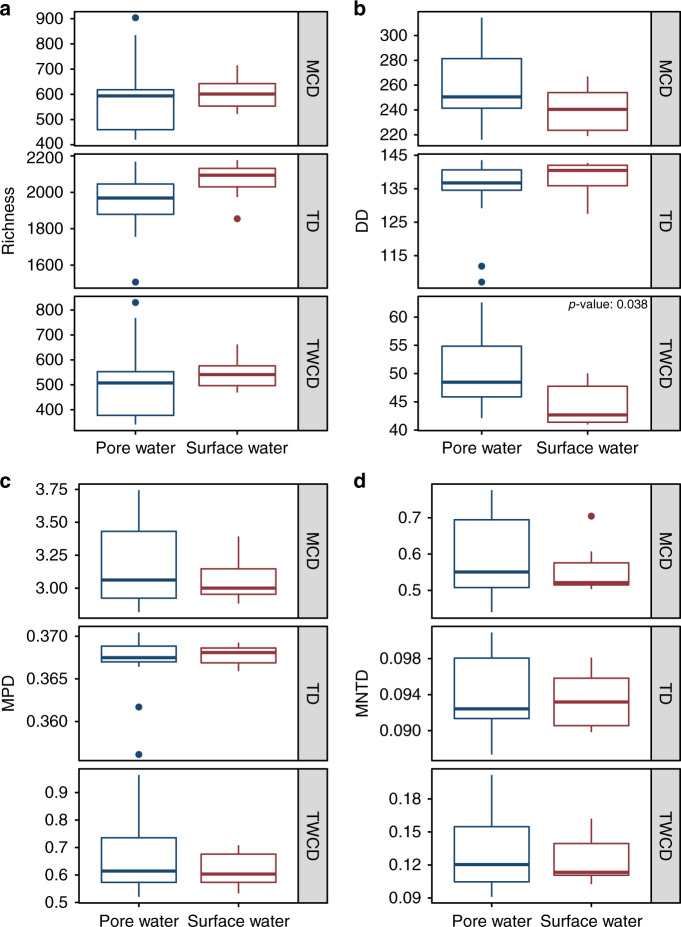
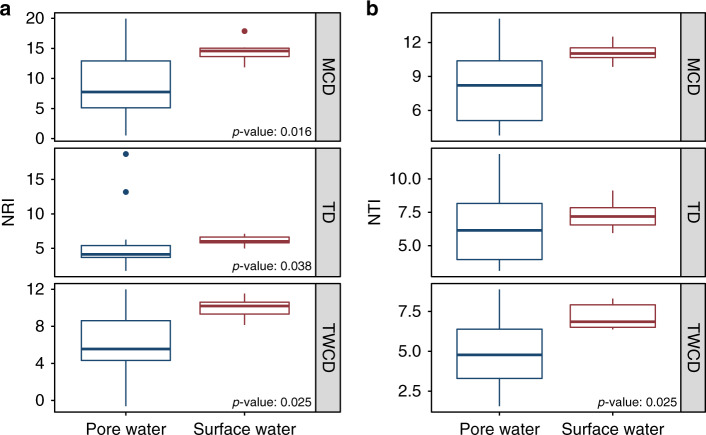
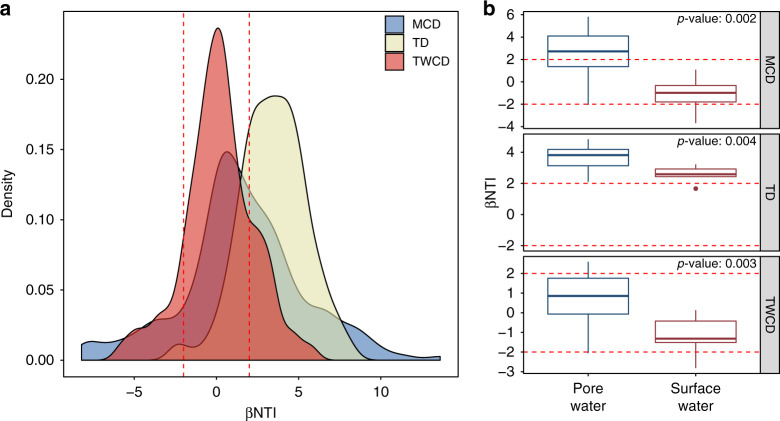
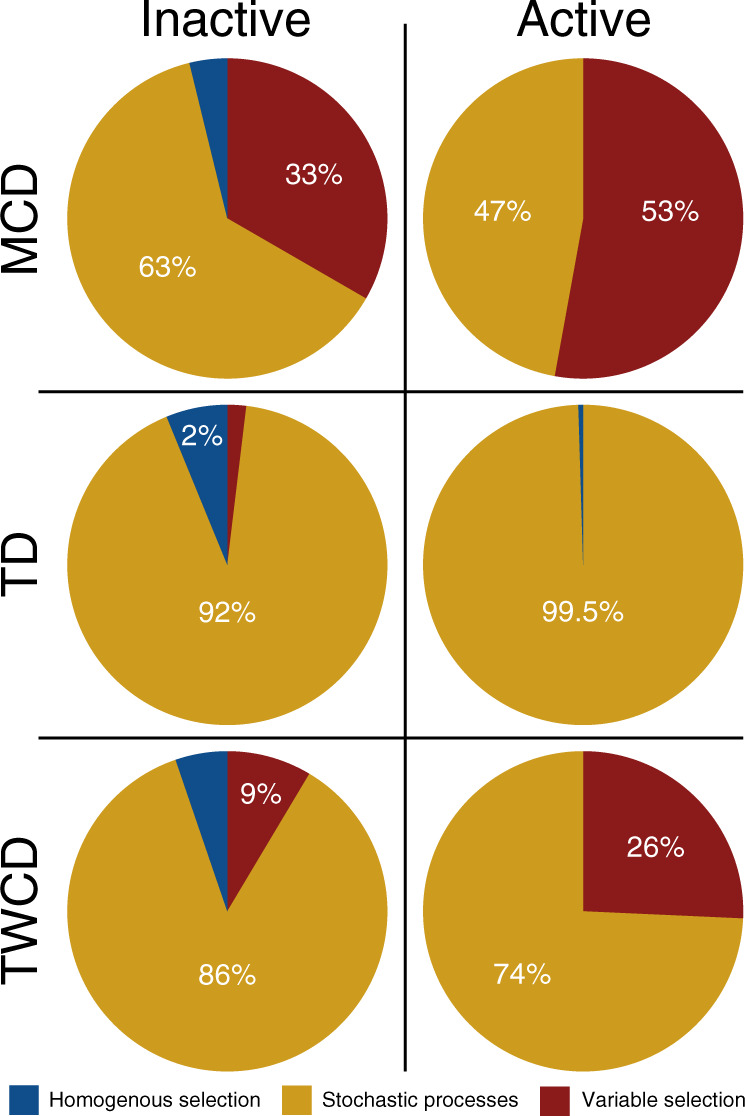
Environmental metabolomes are fundamentally coupled to microbially-linked biogeochemical processes within ecosystems. However, significant gaps exist in our understanding of their spatiotemporal organization, limiting our ability to uncover transferrable principles and predict ecosystem function. We propose that a theoretical paradigm, which integrates concepts from metacommunity ecology, is necessary to reveal underlying mechanisms governing metabolomes. We call this synthesis between ecology and metabolomics 'meta-metabolome ecology' and demonstrate its utility using a mass spectrometry dataset. We developed three relational metabolite dendrograms using molecular properties and putative biochemical transformations and performed ecological null modeling. Based upon null modeling results, we show that stochastic processes drove molecular properties while biochemical transformations were structured deterministically. We further suggest that potentially biochemically active metabolites were more deterministically assembled than less active metabolites. Understanding variation in the influences of stochasticity and determinism provides a way to focus attention on which meta-metabolomes and which parts of meta-metabolomes are most likely to be important to consider in mechanistic models. We propose that this paradigm will allow researchers to study the connections between ecological systems and their molecular processes in previously inaccessible detail.


Conflict of interest statement

The authors declare no competing interests.

Figures

Fig. 1
Fig. 1. Figure summarizing the steps necessary to create the three dendrograms used throughout this manuscript.
The top path (Molecular Characteristics Dendrogram or MCD) demonstrates the relational information provided by molecular properties, like elemental composition and aromaticity index, while the bottom path (Transformation-based Dendrogram or TD) emphasizes the relationships driven by potential biochemical transformation networks. The middle path (Transformation-Weighted Characteristics Dendrogram or TWCD) is a combination of information provided by the top and both paths. All metabolites in the transformation network would have been identified; the numbered metabolites are used to demonstrate the approach. Definition of acronyms under molecular properties: C, H, O, N, S, and P are elemental counts; DBE is double-bond equivalents; AIMod is modified aromaticity index; and kdef is Kendrick defect.
Fig. 2
Fig. 2. Alpha diversity boxplots for the metabolite data.
a Richness (akin to metabolite count). b Dendrogram Diversity (DD) which is analogous to Faith’s Phylogenetic Diversity (PD). c Mean Pairwise Distance (MPD). d Mean Nearest Taxon Distance (MNTD). Two-sided Mann–Whitney U tests (Surface water n = 7, Pore water n = 14) determined that only the TWCD-DD comparison was significant; the p value is indicated within the figure. Each panel represents metrics calculated for the corresponding metabolite dendrogram (e.g., MCD, TD, and TWCD). Boxes represent the 1st and 3rd quartiles, the horizontal line within the box represents the median, the vertical lines represent extreme values calculated based on the interquartile range, and the points are potential outliers.
Fig. 3
Fig. 3. Alpha diversity null modeling results for the metabolite data.
a Net Relatedness Index (NRI). b Nearest Taxon Index (NTI). If differences between surface water and pore water samples was significant as determined by a two-sided Mann–Whitney U test (Surface water n = 7, Pore water n = 14), the p value is indicated within the plot. Each panel represents metrics calculated for the corresponding metabolite dendrogram (e.g., MCD, TD, and TWCD). Boxes represent the 1st and 3rd quartiles, the horizontal line within the box represents the median, the vertical lines represent extreme values calculated based on the interquartile range, and the points are potential outliers.
Fig. 4
Fig. 4. Beta-diversity ordination plots.
a Jaccard Dissimiarlity-based Principal Coordinate Analysis (PCoA). b UniFrac PCoA generated using the MCD. c UniFrac PCoA generated using the TD. d UniFrac PCoA generated using the TWCD.
Fig. 5
Fig. 5. Beta-diversity null modeling results.
a Density plot of βNTI results for all comparisons. b Boxplots of average within-scale βNTI results (e.g., only pore water-to-pore water comparisons). Dashed red lines indicate the assembly process thresholds: βNTI < −2 represents homogenous selection, βNTI > 2 indicates variable selection, and |βNTI | < 2 indicates stochastic assembly. Two-sided Mann–Whitney U tests (Surface water n = 7, Pore water n = 14) were used to reveal significant differences between pore water and surface water distributions in panel b, with corresponding p values listed in the figure. Boxes represent the 1st and 3rd quartiles, the horizontal line within the box represents the median, the vertical lines represent extreme values calculated based on the interquartile range, and the points are potential outliers.
Fig. 6
Fig. 6. Ecological assembly processes divided by putative metabolite activity.
Pie charts illustrating the differences in ecological assembly processes for the putatively active (metabolites involved in >40 transformations) and inactive (metabolites involved in 0 transformations) fractions of the metabolite assemblages.

References

    1. Graham EB, et al. Multi’omics comparison reveals metabolome biochemistry, not microbiome composition or gene expression, corresponds to elevated biogeochemical function in the hyporheic zone. Sci. Total Environ. 2018;642:742–753. doi: 10.1016/j.scitotenv.2018.05.256. - DOI - PubMed
    1. Stegen JC, et al. Influences of organic carbon speciation on hyporheic corridor biogeochemistry and microbial ecology. Nat. Commun. 2018;9:585. doi: 10.1038/s41467-018-02922-9. - DOI - PMC - PubMed
    1. Sengupta A, et al. Spatial gradients in the characteristics of soil-carbon fractions are associated with abiotic features but not microbial communities. Biogeosciences. 2019;16:3911–3928. doi: 10.5194/bg-16-3911-2019. - DOI
    1. Garayburu-Caruso, V. et al. Carbon limitation leads to thermodynamic regulation of aerobic metabolism. bioRxiv10.1101/2020.01.15.905331 (2020).
    1. Hawkes JA, Dittmar T, Patriarca C, Tranvik L, Bergquist J. Evaluation of the orbitrap mass spectrometer for the molecular fingerprinting analysis of natural dissolved organic matter. Anal. Chem. 2016;88:7698–7704. doi: 10.1021/acs.analchem.6b01624. - DOI - PubMed

Publication types