. 2020 Dec 11;3(1):760.
doi: 10.1038/s42003-020-01477-0.

Differential longitudinal establishment of human fecal bacterial communities in germ-free porcine and murine models

Affiliations

Differential longitudinal establishment of human fecal bacterial communities in germ-free porcine and murine models

Nirosh D Aluthge et al. Commun Biol. .

Abstract

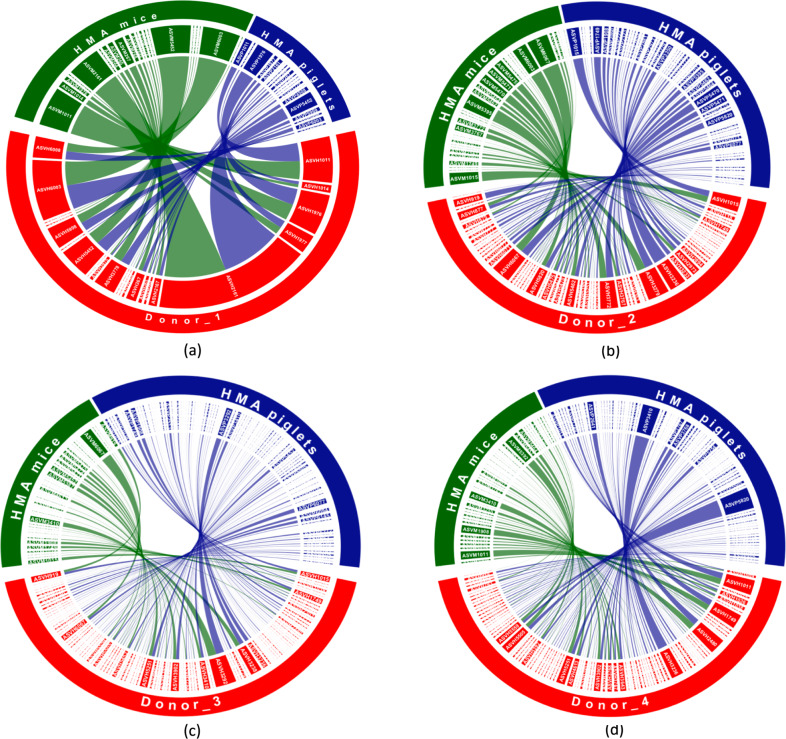
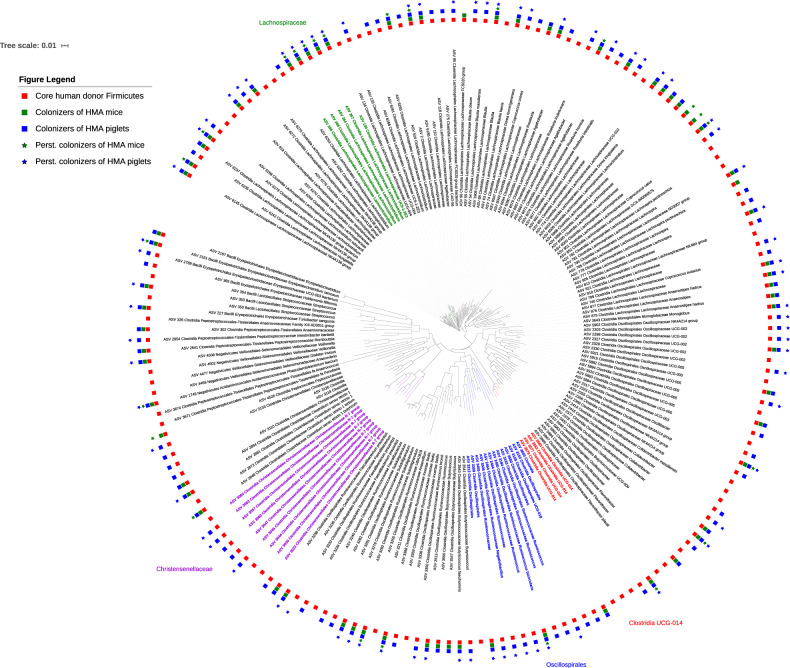
The majority of microbiome studies focused on understanding mechanistic relationships between the host and the microbiota have used mice and other rodents as the model of choice. However, the domestic pig is a relevant model that is currently underutilized for human microbiome investigations. In this study, we performed a direct comparison of the engraftment of fecal bacterial communities from human donors between human microbiota-associated (HMA) piglet and mouse models under identical dietary conditions. Analysis of 16S rRNA genes using amplicon sequence variants (ASVs) revealed that with the exception of early microbiota from infants, the more mature microbiotas tested established better in the HMA piglets compared to HMA mice. Of interest was the greater transplantation success of members belonging to phylum Firmicutes in the HMA piglets compared to the HMA mice. Together, these results provide evidence for the HMA piglet model potentially being more broadly applicable for donors with more mature microbiotas while the HMA mouse model might be more relevant for developing microbiotas such as those of infants. This study also emphasizes the necessity to exercise caution in extrapolating findings from HMA animals to humans, since up to 28% of taxa from some donors failed to colonize either model.


Conflict of interest statement

The authors declare the following competing interests: S.C.F., an author of this publication has disclosed a significant financial interest in NuGUT LLC. In accordance with its Conflict of Interest policy, the University of Nebraska-Lincoln’s Conflict of Interest in Research Committee has determined that this must be disclosed. The remaining authors declare no competing interests.

Figures

Fig. 1
Fig. 1. Box-whisker plots comparing the alpha diversity of the inoculum aliquots among the different donors using the Shannon index.
Statistical comparisons were performed using the Wilcoxon rank-sum test. Boxes with different letters indicate statistically significant differences (p < 0.05). The box represents the 25th and 75th percentiles as the interquartile range (IQR) and the short black line represents the median. The whiskers represent the minimum and maximum values. Outliers are shown as black dots. n = 3 inoculum aliquots for Donor_1 and n = 4 inoculum aliquots or Donor_2, Donor_3, and Donor_4.
Fig. 2
Fig. 2. Principal Coordinate Analysis (PCoA) plots using unweighted UniFrac and Bray-Curtis distances for the bacterial communities in each of the four donor inocula and the fecal samples from the corresponding HMA animal models.
(a) Donor_1, (b) Donor_2, (c) Donor_3, (d) Donor_4. n = 13 (3 piglets/donor, with the exception n = 4 for Donor_1, 2 days post inoculation) and n = 37 mice (Donor_1 = 7, Donor_2 = 10, Donor_3 = 10, Donor_4 = 10). Red circles, human donor inocula; green triangles, HMA mouse fecal samples; blue squares, HMA piglet fecal samples.
Fig. 3
Fig. 3. Comparison of similarity of HMA animal fecal bacterial communities and corresponding human donor bacterial communities.
(a) Unweighted UniFrac distances and (b) Bray–Curtis distances. The box represents the 25th and 75th percentiles as the interquartile range (IQR) and the short black line represents the median. The whiskers represent the minimum and maximum values. Outliers are shown as black dots. Statistical comparisons were performed using the Wilcoxon rank-sum test. ***p < 1 × 10−5; ****p < 1 × 10−10; ns–not significant. n = 13 (3 piglets/donor, with the exception n = 4 for Donor_1, 2 days post inoculation) and n = 37 mice (Donor_1 = 7, Donor_2 = 10, Donor_3 = 10, Donor_4 = 10).
Fig. 4
Fig. 4. Box-whisker plots depicting the variation in alpha diversity between the donor inocula and the HMA animal fecal samples at each sampling time point.
(a) Donor_1, (b) Donor_2, (c) Donor_3, and (d) Donor_4. The box represents the 25th and 75th percentiles as the interquartile range (IQR) and the short black line represents the median. The whiskers represent the minimum and maximum values. Outliers are shown as black dots. Statistical comparisons are based on the Wilcoxon rank-sum test. *p < 0.05; **p < 0.01; ns–not significant. n = 13 (3 piglets/donor, with the exception n = 4 for Donor_1, 2 days post inoculation) and n = 37 mice (Donor_1 = 7, Donor_2 = 10, Donor_3 = 10, Donor_4 = 10).
Fig. 5
Fig. 5. Chord diagram representing the colonization patterns of core donor ASVs in the two HMA animal models.
(a) Donor_1, (b) Donor_2, (c) Donor_3, (d) Donor_4. Each sector represents an ASV and the size of the sector corresponds to the mean relative abundance of that ASV in the host species. Links indicate which core donor ASVs established in each animal model and the widths at each end of a link are proportional to the abundance of that ASV in the respective host species. Core donor ASVs which failed to colonize both HMA animal models are not shown. ASVs have been designated according to the following example: ASV_1 is ASVH1 in human donors, ASVM1 in HMA mice, and ASVP1 in HMA piglets. n = 13 (3 piglets/donor, with the exception n = 4 for Donor_1, 2 days post inoculation) and n = 37 mice (Donor_1 = 7, Donor_2 = 10, Donor_3 = 10, Donor_4 = 10).
Fig. 6
Fig. 6. Phylogenetic tree depicting the overall distribution of core donor ASVs classified as Firmicutes among the two HMA animal models.
Red squares indicate the presence of core Firmicutes ASVs in the human donors while the green squares and blue squares indicate which of those Firmicutes ASVs were able to colonize the HMA mice and piglets, respectively. Green stars indicate persistent colonizers of HMA mice and blue stars indicate persistent colonizers of HMA piglets. n = 13 (3 piglets/donor, with the exception n = 4 for Donor_1, 2 days post inoculation) and n = 37 mice (Donor_1 = 7, Donor_2 = 10, Donor_3 = 10, Donor_4 = 10).

References

    1. Valdes AM, Walter J, Segal E, Spector TD. Role of the gut microbiota in nutrition and health. Bmj. 2018;361:k2179. doi: 10.1136/bmj.k2179. - DOI - PMC - PubMed
    1. Lynch SV, Boushey HA. The microbiome and development of allergic disease. Curr. Opin. Allergy Clin. Immunol. 2016;16:165–171. doi: 10.1097/ACI.0000000000000255. - DOI - PMC - PubMed
    1. Malan-Muller S, et al. The gut microbiome and mental health: implications for anxiety- and trauma-related disorders. Omics. 2018;22:90–107. doi: 10.1089/omi.2017.0077. - DOI - PubMed
    1. Young VB. The role of the microbiome in human health and disease: an introduction for clinicians. Bmj. 2017;356:j831. doi: 10.1136/bmj.j831. - DOI - PubMed
    1. Mai V, Prosperi M, Yaghjyan L. Moving microbiota research toward establishing causal associations that represent viable targets for effective public health interventions. Ann. Epidemiol. 2016;26:306–310. doi: 10.1016/j.annepidem.2016.03.011. - DOI - PubMed

Publication types