. 2020 Dec 11;10(1):21782.
doi: 10.1038/s41598-020-78871-5.

Long-term exposure of human endothelial cells to metformin modulates miRNAs and isomiRs

Affiliations

Long-term exposure of human endothelial cells to metformin modulates miRNAs and isomiRs

Angelica Giuliani et al. Sci Rep. .

Abstract

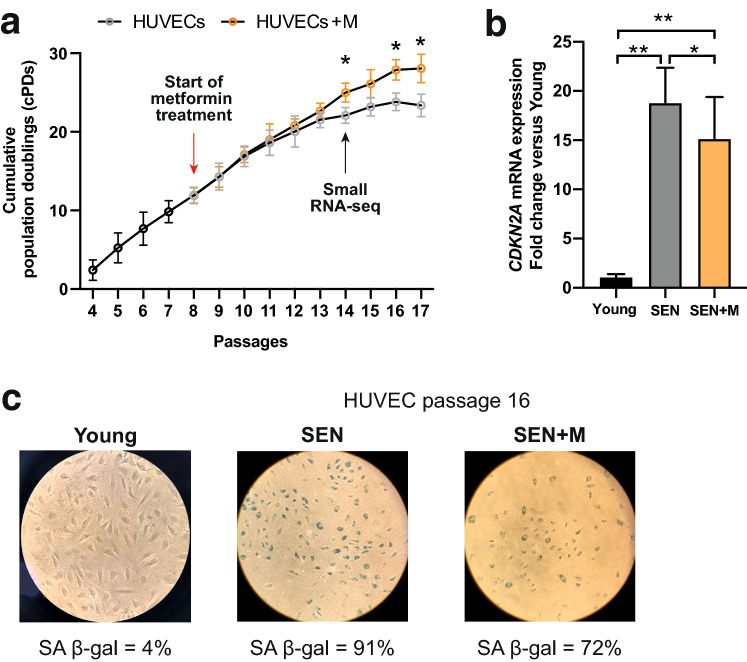
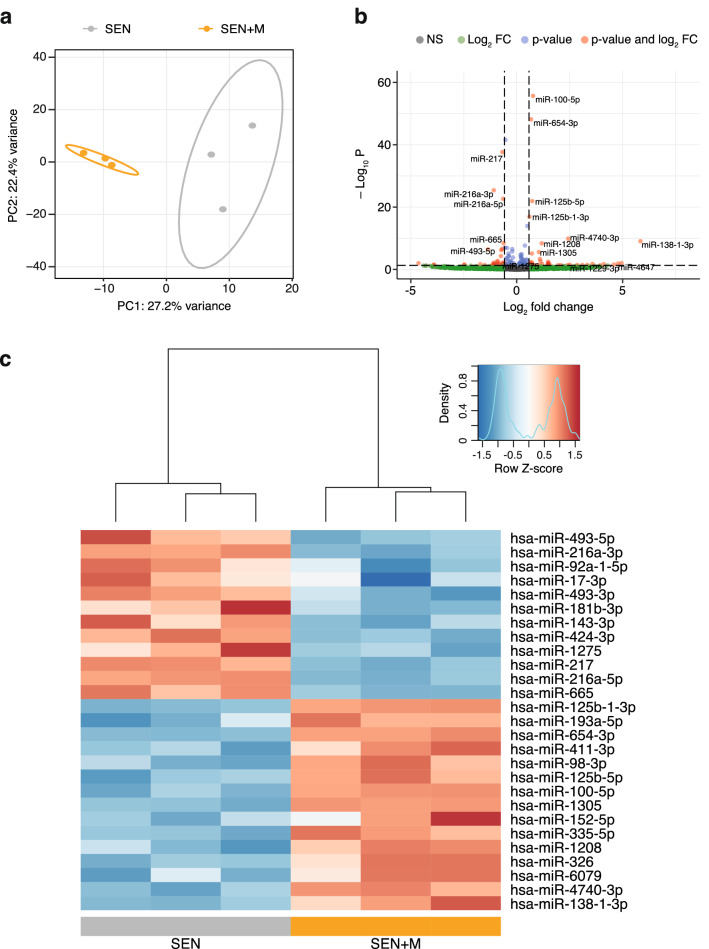
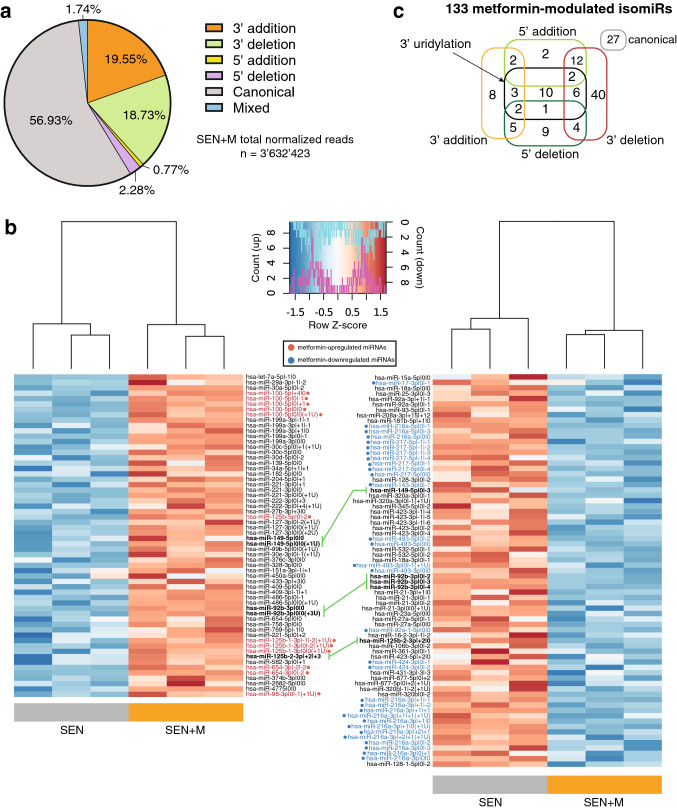
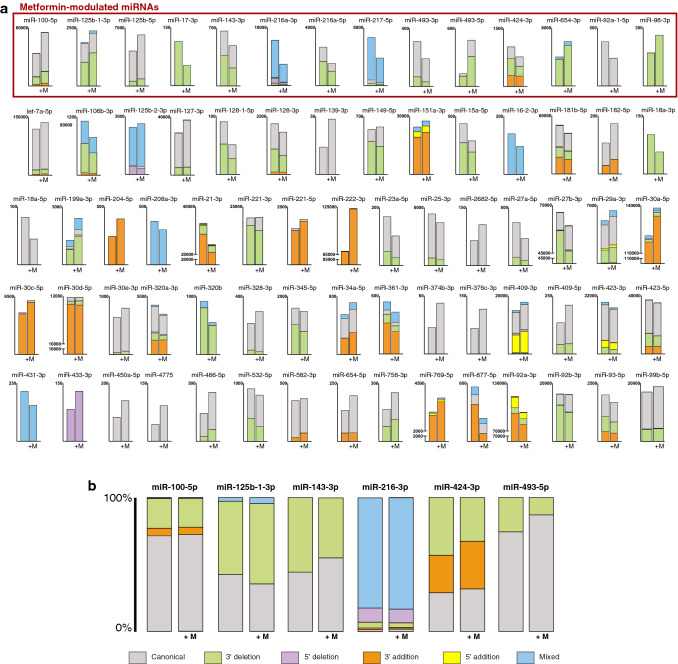
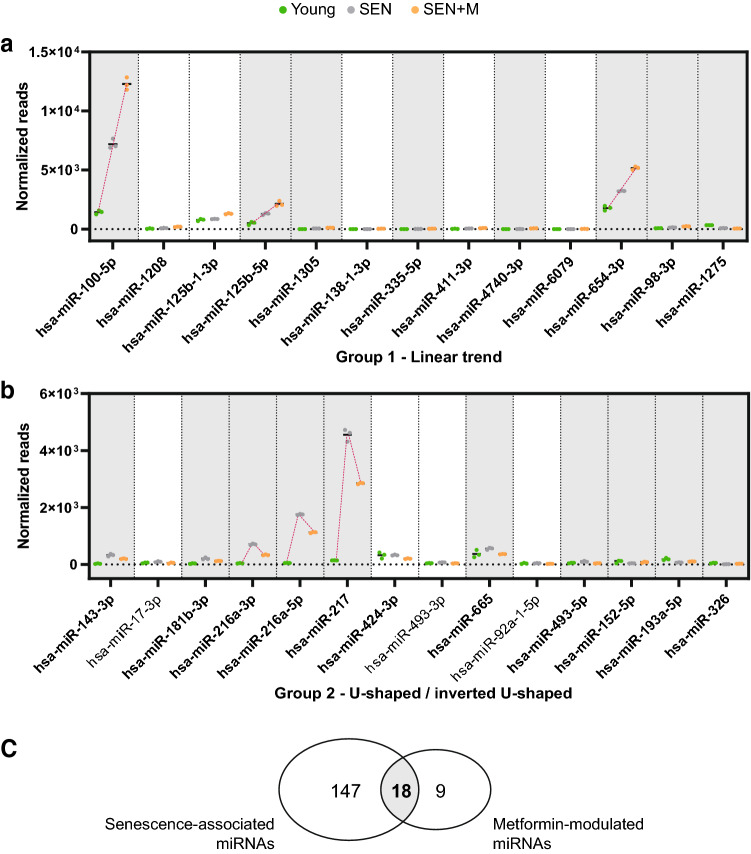
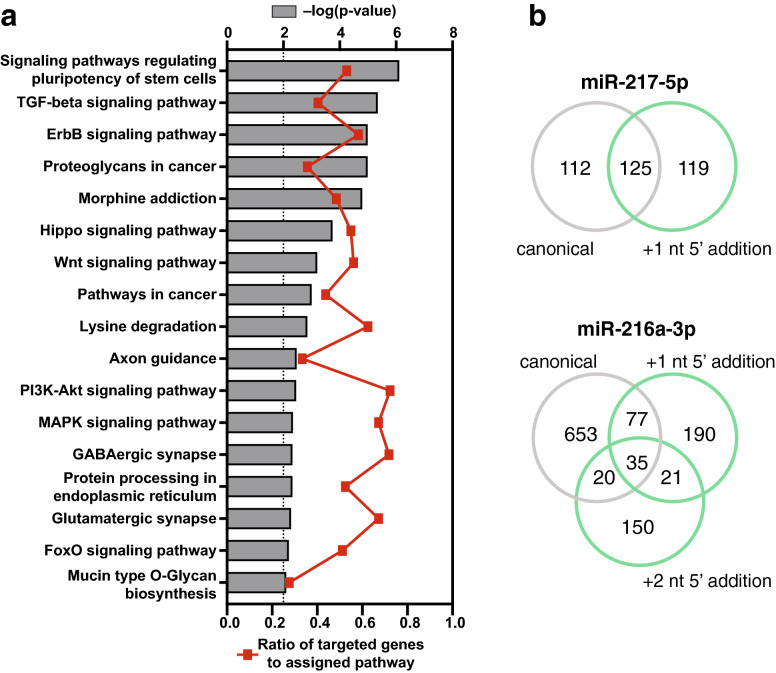
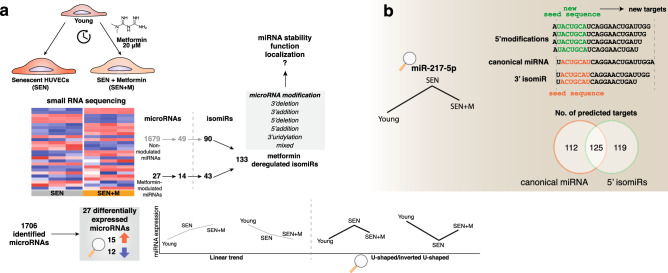
Increasing evidence suggest that the glucose-lowering drug metformin exerts a valuable anti-senescence role. The ability of metformin to affect the biogenesis of selected microRNAs (miRNAs) was recently suggested. MicroRNA isoforms (isomiRs) are distinct variations of miRNA sequences, harboring addition or deletion of one or more nucleotides at the 5' and/or 3' ends of the canonical miRNA sequence. We performed a comprehensive analysis of miRNA and isomiR profile in human endothelial cells undergoing replicative senescence in presence of metformin. Metformin treatment was associated with the differential expression of 27 miRNAs (including miR-100-5p, -125b-5p, -654-3p, -217 and -216a-3p/5p). IsomiR analysis revealed that almost 40% of the total miRNA pool was composed by non-canonical sequences. Metformin significantly affects the relative abundance of 133 isomiRs, including the non-canonical forms of the aforementioned miRNAs. Pathway enrichment analysis suggested that pathways associated with proliferation and nutrient sensing are modulated by metformin-regulated miRNAs and that some of the regulated isomiRs (e.g. the 5' miR-217 isomiR) are endowed with alternative seed sequences and share less than half of the predicted targets with the canonical form. Our results show that metformin reshapes the senescence-associated miRNA/isomiR patterns of endothelial cells, thus expanding our insight into the cell senescence molecular machinery.


Conflict of interest statement

The authors declare no competing interests.

Figures

Figure 1
Figure 1
Characterization of replicative senescence in HUVECs. (a) Cumulative population doubling (cPD) curves. Metformin treatment was started after passage 7 (cPD = 9.83) and conducted at each medium replacement until complete growth arrest. (b) CDKN2A mRNA relative expression in young, SEN and SEN + M. Data are mean ± SD. *p < 0.05; **p < 0.01. (c) Representative positivity and quantification of the SA β-Gal staining in young, senescent (passage 16, SEN) and SEN HUVECs treated with metformin (SEN + M). HUVECs human umbilical vein endothelial cells, SA senescence-associated.
Figure 2
Figure 2
MiR-seq analysis of senescent HUVECs treated with metformin. (a) PCA plot of the first two principal components (PC1 and PC2) using transformed normalized miR-seq data. Circles represent 95% confidence intervals. (b) Volcano plot of log2 fold-changes (FC, SEN + M compared to SEN) vs. -log10 adjusted p-values using transformed normalized miR-seq data. MiRNAs with FC ≥ 1.5 (log2 FC ≥ 0.585) and FDR < 0.05 (− log10 p-value < 1.30) are highlighted in red. (c) Heatmap showing clustering of samples and miRNAs differentially expressed in SEN + M compared to SEN. Data is shown following Z-score transformation. Red color indicates Z-scores > 0 (above mean), blue colors indicate Z-scores < 0 (below mean). MiRNAs are ranked according to the lowest log2 FC.
Figure 3
Figure 3
IsomiR analysis of senescent HUVECs treated with metformin. (a) Pie chart showing the proportion of isomiR variations in SEN + M samples. (b) Heatmaps showing clustering of samples, and isomiRs upregulated (left panel) and downregulated (right panel) in SEN + M compared to SEN, with a FC ≥ 1.5 and FDR < 0.05 cut-off. Data is shown following Z-score transformation. Red color indicates Z-scores > 0 (above mean), blue color indicates Z-scores < 0 (below mean). IsomiR labels are marked and colored in red or blue according to the upregulation or downregulation of their parent miRNA in SEN + M, respectively. Green lines connect variations of the same miRNA (labeled in bold) showing opposite modulation between SEN + M and SEN. IsomiRs are ordered by the MIMAT ID of the parent miRNA. For the isomiR nomenclature, the reader is referred to the Materials and Methods section. (c) Diagram reporting the frequencies of the different type of variations among isomiRs modulated by metformin treatment.
Figure 4
Figure 4
Proportions of isomiR variations within miRNAs modulated by metformin. (a) Comparison of normalized reads of the different types of isomiR variations of miRNAs including at least one isomiR differentially regulated by metformin. The 14 metformin-modulated miRNAs including at least one differentially regulated isomiR are highlighted. (b) Proportions of isomiR variation types within 6 out of the 27 miRNAs differentially regulated by metformin showing significant isomiR redistribution between SEN and SEN + M.
Figure 5
Figure 5
Influence of metformin treatment on senescence-associated miRNA modulation. Normalized reads of 27 miRNAs differentially modulated in Young (green), SEN (gray), and SEN + M (orange), grouped according to the linear (a) or U-shaped/inverted U-shaped (b) pattern of modulation. MiRNAs with a significant likelihood-ratio test are highlighted in bold. Senescence-associated miRNAs are highlighted with a gray background. (c) Venn diagram reporting the number of miRNAs differentially regulated in SEN compared to Young cells and in SEN + M compared to SEN.
Figure 6
Figure 6
Target analysis of miRNAs and isomiRs affected by metformin. (a) KEGG pathways significantly enriched in predicted target genes of the 11 miRNAs showing a significant U-shaped/inverted U-shaped trend among Young/SEN/SEN + M samples. Pathways are ranked according to the significance of enrichment (grey bars, upper y-axis). Ratios referring to the proportion of targeted genes related to the total number of genes in each pathway are displayed (red line graph, bottom y-axis). (b) Results of the TargetScan custom analysis on the canonical and 5′ isomiR seed sequences of miR-217-5p and miR-216-3p.
Figure 7
Figure 7
(a) Summary of the effects of metformin treatment on the miRNA/isomiR pool of HUVECs undergoing replicative senescence. Metformin differentially regulates the expression of 27 miRNAs. Two different trends in miRNA modulation were observed with reference to the Young/SEN/SEN + M sequence, i.e. a linear increasing/decreasing trend and a ‘U-shaped’/‘inverted U-shaped’ trend. Moreover, metformin treatment altered the expression of 133 isomiRs, related to 14 differentially expressed miRNAs and 59 non differentially expressed miRNAs. (b) Metformin treatment induced a partial reversal of the senescence-associated expression of miR-217-5p, including its 5′ isomiRs, which are associated to a shifting of the seed sequence. The inclusion of these additional seed sequences into the targetome analysis yielded a considerably greater number of target genes, most of which were not shared with the canonical miRNAs.

References

    1. 1American Diabetes Association. 9. Pharmacologic Approaches to Glycemic Treatment: Standards of Medical Care in Diabetes-2020. Diabetes Care43, S98-S110. doi:10.2337/dc20-S009 (2020). - PubMed
    1. Salvatore T, et al. Metformin: an old drug against old age and associated morbidities. Diabetes Res. Clin. Pract. 2020;160:108025. doi: 10.1016/j.diabres.2020.108025. - DOI - PubMed
    1. Han Y, et al. Effect of metformin on all-cause and cardiovascular mortality in patients with coronary artery diseases: a systematic review and an updated meta-analysis. Cardiovasc. Diabetol. 2019;18:96. doi: 10.1186/s12933-019-0900-7. - DOI - PMC - PubMed
    1. Campbell JM, Bellman SM, Stephenson MD, Lisy K. Metformin reduces all-cause mortality and diseases of ageing independent of its effect on diabetes control: a systematic review and meta-analysis. Ageing Res. Rev. 2017;40:31–44. doi: 10.1016/j.arr.2017.08.003. - DOI - PubMed
    1. Barzilai N, Crandall JP, Kritchevsky SB, Espeland MA. Metformin as a tool to target aging. Cell Metab. 2016;23:1060–1065. doi: 10.1016/j.cmet.2016.05.011. - DOI - PMC - PubMed

Publication types

MeSH terms